***Last / Change / Volume data in this table is the closing quote data***
Symbol/Exchange
Company Name
Industry Group |
PRICE |
CHANGE
(%Change) |
Day High |
Volume
(% DAV)
(% 50 day avg vol) |
52 Wk Hi
% From Hi |
Featured
Date |
Price
Featured |
Pivot Featured |
|
Max Buy |
THO
-
NYSE
Thor Industries Inc
AUTOMOTIVE - Recreational Vehicles
|
$107.94
|
+0.80
0.75% |
$108.10
|
921,561
110.90% of 50 DAV
50 DAV is 831,000
|
$115.74
-6.74%
|
6/7/2017
|
$102.95
|
PP = $98.92
|
|
MB = $103.87
|
Most Recent Note - 6/22/2017 8:45:57 PM
G - Stubbornly holding its ground just above its "max buy" level. Disciplined investors avoid chasing extended stocks.
>>> FEATURED STOCK ARTICLE : Some Overhead Supply Remains After Latest Technical Breakout - 6/8/2017 |
View all notes |
Set NEW NOTE alert |
Company Profile |
SEC
News |
Chart |
Request a new note
C
A
S
I |
SBCF
-
NASDAQ
Seacoast Banking Corp Fl
BANKING - Regional - Mid-Atlantic Banks
|
$23.36
|
-0.48
-2.01% |
$23.87
|
1,291,108
420.56% of 50 DAV
50 DAV is 307,000
|
$25.88
-9.74%
|
6/9/2017
|
$24.13
|
PP = $25.98
|
|
MB = $27.28
|
Most Recent Note - 6/19/2017 5:30:01 PM
Y - Quietly consolidating within striking distance of the new pivot point cited based on its 4/25/17 high. Previously noted - "Subsequent volume-driven gains for new highs may trigger a new technical buy signal. Rebound above the 50 DMA line helped its outlook improve. Fundamentals remain strong."
>>> FEATURED STOCK ARTICLE : Relative Strength Rating Slumped After Lingering Below 50 DMA - 5/25/2017 |
View all notes |
Set NEW NOTE alert |
Company Profile |
SEC
News |
Chart |
Request a new note
C
A
S
I |
BLMT
-
NASDAQ
B S B Bancorp
BANKING - Regional - Midwest Banks
|
$29.10
|
-0.05
-0.17% |
$29.20
|
115,513
687.58% of 50 DAV
50 DAV is 16,800
|
$30.75
-5.37%
|
6/16/2017
|
$29.85
|
PP = $29.80
|
|
MB = $31.29
|
 Most Recent Note - 6/23/2017 8:49:32 PM
G - Color code is changed to green after slumping below its 50 DMA line. Its Relative Strength rating has slumped to 71, below the 80+ minimum guideline for buy candidates.
>>> FEATURED STOCK ARTICLE : Perched Near High After Volume-Driven Gains - 6/16/2017 |
View all notes |
Set NEW NOTE alert |
Company Profile |
SEC
News |
Chart |
Request a new note
C
A
S
I |
BERY
-
NYSE
Berry Global Group Inc
CONSUMER NON-DURABLES - Packaging and Containers
|
$57.04
|
-0.34
-0.59% |
$58.13
|
1,568,435
130.05% of 50 DAV
50 DAV is 1,206,000
|
$58.95
-3.24%
|
5/26/2017
|
$58.31
|
PP = $57.04
|
|
MB = $59.89
|
Most Recent Note - 6/22/2017 8:43:42 PM
Y - Still consolidating in a tight range above its pivot point, quietly holding its ground near its 52-week high. The 50 DMA line ($55.04) defines near term support.
>>> FEATURED STOCK ARTICLE : Rising From Advanced Base With Above Average Volume - 5/26/2017 |
View all notes |
Set NEW NOTE alert |
Company Profile |
SEC
News |
Chart |
Request a new note
C
A
S
I |
EW
-
NYSE
Edwards Lifesciences Cp
HEALTH SERVICES - Medical Appliances and Equipment
|
$120.15
|
+1.62
1.37% |
$120.24
|
1,793,368
122.75% of 50 DAV
50 DAV is 1,461,000
|
$121.75
-1.31%
|
5/16/2017
|
$114.12
|
PP = $113.04
|
|
MB = $118.69
|
Most Recent Note - 6/19/2017 5:25:23 PM
G - Posted a solid gain today, and its color code is changed to green after rallying above its recent high and above its "max buy" level. Perched within close striking distance of its all-time high
>>> FEATURED STOCK ARTICLE : Some Overhead Supply Remains For High Ranked Medical Firm - 5/17/2017 |
View all notes |
Set NEW NOTE alert |
Company Profile |
SEC
News |
Chart |
Request a new note
C
A
S
I |
Symbol/Exchange
Company Name
Industry Group |
PRICE |
CHANGE
(%Change) |
Day High |
Volume
(% DAV)
(% 50 day avg vol) |
52 Wk Hi
% From Hi |
Featured
Date |
Price
Featured |
Pivot Featured |
|
Max Buy |
NTES
-
NASDAQ
Netease Inc Adr
INTERNET - Internet Information Providers
|
$333.56
|
+8.28
2.55% |
$333.78
|
1,358,388
102.60% of 50 DAV
50 DAV is 1,324,000
|
$327.26
1.93%
|
6/8/2017
|
$310.76
|
PP = $307.62
|
|
MB = $323.00
|
Most Recent Note - 6/23/2017 8:58:17 PM
G - Hit another new high with today's 6th consecutive gain, getting extended from its prior base. Recent gains lacked great volume conviction. Fundamentals remain strong and it reported earnings +52% on +62% sales revenues for the Mar '17 quarter.
>>> FEATURED STOCK ARTICLE : Encountered Distributional Pressure After Hitting New Highs - 6/9/2017 |
View all notes |
Set NEW NOTE alert |
Company Profile |
SEC
News |
Chart |
Request a new note
C
A
S
I |
STMP
-
NASDAQ
Stamps.com Inc
INTERNET - Internet Software and Services
|
$149.05
|
+2.75
1.88% |
$150.75
|
558,922
80.77% of 50 DAV
50 DAV is 692,000
|
$150.85
-1.19%
|
5/24/2017
|
$133.10
|
PP = $136.10
|
|
MB = $142.91
|
Most Recent Note - 6/20/2017 5:23:33 PM
G - Pulled back from its 52-week high with a loss on light volume. It remains above its "max buy" level. Prior high ($136 on 2/22/17) defines near term support to watch.
>>> FEATURED STOCK ARTICLE : Rallying From Bottom of 13-Week Cup Shaped Base - 5/24/2017 |
View all notes |
Set NEW NOTE alert |
Company Profile |
SEC
News |
Chart |
Request a new note
C
A
S
I |
MELI
-
NASDAQ
Mercadolibre Inc
INTERNET - Internet Software and; Services
|
$275.23
|
-0.52
-0.19% |
$277.73
|
483,600
78.00% of 50 DAV
50 DAV is 620,000
|
$297.95
-7.63%
|
6/15/2017
|
$261.73
|
PP = $297.95
|
|
MB = $312.85
|
Most Recent Note - 6/21/2017 6:32:15 PM
Y - Found support at its 50 DMA line. Valid secondary buy point exists up to +5% above the latest high after successfully testing support at its 10-week moving average line. More damaging losses would raise concerns and hurt its outlook.
>>> FEATURED STOCK ARTICLE : Test of 10-Week Moving Average May Be a Secondary Buy Point - 6/15/2017 |
View all notes |
Set NEW NOTE alert |
Company Profile |
SEC
News |
Chart |
Request a new note
C
A
S
I |
HTHT
-
NASDAQ
China Lodging Group Ads
LEISURE - Lodging
|
$82.70
|
+0.42
0.51% |
$82.94
|
288,223
123.17% of 50 DAV
50 DAV is 234,000
|
$88.08
-6.11%
|
9/29/2016
|
$46.12
|
PP = $47.82
|
|
MB = $50.21
|
Most Recent Note - 6/21/2017 1:38:25 PM
G - Finding support and posting a volume-driven gain today after slumping toward its 50 DMA line ($73.81) defining important near-term support to watch.
>>> FEATURED STOCK ARTICLE : Traded Up 108% in 10 Months Since First Highlighted - 5/18/2017 |
View all notes |
Set NEW NOTE alert |
Company Profile |
SEC
News |
Chart |
Request a new note
C
A
S
I |
BEAT
-
NASDAQ
BioTelemetry Inc
Medical-Services
|
$29.75
|
+0.30
1.02% |
$29.95
|
478,188
91.43% of 50 DAV
50 DAV is 523,000
|
$34.00
-12.50%
|
2/14/2017
|
$25.10
|
PP = $24.55
|
|
MB = $25.78
|
Most Recent Note - 6/20/2017 3:38:39 PM
G - Consolidating near its 50 DMA line ($29.83). Prior lows in the $26.50 - $27.00 area define the next important level of support. Raised fundamental concerns with sub par Mar '17 earnings that were repeatedly noted.
>>> FEATURED STOCK ARTICLE : Lingering Below 50-Day Moving Average Line - 6/1/2017 |
View all notes |
Set NEW NOTE alert |
Company Profile |
SEC
News |
Chart |
Request a new note
C
A
S
I |
Symbol/Exchange
Company Name
Industry Group |
PRICE |
CHANGE
(%Change) |
Day High |
Volume
(% DAV)
(% 50 day avg vol) |
52 Wk Hi
% From Hi |
Featured
Date |
Price
Featured |
Pivot Featured |
|
Max Buy |
ULTA
-
NYSE
Ulta Beauty Inc
SPECIALTY RETAIL - Specialty Retail, Other
|
$284.71
|
+0.57
0.20% |
$286.19
|
822,758
113.37% of 50 DAV
50 DAV is 725,700
|
$314.86
-9.58%
|
5/5/2017
|
$293.17
|
PP = $289.37
|
|
MB = $303.84
|
Most Recent Note - 6/22/2017 1:20:45 PM
G - Slumping further today after violating its 50 DMA line and retreating below its pivot point, enduring mild distributional pressure. Its Relative Strength rating fell to 69, below the 80+ minimum guideline for buy candidates. A rebound above the 50 DMA line ($293) is needed for its outlook to improve. Prior low ($277.68 on 5/24/17) defines the next important support. See the latest FSU analysis for more details and an annotated graph.
>>> FEATURED STOCK ARTICLE : Violation of 50-Day Moving Average and Slumping Relative Strength - 6/21/2017 |
View all notes |
Set NEW NOTE alert |
Company Profile |
SEC
News |
Chart |
Request a new note
C
A
S
I |
ESNT
-
NYSE
Essent Group Ltd
Finance-MrtgandRel Svc
|
$36.00
|
-0.01
-0.03% |
$36.35
|
472,299
86.66% of 50 DAV
50 DAV is 545,000
|
$39.50
-8.86%
|
4/4/2017
|
$36.38
|
PP = $36.81
|
|
MB = $38.65
|
Most Recent Note - 6/20/2017 5:21:33 PM
G - Consolidating just below its 50 DMA line ($36.81). Subsequent losses below the prior low ($34.08 on 5/05/17) would raise greater concerns and trigger a worrisome technical sell signal. See the latest FSU analysis for more details and a new annotated graph.
>>> FEATURED STOCK ARTICLE : Sputtering Below its 50-Day Moving Average - 6/20/2017 |
View all notes |
Set NEW NOTE alert |
Company Profile |
SEC
News |
Chart |
Request a new note
C
A
S
I |
FIVE
-
NASDAQ
Five Below Inc
Retail-DiscountandVariety
|
$47.92
|
-0.56
-1.16% |
$48.76
|
969,312
81.61% of 50 DAV
50 DAV is 1,187,700
|
$54.13
-11.47%
|
6/2/2017
|
$50.76
|
PP = $52.63
|
|
MB = $55.26
|
Most Recent Note - 6/20/2017 4:17:10 PM
G - Still sputtering below its 50 DMA line ($49.97), and a rebound above that short-term average is needed for its outlook to improve. Failed to produce confirming gains after previously noted - "A convincing volume-driven gain above the pivot point is still needed to clinch a proper technical buy signal."
>>> FEATURED STOCK ARTICLE : Retail - Discount & Variety Firm Perched Near Highs - 6/2/2017 |
View all notes |
Set NEW NOTE alert |
Company Profile |
SEC
News |
Chart |
Request a new note
C
A
S
I |
MTSI
-
NASDAQ
Macom Tech Solution Hldg
Elec-Semiconductor Mfg
|
$58.26
|
+1.76
3.12% |
$58.57
|
1,298,966
140.43% of 50 DAV
50 DAV is 925,000
|
$61.70
-5.58%
|
5/16/2017
|
$52.52
|
PP = $53.89
|
|
MB = $56.58
|
Most Recent Note - 6/23/2017 8:52:44 PM
G - Posted a solid gain today on higher volume. The recent lows and its 50 DMA line define important support in the $54-55 area where violations would raise concerns and trigger technical sell signals.
>>> FEATURED STOCK ARTICLE : Big Breakout Gain With More Than 5 Times Average Volume - 5/16/2017 |
View all notes |
Set NEW NOTE alert |
Company Profile |
SEC
News |
Chart |
Request a new note
C
A
S
I |
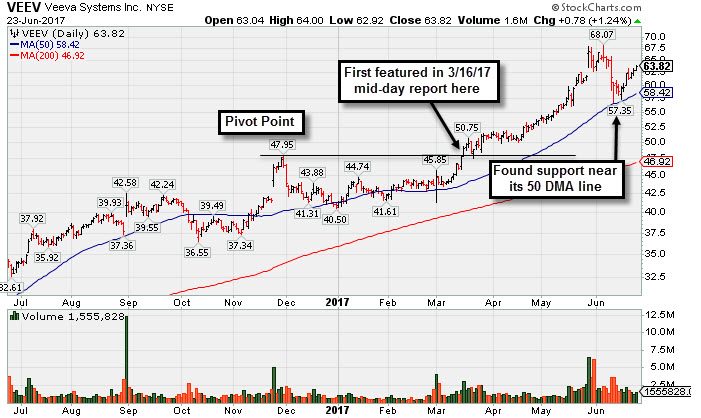
VEEV
-
NYSE
Veeva Systems Inc Cl A
Computer Sftwr-Medical
|
$63.82
|
+0.78
1.24% |
$64.00
|
1,555,828
89.83% of 50 DAV
50 DAV is 1,732,000
|
$68.07
-6.24%
|
3/16/2017
|
$49.00
|
PP = $48.05
|
|
MB = $50.45
|
Most Recent Note - 6/23/2017 8:45:12 PM
G - Rebounding toward its prior high after finding support at Its 50 DMA line ($58.42). That short term average and recent low ($56.94 on 6/12/17) define important near-term support to watch. See the latest FSU analysis for more details and a new annotated graph.
>>> FEATURED STOCK ARTICLE : Rebounding Since Testing Support at 50-Day Moving Average Line - 6/23/2017 |
View all notes |
Set NEW NOTE alert |
Company Profile |
SEC
News |
Chart |
Request a new note
C
A
S
I |
Symbol/Exchange
Company Name
Industry Group |
PRICE |
CHANGE
(%Change) |
Day High |
Volume
(% DAV)
(% 50 day avg vol) |
52 Wk Hi
% From Hi |
Featured
Date |
Price
Featured |
Pivot Featured |
|
Max Buy |
ANET
-
NYSE
Arista Networks Inc
TELECOMMUNICATIONS - Communication Equipment
|
$161.62
|
+2.84
1.79% |
$162.97
|
1,527,471
185.15% of 50 DAV
50 DAV is 825,000
|
$159.48
1.34%
|
4/17/2017
|
$132.75
|
PP = $135.27
|
|
MB = $142.03
|
Most Recent Note - 6/22/2017 8:39:13 PM
G - Hit another new high today. Very extended from any sound base. Its 50 DMA line ($145.36) and prior lows define near-term support to watch.
>>> FEATURED STOCK ARTICLE : Computer Networking Firm Very Extended From Any Sound Base - 6/6/2017 |
View all notes |
Set NEW NOTE alert |
Company Profile |
SEC
News |
Chart |
Request a new note
C
A
S
I |
GRUB
-
NYSE
Grubhub Inc
COMPUTER SOFTWARE and SERVICES - Technical and System Software
|
$47.70
|
+1.37
2.96% |
$47.84
|
2,537,405
104.76% of 50 DAV
50 DAV is 2,422,000
|
$47.75
-0.10%
|
6/21/2017
|
$47.33
|
PP = $46.94
|
|
MB = $49.29
|
Most Recent Note - 6/23/2017 8:55:11 PM
Y - Posted a solid gain today with near average volume and managed a new high close. A new pivot point was cited based on its 5/08/17 high plus 10 cents. A confirming gain backed by at least +40% above average volume and strong close above the pivot point may clinch a technical buy signal.
>>> FEATURED STOCK ARTICLE : Stalled After Reaching New Highs and Encountered Mild Pressure - 5/22/2017 |
View all notes |
Set NEW NOTE alert |
Company Profile |
SEC
News |
Chart |
Request a new note
C
A
S
I |
IBP
-
NYSE
Installed Building Prod
DIVERSIFIED SERVICES - Business/Management Services
|
$54.00
|
+1.25
2.37% |
$55.10
|
482,755
309.46% of 50 DAV
50 DAV is 156,000
|
$55.45
-2.61%
|
6/13/2017
|
$54.25
|
PP = $55.55
|
|
MB = $58.33
|
Most Recent Note - 6/23/2017 2:20:30 PM
Y - Rallying near its 52-week high with today's volume-driven gain. Perched within close striking distance of the new pivot point cited based on its 4/27/17 high plus 10 cents. Subsequent volume-driven gains above the pivot point may trigger a new technical buy signal. Its 50 DMA line ($51.29) defines near-term support above the recent low ($46.65 on 5/09/17).
>>> FEATURED STOCK ARTICLE : Consolidating Near 50-Day Moving Average Line - 6/5/2017 |
View all notes |
Set NEW NOTE alert |
Company Profile |
SEC
News |
Chart |
Request a new note
C
A
S
I |
NCOM
-
NASDAQ
National Commerce Corp
BANKING - Regional - Southeast Banks
|
$38.60
|
+0.45
1.18% |
$38.70
|
294,888
1,016.86% of 50 DAV
50 DAV is 29,000
|
$40.00
-3.50%
|
4/25/2017
|
$38.95
|
PP = $40.09
|
|
MB = $42.09
|
Most Recent Note - 6/21/2017 2:00:01 PM
Y - Still perched within close striking distance of its 52-week high and consolidating above its 50 DMA line ($38.17). Subsequent gains above the pivot point backed by a minimum of +40% above average volume may trigger a technical buy signal. Prior lows in the $36-35 area define the next important support level.
>>> FEATURED STOCK ARTICLE : Sputtering Near 50-Day Moving Average After Stalling - 5/30/2017 |
View all notes |
Set NEW NOTE alert |
Company Profile |
SEC
News |
Chart |
Request a new note
C
A
S
I |
INGN
-
NASDAQ
Inogen Inc
HEALTH SERVICES - Medical Instruments and Supplies
|
$94.13
|
-2.10
-2.18% |
$96.22
|
258,064
133.71% of 50 DAV
50 DAV is 193,000
|
$97.71
-3.66%
|
4/17/2017
|
$76.77
|
PP = $80.04
|
|
MB = $84.04
|
Most Recent Note - 6/23/2017 8:51:04 PM
G - Pulled back from its all-time high hit on the prior session. It is very extended from its prior base. Near-term support is its 50 DMA line ($86.05).
>>> FEATURED STOCK ARTICLE : Perched at All Time High Following Volume-Driven Gains - 5/31/2017 |
View all notes |
Set NEW NOTE alert |
Company Profile |
SEC
News |
Chart |
Request a new note
C
A
S
I |
Symbol/Exchange
Company Name
Industry Group |
PRICE |
CHANGE
(%Change) |
Day High |
Volume
(% DAV)
(% 50 day avg vol) |
52 Wk Hi
% From Hi |
Featured
Date |
Price
Featured |
Pivot Featured |
|
Max Buy |
HQY
-
NASDAQ
Healthequity Inc
COMPUTER SOFTWARE and SERVICES - Healthcare Information Service
|
$51.75
|
+0.70
1.37% |
$52.03
|
1,122,167
231.37% of 50 DAV
50 DAV is 485,000
|
$54.95
-5.82%
|
6/7/2017
|
$50.01
|
PP = $49.35
|
|
MB = $51.82
|
Most Recent Note - 6/20/2017 4:18:31 PM
G - Quietly consolidating near its "max buy" level and above prior highs in the $49 area defining initial support.
>>> FEATURED STOCK ARTICLE : High Volume Breakout Quickly Getting Extended - 6/7/2017 |
View all notes |
Set NEW NOTE alert |
Company Profile |
SEC
News |
Chart |
Request a new note
C
A
S
I |
PLAY
-
NASDAQ
Dave & Buster's Ent Inc
Retail-Restaurants
|
$67.51
|
+0.34
0.51% |
$68.10
|
1,008,747
145.35% of 50 DAV
50 DAV is 694,000
|
$73.48
-8.12%
|
2/23/2017
|
$55.41
|
PP = $58.35
|
|
MB = $61.27
|
Most Recent Note - 6/20/2017 3:59:42 PM
G - Extended from any sound base, slumping toward its 50 DMA line ($65.75) and prior lows defining near-term support to watch.
>>> FEATURED STOCK ARTICLE : Perched Near Record High After Solid April '17 Quarterly Results - 6/12/2017 |
View all notes |
Set NEW NOTE alert |
Company Profile |
SEC
News |
Chart |
Request a new note
C
A
S
I |
OLLI
-
NASDAQ
Ollie's Bargain Outlet
Retail-DiscountandVariety
|
$39.15
|
-0.15
-0.38% |
$39.65
|
4,553,202
664.70% of 50 DAV
50 DAV is 685,000
|
$44.08
-11.17%
|
3/27/2017
|
$32.80
|
PP = $33.55
|
|
MB = $35.23
|
Most Recent Note - 6/20/2017 5:25:45 PM
G - Pulled back today on light volume. It is extended from any sound base. Its 50 DMA line ($39.52) and recent low ($37.60 on 5/16/17) define near-term support to watch on pullbacks. Fundamentals remain strong.
>>> FEATURED STOCK ARTICLE : Retailer Rallied +25% in 2 Months Since Featured - 5/19/2017 |
View all notes |
Set NEW NOTE alert |
Company Profile |
SEC
News |
Chart |
Request a new note
C
A
S
I |
MOMO
-
NASDAQ
Momo Inc Ads Cl A
INTERNET - Content
|
$39.35
|
+0.42
1.08% |
$39.59
|
3,228,752
46.22% of 50 DAV
50 DAV is 6,985,000
|
$45.95
-14.36%
|
3/7/2017
|
$29.71
|
PP = $27.83
|
|
MB = $29.22
|
Most Recent Note - 6/21/2017 2:01:57 PM
G - Posting a 4th consecutive small gain challenging its 50 DMA line which may act as resistance. A rebound above the 50 DMA line ($38.79) is needed for its outlook to improve. Prior low ($35.55 on 4/26/17) defines the next important chart support level where a violation would raise more serious concerns.
>>> FEATURED STOCK ARTICLE : Sputtering Below 50-Day Moving Average Line - 6/14/2017 |
View all notes |
Set NEW NOTE alert |
Company Profile |
SEC
News |
Chart |
Request a new note
C
A
S
I |
HLI
-
NYSE
Houlihan Lokey Inc Cl A
Finance-Invest Bnk/Bkrs
|
$34.39
|
-0.53
-1.52% |
$34.96
|
165,986
91.70% of 50 DAV
50 DAV is 181,000
|
$36.65
-6.17%
|
5/10/2017
|
$35.85
|
PP = $35.05
|
|
MB = $36.80
|
Most Recent Note - 6/19/2017 5:26:57 PM
Y - Gapped up today while consolidating above its 50 DMA line ($33.85). Recent low ($32.72 on 5/31/17) defines near-term support where violations would raise concerns and trigger a more worrisome technical sell signal. See the latest FSU analysis for more details and a new annotated graph.
>>> FEATURED STOCK ARTICLE : Gapped Up and Nearly Challenged Prior High - 6/19/2017 |
View all notes |
Set NEW NOTE alert |
Company Profile |
SEC
News |
Chart |
Request a new note
C
A
S
I |
Symbol/Exchange
Company Name
Industry Group |
PRICE |
CHANGE
(%Change) |
Day High |
Volume
(% DAV)
(% 50 day avg vol) |
52 Wk Hi
% From Hi |
Featured
Date |
Price
Featured |
Pivot Featured |
|
Max Buy |