You are not logged in.
This means you
CAN ONLY VIEW reports that were published prior to Sunday, March 30, 2025.
You
MUST UPGRADE YOUR MEMBERSHIP if you want to see any current reports.
AFTER MARKET UPDATE - MONDAY, MAY 15TH, 2017
Previous After Market Report Next After Market Report >>>
|
|
|
|
DOW |
+85.33 |
20,981.94 |
+0.41% |
|
Volume |
1,060,995,750 |
+14% |
|
Volume |
1,662,550,310 |
+4% |
|
NASDAQ |
+28.44 |
6,149.67 |
+0.46% |
|
Advancers |
2,197 |
76% |
|
Advancers |
1,929 |
67% |
|
S&P 500 |
+11.42 |
2,402.32 |
+0.48% |
|
Decliners |
708 |
24% |
|
Decliners |
946 |
33% |
|
Russell 2000 |
+11.15 |
1,393.92 |
+0.81% |
|
52 Wk Highs |
151 |
|
|
52 Wk Highs |
214 |
|
|
S&P 600 |
+5.86 |
844.40 |
+0.70% |
|
52 Wk Lows |
41 |
|
|
52 Wk Lows |
54 |
|
|
 |
Major Indices Rallied With Better Leadership and More Volume
Kenneth J. Gruneisen - Passed the CAN SLIM® Master's Exam
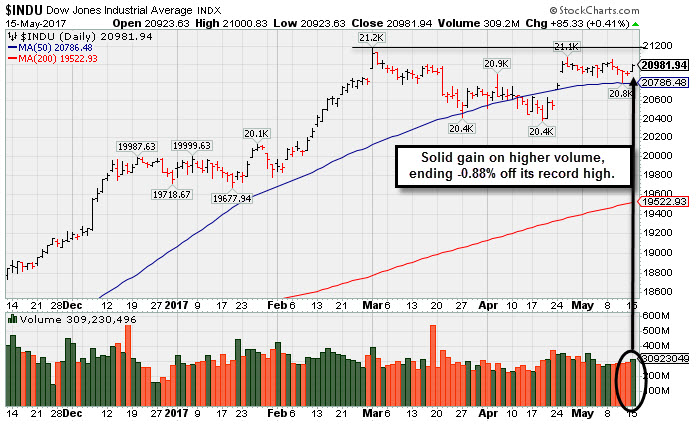
Stocks finished higher on Monday. The Dow was up 85 points to 20981. The S&P 500 added 11 points to 2402 and the Nasdaq Composite gained 28 points to 6149. The volume totals reported were higher than the prior session totals on the NYSE and on the Nasdaq exchange, indicative of an increase in institutional buying demand termed "accumulation". Breadth was positive as advancers led decliners by a 3-1 margin on the NYSE and 2-1 on the Nasdaq exchange. Leadership improved as there were 70 high-ranked companies from the Leaders List that made new 52-week highs and were listed on the BreakOuts Page, versus the total of 37 on the prior session. New 52-week highs totals expanded and solidly outnumbered new 52-week lows on the NYSE and on the Nasdaq exchange. PICTURED: The Dow Jones Industrial Average posted a gain with higher volume, ending -0.88% off its record high hit on 3/01/17.
The major averages' (M criteria) are in a confirmed uptrend, and there remains a healthy level of market leadership (number of high-ranked stocks hitting new highs). New buying efforts should be made only in stocks matching all of the fundamental and technical criteria of the fact-based investment system. The Featured Stocks Page lists noteworthy high-ranked leaders.
The S&P 500 and Nasdaq closed at record highs amid a rally in the commodities complex. NYMEX WTI crude gained 2.2% to $48.89/barrel to lift energy stocks after Russia and Saudi Arabia indicated OPEC may extend production cuts until March 2018. Materials stocks also outperformed after the Chinese government announced plans for increased infrastructure spending. On the data front, manufacturing activity in the Fed’s New York district unexpectedly contracted in May.
Ten of 11 sectors in the S&P 500 Index finished in positive territory with only Telecom shares lagging. Cyber security stocks advanced as the “WannaCry” malware spreads globally. Symantec (SYMC +3.19%) while FireEye (FEYE +7.51%) rallied. In M&A news, Patheon (PTHN +33.08%) gapped up for a new high after agreeing to a $7.2 billion takeover offer from Thermo Fisher Scientific (TMO +0.43%). Johnson and Johnson (JNJ +2.71%) and Cisco Systems (CSCO +2.33%) both rose after each company was the subject of positive analyst commentary.
Treasuries were lower with the benchmark 10-year note down 4/32 to yield 2.34%. Gold added 0.2% on the COMEX to $1230.70/ounce, while the U.S. Dollar Index slipped 0.3% with weakness against the euro and emerging currencies. |
 Kenneth J. Gruneisen started out as a licensed stockbroker in August 1987, a couple of months prior to the historic stock market crash that took the Dow Jones Industrial Average down -22.6% in a single day. He has published daily fact-based fundamental and technical analysis on high-ranked stocks online for two decades. Through FACTBASEDINVESTING.COM, Kenneth provides educational articles, news, market commentary, and other information regarding proven investment systems that work in good times and bad.
Comments contained in the body of this report are technical opinions only and are not necessarily those of Gruneisen Growth Corp. The material herein has been obtained from sources believed to be reliable and accurate, however, its accuracy and completeness cannot be guaranteed. Our firm, employees, and customers may effect transactions, including transactions contrary to any recommendation herein, or have positions in the securities mentioned herein or options with respect thereto. Any recommendation contained in this report may not be suitable for all investors and it is not to be deemed an offer or solicitation on our part with respect to the purchase or sale of any securities. |
|
 |
Financial, Tech and Commodity-Linked Groups Rose
Kenneth J. Gruneisen - Passed the CAN SLIM® Master's Exam
The Retail Index ($RLX -0.11%) edged lower while financial indexes gave a boost to the major averages on Monday as the Broker/Dealer Index ($XBD +1.33%) and the Bank Index ($BKX +0.87%) both ended the session solidly higher. The tech sector had a positive bias as the Networking Index ($NWX +0.90%), Biotechnology Index ($BTK +1.22%), and the Semiconductor Index ($SOX +1.51%) ended unanimously higher. Commodity-linked groups also had a positive bias as the Gold & Silver index ($XAU +0.22%) edged higher and the Integrated Oil Index ($XOI +0.60%) was outpaced by an even stronger Oil Services Index ($OSX +1.92%). Charts courtesy www.stockcharts.com
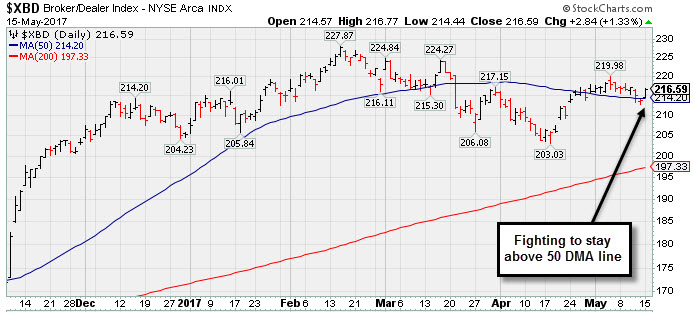 PICTURED: The Broker/Dealer Index ($XBD +1.33%) is fighting to stay above its 50-day moving average (DMA) line.
| Oil Services |
$OSX |
150.28 |
+2.82 |
+1.91% |
-18.23% |
| Integrated Oil |
$XOI |
1,169.74 |
+6.94 |
+0.60% |
-7.75% |
| Semiconductor |
$SOX |
1,061.05 |
+15.81 |
+1.51% |
+17.05% |
| Networking |
$NWX |
448.57 |
+3.98 |
+0.90% |
+0.55% |
| Broker/Dealer |
$XBD |
216.59 |
+2.84 |
+1.33% |
+5.51% |
| Retail |
$RLX |
1,514.34 |
-1.65 |
-0.11% |
+12.76% |
| Gold & Silver |
$XAU |
85.16 |
+0.19 |
+0.22% |
+7.99% |
| Bank |
$BKX |
92.26 |
+0.80 |
+0.87% |
+0.51% |
| Biotech |
$BTK |
3,665.57 |
+44.14 |
+1.22% |
+19.20% |
|
|
|
 |
Wedging Into New High Territory, Extended From Sound Base
Kenneth J. Gruneisen - Passed the CAN SLIM® Master's Exam
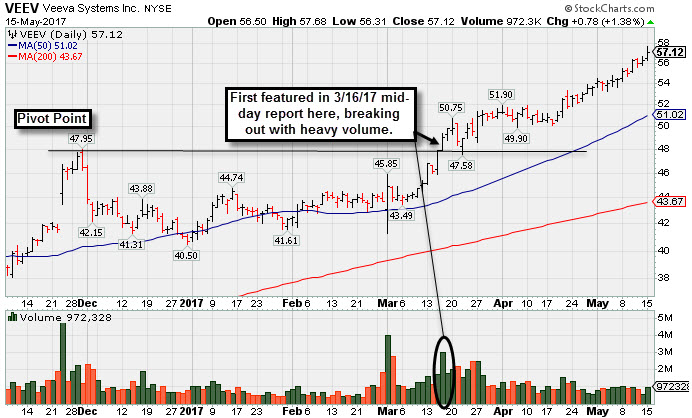
Veeva Systems Inc Cl A (VEEV +$0.78 or +1.38% to $57.12) hit yet another new all-time high with today's gain backed by light volume, getting very extended from any sound base. Disciplined investors avoid chasing extended stocks and might wait for a new base or secondary buy point to possibly develop and be noted in the weeks ahead. Its 50-day moving average (DMA) line ($51) defines support above prior highs in the $47-48 area.
VEEV has been wedging further into new high territory with gains lacking great volume conviction since last shown in this FSU section on 4/18/17 with an annotated graph under the headline, "Hovering Near High, Stubbornly Holding its Ground". It is up +16.57% since first highlighted in yellow with new pivot point cited based on its 11/30/16 high plus 10 cents in the 3/16/17 mid-day report (read here).
The high-ranked Computer Software - Medical firm reported earnings +47% on +31% sales revenues for the Jan '17 quarter, and 3 of the past 4 quarterly comparisons were above the +25% minimum earnings guideline (C criteria). Its annual earnings (A criteria) history has been strong. It has the highest possible 99 Earnings Per Share (EPS) rank and it has a 96 Relative Strength (RS) rating. Both of those ratings must be above 80 for a stock to meet the guidelines for consideration.
The number of top-rated funds owning its shares rose from 340 in Mar '16 to 482 in Mar '17, a reassuring sign concerning the I criteria. Its current Up/Down Volume Ratio of 2.3 is an unbiased indication its shares have been under accumulation over the past 50 days.
|
|
|
Color Codes Explained :
Y - Better candidates highlighted by our
staff of experts.
G - Previously featured
in past reports as yellow but may no longer be buyable under the
guidelines.
***Last / Change / Volume data in this table is the closing quote data***
Symbol/Exchange
Company Name
Industry Group |
PRICE |
CHANGE
(%Change) |
Day High |
Volume
(% DAV)
(% 50 day avg vol) |
52 Wk Hi
% From Hi |
Featured
Date |
Price
Featured |
Pivot Featured |
|
Max Buy |
SBCF
-
NASDAQ
Seacoast Banking Corp Fl
BANKING - Regional - Mid-Atlantic Banks
|
$23.40
|
+0.17
0.73% |
$23.49
|
318,904
98.43% of 50 DAV
50 DAV is 324,000
|
$25.88
-9.58%
|
4/24/2017
|
$25.33
|
PP = $24.38
|
|
MB = $25.60
|
Most Recent Note - 5/11/2017 5:09:41 PM
G - Slumped below its 50 DMA line ($23.80) with higher volume behind today's loss raising concerns, and its color code was changed to green. Recent gains above the pivot point lacked the above average volume needed to trigger a proper new (or add-on) technical buy signal. Recent low ($21.89 on 3/22/17) defines important support where violations would raise more serious concerns and trigger worrisome technical sell signals.
>>> FEATURED STOCK ARTICLE : Pullback Following Recent Gains With Unimpressive Volume - 4/27/2017 |
View all notes |
Set NEW NOTE alert |
Company Profile |
SEC
News |
Chart |
Request a new note
C
A
S
I |
CSFL
-
NASDAQ
Centerstate Banks Inc
Banks-Southeast
|
$25.15
|
+0.56
2.28% |
$25.20
|
400,239
121.65% of 50 DAV
50 DAV is 329,000
|
$26.94
-6.64%
|
3/13/2017
|
$25.54
|
PP = $26.40
|
|
MB = $27.72
|
Most Recent Note - 5/11/2017 5:11:09 PM
G - Slumped below its 50 DMA line ($25.27) with higher (near average ) volume behind its loss raising concerns and its color code is changed to green. Reported earnings +10% on +13% sales revenues for the Mar '17 quarter, below the +25% minimum earnings guideline. Damaging losses below its recent low ($23.64 on 4/17/17) would raise more serious concerns.
>>> FEATURED STOCK ARTICLE : Positive Reversal After Intra-day Low Undercut Prior Lows - 4/17/2017 |
View all notes |
Set NEW NOTE alert |
Company Profile |
SEC
News |
Chart |
Request a new note
C
A
S
I |
HTHT
-
NASDAQ
China Lodging Group Ads
LEISURE - Lodging
|
$78.40
|
+3.42
4.56% |
$78.59
|
446,870
230.35% of 50 DAV
50 DAV is 194,000
|
$81.01
-3.22%
|
9/29/2016
|
$46.12
|
PP = $47.82
|
|
MB = $50.21
|
 Most Recent Note - 5/15/2017 12:28:03 PM
G - Perched near its all-time high, very extended from any sound base. Prior highs in the $64 area and its 50 DMA line define near term support to watch. Reported earnings +74% on +4% sales revenues for first quarter ended March 31, 2017.
>>> FEATURED STOCK ARTICLE : Support Shown Promptly After 50-Day Moving Average Violation - 4/19/2017 |
View all notes |
Set NEW NOTE alert |
Company Profile |
SEC
News |
Chart |
Request a new note
C
A
S
I |
BEAT
-
NASDAQ
BioTelemetry Inc
Medical-Services
|
$28.30
|
+0.15
0.53% |
$28.55
|
561,006
108.09% of 50 DAV
50 DAV is 519,000
|
$34.00
-16.76%
|
2/14/2017
|
$25.10
|
PP = $24.55
|
|
MB = $25.78
|
Most Recent Note - 5/12/2017 2:17:49 PM
G - Slumping below its 50 DMA line ($29) again raising concerns with today's 3rd consecutive loss. The 5/04/17 low $26.50 defines important near-term support to watch. Reported earnings -20% on +15% sales revenues for the Mar '17 quarter versus the year ago period, raising fundamental concerns.
>>> FEATURED STOCK ARTICLE : Extended From Sound Base and Earnings Below +25% Guideline - 5/3/2017 |
View all notes |
Set NEW NOTE alert |
Company Profile |
SEC
News |
Chart |
Request a new note
C
A
S
I |
ULTA
-
NASDAQ
Ulta Beauty Inc
SPECIALTY RETAIL - Specialty Retail, Other
|
$295.41
|
-2.14
-0.72% |
$299.88
|
577,591
88.45% of 50 DAV
50 DAV is 653,000
|
$301.40
-1.99%
|
5/5/2017
|
$293.17
|
PP = $289.37
|
|
MB = $303.84
|
Most Recent Note - 5/12/2017 6:19:07 PM
Y - Volume totals have been cooling while stubbornly holding its ground near all-time highs. Recent gains lacked great volume while rising above the new pivot point cited based on its 3/17/17 high plus 10 cents. Prior highs near the $289 area define important support above its 50 DMA line ($284.51). See the latest FSU analysis for more details and a new annotated graph.
>>> FEATURED STOCK ARTICLE : Holding Ground After Recent Gains Lacking Great Volume - 5/12/2017 |
View all notes |
Set NEW NOTE alert |
Company Profile |
SEC
News |
Chart |
Request a new note
C
A
S
I |
Symbol/Exchange
Company Name
Industry Group |
PRICE |
CHANGE
(%Change) |
Day High |
Volume
(% DAV)
(% 50 day avg vol) |
52 Wk Hi
% From Hi |
Featured
Date |
Price
Featured |
Pivot Featured |
|
Max Buy |
ESNT
-
NYSE
Essent Group Ltd
Finance-MrtgandRel Svc
|
$37.08
|
+0.36
0.98% |
$37.23
|
624,707
92.96% of 50 DAV
50 DAV is 672,000
|
$39.50
-6.13%
|
4/4/2017
|
$36.38
|
PP = $36.81
|
|
MB = $38.65
|
Most Recent Note - 5/11/2017 5:07:54 PM
Y - Color code was changed to yellow after rebounding above its 50 DMA line ($36.38) helped its outlook improve. See the latest FSU analysis for more details and a new annotated graph.
>>> FEATURED STOCK ARTICLE : Rebound Above 50-Day Moving Average Helped Outlook - 5/11/2017 |
View all notes |
Set NEW NOTE alert |
Company Profile |
SEC
News |
Chart |
Request a new note
C
A
S
I |
VEEV
-
NYSE
Veeva Systems Inc Cl A
Computer Sftwr-Medical
|
$57.12
|
+0.78
1.38% |
$57.68
|
979,128
80.19% of 50 DAV
50 DAV is 1,221,000
|
$56.69
0.76%
|
3/16/2017
|
$49.00
|
PP = $48.05
|
|
MB = $50.45
|
Most Recent Note - 5/15/2017 7:47:26 PM
G - Hit another new all-time high with today's gain backed by light volume, getting very extended from any sound base. Its 50 DMA line ($51) defines support above prior highs in the $47-48 area. See the latest FSU analysis for more details and a new annotated graph.
>>> FEATURED STOCK ARTICLE : Wedging Into New High Territory, Extended From Sound Base - 5/15/2017 |
View all notes |
Set NEW NOTE alert |
Company Profile |
SEC
News |
Chart |
Request a new note
C
A
S
I |
ANET
-
NYSE
Arista Networks Inc
TELECOMMUNICATIONS - Communication Equipment
|
$147.42
|
+0.60
0.41% |
$148.13
|
582,059
74.43% of 50 DAV
50 DAV is 782,000
|
$147.55
-0.09%
|
4/17/2017
|
$132.75
|
PP = $135.27
|
|
MB = $142.03
|
Most Recent Note - 5/12/2017 2:24:36 PM
G - Inching to another new all-time high today while adding to a streak of small gains on light volume. Extended from any sound base. Its 50 DMA line ($133) defines near-term support to watch on pullbacks.
>>> FEATURED STOCK ARTICLE : Bullish Technical Action Following Recent Earnings - 5/8/2017 |
View all notes |
Set NEW NOTE alert |
Company Profile |
SEC
News |
Chart |
Request a new note
C
A
S
I |
GRUB
-
NYSE
Grubhub Inc
COMPUTER SOFTWARE and SERVICES - Technical and System Software
|
$44.32
|
-0.59
-1.31% |
$45.16
|
1,864,479
75.73% of 50 DAV
50 DAV is 2,462,000
|
$46.84
-5.37%
|
4/28/2017
|
$44.22
|
PP = $44.68
|
|
MB = $46.91
|
Most Recent Note - 5/12/2017 2:26:04 PM
Y - Hovering near its 52-week high with volume totals cooling while stubbornly holding its ground. A gain backed by at least +40% above average volume and strong close above the pivot point may clinch a technical buy signal.
>>> FEATURED STOCK ARTICLE : Hit New 52-Week High But Ended Near Session Low - 4/28/2017 |
View all notes |
Set NEW NOTE alert |
Company Profile |
SEC
News |
Chart |
Request a new note
C
A
S
I |
IBP
-
NYSE
Installed Building Prod
DIVERSIFIED SERVICES - Business/Management Services
|
$48.35
|
+1.10
2.33% |
$48.45
|
149,706
103.96% of 50 DAV
50 DAV is 144,000
|
$55.45
-12.80%
|
4/17/2017
|
$51.75
|
PP = $53.10
|
|
MB = $55.76
|
Most Recent Note - 5/12/2017 2:28:15 PM
G - Failing to rebound after recently violating its 50-day moving average (DMA) line. Prior highs in the $44 area define the next support level. A rebound above the 50 DMA line ($51.32) is needed for its outlook to improve.
>>> FEATURED STOCK ARTICLE : Due to Report Earnings Prior to Friday's Open - 5/4/2017 |
View all notes |
Set NEW NOTE alert |
Company Profile |
SEC
News |
Chart |
Request a new note
C
A
S
I |
Symbol/Exchange
Company Name
Industry Group |
PRICE |
CHANGE
(%Change) |
Day High |
Volume
(% DAV)
(% 50 day avg vol) |
52 Wk Hi
% From Hi |
Featured
Date |
Price
Featured |
Pivot Featured |
|
Max Buy |
NCOM
-
NASDAQ
National Commerce Corp
BANKING - Regional - Southeast Banks
|
$38.15
|
+0.25
0.66% |
$38.35
|
13,983
43.70% of 50 DAV
50 DAV is 32,000
|
$40.00
-4.63%
|
4/25/2017
|
$38.95
|
PP = $40.09
|
|
MB = $42.09
|
Most Recent Note - 5/12/2017 2:22:05 PM
Y - Pulling back near its 50 DMA line ($37.33) defining near-term support. Volume totals have been cooling while consolidating within close striking distance of its 52-week high. A gain above the pivot point backed by a minimum of +40% above average volume may trigger a technical buy signal.
>>> FEATURED STOCK ARTICLE : Challenging 52-Week High With Volume-Driven Gains - 4/26/2017 |
View all notes |
Set NEW NOTE alert |
Company Profile |
SEC
News |
Chart |
Request a new note
C
A
S
I |
INGN
-
NASDAQ
Inogen Inc
HEALTH SERVICES - Medical Instruments and Supplies
|
$81.87
|
-0.14
-0.17% |
$82.22
|
147,057
84.03% of 50 DAV
50 DAV is 175,000
|
$88.62
-7.61%
|
4/17/2017
|
$76.77
|
PP = $80.04
|
|
MB = $84.04
|
Most Recent Note - 5/15/2017 7:50:41 PM
Y - Consolidating near all-time highs following a volume-driven gain on 5/10/17. Prior highs in the $79 area define support along with its 50 DMA line ($77.94).
>>> FEATURED STOCK ARTICLE : Wedging Higher With Recent Gains Lacking Great Volume - 5/1/2017 |
View all notes |
Set NEW NOTE alert |
Company Profile |
SEC
News |
Chart |
Request a new note
C
A
S
I |
PLAY
-
NASDAQ
Dave & Buster's Ent Inc
Retail-Restaurants
|
$66.25
|
+0.22
0.33% |
$66.61
|
485,551
62.65% of 50 DAV
50 DAV is 775,000
|
$67.15
-1.34%
|
2/23/2017
|
$55.41
|
PP = $58.35
|
|
MB = $61.27
|
Most Recent Note - 5/12/2017 2:30:32 PM
G - Volume totals have been cooling while stubbornly holding its ground near its all-time high. Its 50 DMA line ($61.44) defines near-term support to watch on pullbacks. Latest quarter was below the +25% minimum guideline (C criteria), raising fundamental concerns.
>>> FEATURED STOCK ARTICLE : New Record High With Solid Gain on Near Average Volume - 5/2/2017 |
View all notes |
Set NEW NOTE alert |
Company Profile |
SEC
News |
Chart |
Request a new note
C
A
S
I |
OLLI
-
NASDAQ
Ollie's Bargain Outlet
Retail-DiscountandVariety
|
$38.93
|
-0.53
-1.33% |
$39.78
|
527,340
85.19% of 50 DAV
50 DAV is 619,000
|
$41.30
-5.75%
|
3/27/2017
|
$32.80
|
PP = $33.55
|
|
MB = $35.23
|
Most Recent Note - 5/12/2017 2:29:35 PM
G - Sputtering since a "negative reversal" on 5/08/17 after touching a new all-time high. Very extended from any sound base. Reported earnings +22% on +16% sales revenues for the Jan '17 quarter, below the +25% minimum earnings guideline (C criteria), raising fundamental concerns. Its 50 DMA line ($34.86) and prior highs in the $33 area define near-term support to watch.
>>> FEATURED STOCK ARTICLE : Winning Streak Continues for Discount Retailer - 4/24/2017 |
View all notes |
Set NEW NOTE alert |
Company Profile |
SEC
News |
Chart |
Request a new note
C
A
S
I |
MOMO
-
NASDAQ
Momo Inc Ads Cl A
INTERNET - Content
|
$40.11
|
-0.03
-0.07% |
$41.21
|
5,699,624
101.43% of 50 DAV
50 DAV is 5,619,000
|
$41.00
-2.17%
|
3/7/2017
|
$29.71
|
PP = $27.83
|
|
MB = $29.22
|
Most Recent Note - 5/12/2017 2:20:37 PM
G - Hitting a new all-time high with today's gain on higher volume following a consolidation in a very tight trading range. Its 50 DMA line ($35.50) defines important near-term support to watch.
>>> FEATURED STOCK ARTICLE : Hovering Near Record High, Extended From Prior Base - 5/9/2017 |
View all notes |
Set NEW NOTE alert |
Company Profile |
SEC
News |
Chart |
Request a new note
C
A
S
I |
Symbol/Exchange
Company Name
Industry Group |
PRICE |
CHANGE
(%Change) |
Day High |
Volume
(% DAV)
(% 50 day avg vol) |
52 Wk Hi
% From Hi |
Featured
Date |
Price
Featured |
Pivot Featured |
|
Max Buy |
HLI
-
NYSE
Houlihan Lokey Inc Cl A
Finance-Invest Bnk/Bkrs
|
$34.82
|
+0.34
0.99% |
$34.91
|
114,426
47.28% of 50 DAV
50 DAV is 242,000
|
$36.65
-4.99%
|
5/10/2017
|
$35.85
|
PP = $35.05
|
|
MB = $36.80
|
Most Recent Note - 5/11/2017 5:13:48 PM
Y - Pulled back today with a loss on above average volume slightly undercutting its pivot point, raising some concerns. Highlighted in the 5/10/17 mid-day report in yellow with pivot point cited based on its 3/31/17 high plus 10 cents. There was a "breakaway gap" and considerable gain today backed by +174% above average volume hitting new all-time highs and triggering a technical buy signal. Reported earnings +37% on +40% sales revenues for the Mar '17 quarter, and 3 of the past 4 quarterly comparisons were above the +25% minimum earning guideline (C criteria). Annual earnings growth (A criteria) history is a good match with the fact-based investment system's guidelines. See the latest FSU analysis for more details and an annotated graph.
>>> FEATURED STOCK ARTICLE : Breakaway Gap Followed Strong Earnings News - 5/10/2017 |
View all notes |
Set NEW NOTE alert |
Company Profile |
SEC
News |
Chart |
Request a new note
C
A
S
I |
|
|
|
THESE ARE NOT BUY RECOMMENDATIONS!
Comments contained in the body of this report are technical
opinions only. The material herein has been obtained
from sources believed to be reliable and accurate, however,
its accuracy and completeness cannot be guaranteed.
This site is not an investment advisor, hence it does
not endorse or recommend any securities or other investments.
Any recommendation contained in this report may not
be suitable for all investors and it is not to be deemed
an offer or solicitation on our part with respect to
the purchase or sale of any securities. All trademarks,
service marks and trade names appearing in this report
are the property of their respective owners, and are
likewise used for identification purposes only.
This report is a service available
only to active Paid Premium Members.
You may opt-out of receiving report notifications
at any time. Questions or comments may be submitted
by writing to Premium Membership Services 665 S.E. 10 Street, Suite 201 Deerfield Beach, FL 33441-5634 or by calling 1-800-965-8307
or 954-785-1121.
|
|
|