You are not logged in.
This means you
CAN ONLY VIEW reports that were published prior to Tuesday, April 1, 2025.
You
MUST UPGRADE YOUR MEMBERSHIP if you want to see any current reports.
AFTER MARKET UPDATE - THURSDAY, MAY 25TH, 2017
Previous After Market Report Next After Market Report >>>
|
|
|
|
DOW |
+70.53 |
21,082.95 |
+0.34% |
|
Volume |
946,097,200 |
-0% |
|
Volume |
1,610,160,020 |
+6% |
|
NASDAQ |
+42.24 |
6,205.26 |
+0.69% |
|
Advancers |
1,524 |
52% |
|
Advancers |
1,533 |
54% |
|
S&P 500 |
+10.68 |
2,415.07 |
+0.44% |
|
Decliners |
1,399 |
48% |
|
Decliners |
1,326 |
46% |
|
Russell 2000 |
+0.88 |
1,383.39 |
+0.06% |
|
52 Wk Highs |
237 |
|
|
52 Wk Highs |
221 |
|
|
S&P 600 |
+0.73 |
837.69 |
+0.09% |
|
52 Wk Lows |
42 |
|
|
52 Wk Lows |
64 |
|
|
 |
Major Indices Rallied With Greater Leadership
Kenneth J. Gruneisen - Passed the CAN SLIM® Master's Exam
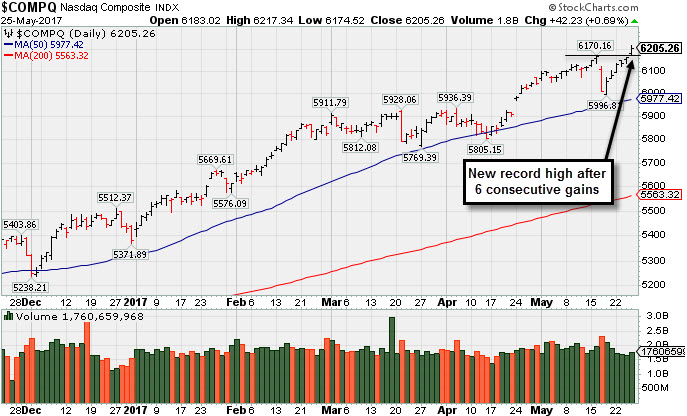
Stocks were firmly higher Thursday. The Dow rose 71 points to 21082. The S&P 500 was up 11 points to close at an all-time high at 2415. The Nasdaq Composite increased 42 points to finish at record level of 6205. The volume totals reported were near the prior session total on the NYSE and higher on the Nasdaq exchange. Advancers led decliners by a narrow margin on the NYSE and on the Nasdaq exchange. There were 91 high-ranked companies from the Leaders List that made new 52-week highs and were listed on the BreakOuts Page, trumping the total of 48 on the prior session. New 52-week highs totals expanded and solidly outnumbered new 52-week lows on the NYSE and on the Nasdaq exchange. PICTURED: The Nasdaq Composite Index hit a new record high while tallying its 6th consecutive gain.
The major averages (M criteria) are in a confirmed uptrend and there remains a healthy level of market leadership (a large number of high-ranked stocks hitting new highs). New buying efforts should only be made in stocks meeting all fundamental and technical criteria of the fact-based investment system. The Featured Stocks Page lists noteworthy high-ranked leaders.
U.S. equities extended their advance as positive earnings by retailers countered a drop in oil prices. On the economic front, initial jobless claims edged up 2,000 to 234,000 in the most recent week, less than a projected increase to 238,000. A separate report showed wholesale inventories unexpectedly declined 0.3% sequentially in April.
Nine of 11 sectors in the S&P 500 increased led by Consumer Discretionary. Best Buy (BBY +21.48%) surged as the electronic store’s profits handily beat analyst forecasts. PVH Corp (PVH +4.84%) rose as the apparel maker’s quarterly results beat consensus estimates. Technology also provided a tailwind to the market. Facebook (FB +1.28%) and Alphabet (GOOGL +1.46%) rose. Energy was the worst performing group amid disappointment that OPEC decided to extend its output curbs into next year without announcing additional production cuts. Transocean (RIG -7.57%) slumped and Chevron (CVX -1.05%) ended lower.
Treasuries were little changed on the session. The 10-year note slipped 1/32 to yield 2.25% and the 30-year bond gained 3/32 to 2.92%. In commodities, NYMEX WTI crude fell 5.3% to $48.62/barrel. COMEX gold was 0.2% higher at $1255.70/ounce. |
 Kenneth J. Gruneisen started out as a licensed stockbroker in August 1987, a couple of months prior to the historic stock market crash that took the Dow Jones Industrial Average down -22.6% in a single day. He has published daily fact-based fundamental and technical analysis on high-ranked stocks online for two decades. Through FACTBASEDINVESTING.COM, Kenneth provides educational articles, news, market commentary, and other information regarding proven investment systems that work in good times and bad.
Comments contained in the body of this report are technical opinions only and are not necessarily those of Gruneisen Growth Corp. The material herein has been obtained from sources believed to be reliable and accurate, however, its accuracy and completeness cannot be guaranteed. Our firm, employees, and customers may effect transactions, including transactions contrary to any recommendation herein, or have positions in the securities mentioned herein or options with respect thereto. Any recommendation contained in this report may not be suitable for all investors and it is not to be deemed an offer or solicitation on our part with respect to the purchase or sale of any securities. |
|
 |
Retail Index Led Group Gainers; Oil Services Index Fell Hard
Kenneth J. Gruneisen - Passed the CAN SLIM® Master's Exam
On Thursday the Retail Index ($RLX +1.60%) posted an influential gain that helped the major indices while the Broker/Dealer Index ($XBD +0.84%) also rose but the Bank Index ($BKX -0.07%) finished flat. The Semiconductor Index ($SOX +0.55%) led the tech sector and the Networking Index ($NWX +0.42%) also ended modestly higher, but the Biotechnology Index ($BTK -0.46%) finished slightly in the red. The Gold & Silver index ($XAU -0.93%) and Integrated Oil Index ($XOI -1.58%) traded to the downside and the Oil Services Index ($OSX -5.37%) was a standout decliner. Charts courtesy www.stockcharts.com
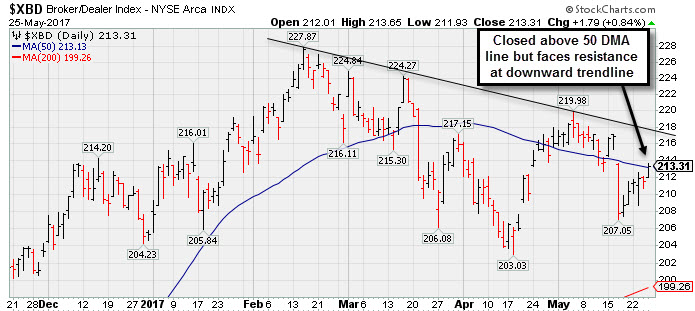 PICTURED: The Broker/Dealer Index ($XBD -0.16%) closed just above its 50-day moving average (DMA) line. It faces near-term resistance at a multi-month downward trendline. Improvement would help, but subsequent losses below the prior lows would badly hurt the broader market outlook, because the financial groups have proven to be reliable leading indicators.
| Oil Services |
$OSX |
141.70 |
-8.05 |
-5.38% |
-22.90% |
| Integrated Oil |
$XOI |
1,141.72 |
-18.28 |
-1.58% |
-9.96% |
| Semiconductor |
$SOX |
1,080.75 |
+5.90 |
+0.55% |
+19.23% |
| Networking |
$NWX |
441.86 |
+1.83 |
+0.42% |
-0.95% |
| Broker/Dealer |
$XBD |
213.31 |
+1.79 |
+0.84% |
+3.91% |
| Retail |
$RLX |
1,521.56 |
+23.98 |
+1.60% |
+13.30% |
| Gold & Silver |
$XAU |
84.07 |
-0.79 |
-0.93% |
+6.61% |
| Bank |
$BKX |
91.06 |
-0.06 |
-0.07% |
-0.80% |
| Biotech |
$BTK |
3,608.77 |
-16.80 |
-0.46% |
+17.36% |
|
|
|
 |
Relative Strength Rating Slumped After Lingering Below 50 DMA
Kenneth J. Gruneisen - Passed the CAN SLIM® Master's Exam
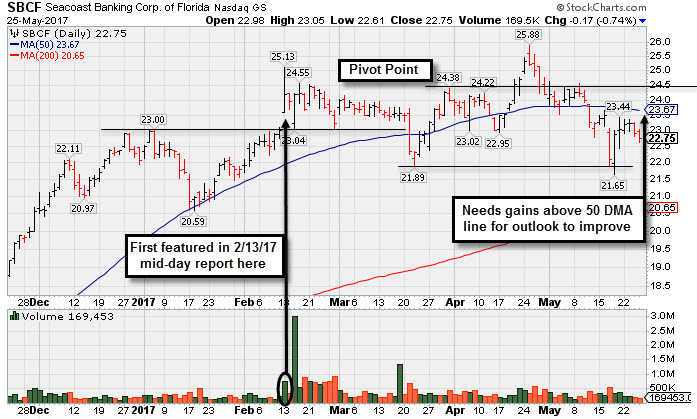
Seacoast Banking Corp Fl (SBCF -$0.17 or -0.74% to $22.75) has been sputtering below its 50-day moving average (DMA) line ($23.67). A rebound above that important short-term average is needed for its outlook to improve. Its Relative Strength rating has slumped to 79, below the 80+ minimum guideline for buy candidates. It will be dropped from the Featured Stocks list tonight. Subsequent losses below the prior low ($21.65 on 5/18/17) would raise more serious concerns.
Volume was unimpressive on 4/24/17 when it rose above the new pivot point cited based on its 3/31/17 high after a cup with handle base. Gains above the pivot point should be backed by a minimum of +40% above average volume to trigger a proper new (or add-on) technical buy signal. Members were reminded - "Without fresh proof of institutional buying demand it is considered unlikely to see a meaningful price advance."
The Stuart, Florida based banking firm reported Mar '17 earnings +30% on +24% sales revenues versus the year-ago period, marking its 4th consecutive strong earnings increase above the +25% minimum guideline (C criteria) coupled with strong sales revenues increases. Annual earnings (A criteria) have improved since a downturn and loss in FY '12.
SBCF was last shown in this FSU section on 4/27/17 with an annotated graph under the headline, "Pullback Following Recent Gains With Unimpressive Volume". It was first highlighted in yellow with pivot point cited based on its 1/04/17 high plus 10 cents in the 2/13/17 mid-day report (read here). Its solid gain backed by +234% above average volume clinched a technical buy signal, however it then completed a new Public Offering and stalled thereafter.
It has earned a Timeliness Rating of B and a Sponsorship Rating of C. The number of top-rated funds owning its shares rose from 161 in Mar '16 to 231 in Mar '17, a reassuring sign concerning the I criteria. However, its current Up/Down Volume Ratio of 0.9 is an unbiased indication its shares have been under slight distributional pressure for the past 50 days. Its small supply of only 40.7 million shares outstanding (S criteria) can contribute to greater price volatility in the event of institutional buying or selling.
|
|
|
Color Codes Explained :
Y - Better candidates highlighted by our
staff of experts.
G - Previously featured
in past reports as yellow but may no longer be buyable under the
guidelines.
***Last / Change / Volume data in this table is the closing quote data***
Symbol/Exchange
Company Name
Industry Group |
PRICE |
CHANGE
(%Change) |
Day High |
Volume
(% DAV)
(% 50 day avg vol) |
52 Wk Hi
% From Hi |
Featured
Date |
Price
Featured |
Pivot Featured |
|
Max Buy |
SBCF
-
NASDAQ
Seacoast Banking Corp Fl
BANKING - Regional - Mid-Atlantic Banks
|
$22.75
|
-0.17
-0.74% |
$23.05
|
169,453
51.04% of 50 DAV
50 DAV is 332,000
|
$25.88
-12.09%
|
4/24/2017
|
$25.33
|
PP = $24.38
|
|
MB = $25.60
|
 Most Recent Note - 5/25/2017 6:37:56 PM
It will be dropped from the Featured Stocks list tonight. A rebound above the 50 DMA line is needed for its outlook to improve. Subsequent losses below the prior low ($21.65 on 5/18/17) would raise more serious concerns. See the latest FSU analysis for more details and a new annotated graph.
>>> FEATURED STOCK ARTICLE : Relative Strength Rating Slumped After Lingering Below 50 DMA - 5/25/2017 |
View all notes |
Set NEW NOTE alert |
Company Profile |
SEC
News |
Chart |
Request a new note
C
A
S
I |
EW
-
NYSE
Edwards Lifesciences Cp
HEALTH SERVICES - Medical Appliances and Equipment
|
$114.17
|
-0.02
-0.02% |
$114.82
|
821,224
49.89% of 50 DAV
50 DAV is 1,646,000
|
$121.75
-6.23%
|
5/16/2017
|
$114.12
|
PP = $113.04
|
|
MB = $118.69
|
Most Recent Note - 5/22/2017 5:48:40 PM
Y - Posted a 3rd consecutive small gain with below average volume. Highlighted in yellow in the 5/16/17 mid-day report with a pivot point based on its 4/26/17 high after a cup-with-handle base.
>>> FEATURED STOCK ARTICLE : Some Overhead Supply Remains For High Ranked Medical Firm - 5/17/2017 |
View all notes |
Set NEW NOTE alert |
Company Profile |
SEC
News |
Chart |
Request a new note
C
A
S
I |
STMP
-
NASDAQ
Stamps.com Inc
INTERNET - Internet Software and Services
|
$137.85
|
+5.55
4.20% |
$140.84
|
1,190,947
167.98% of 50 DAV
50 DAV is 709,000
|
$136.00
1.36%
|
5/24/2017
|
$133.10
|
PP = $136.10
|
|
MB = $142.91
|
Most Recent Note - 5/25/2017 6:05:03 PM
Y - Triggered a technical buy signal with today's gain above the pivot point backed by +68% above average volume. A new pivot point was cited based on its 2/22/17 high plus 10 cents in the 5/24/17 mid-day report. See the latest FSU analysis for more details and an annotated graph.
>>> FEATURED STOCK ARTICLE : Rallying From Bottom of 13-Week Cup Shaped Base - 5/24/2017 |
View all notes |
Set NEW NOTE alert |
Company Profile |
SEC
News |
Chart |
Request a new note
C
A
S
I |
HTHT
-
NASDAQ
China Lodging Group Ads
LEISURE - Lodging
|
$77.27
|
+0.92
1.20% |
$78.31
|
90,728
42.20% of 50 DAV
50 DAV is 215,000
|
$81.01
-4.62%
|
9/29/2016
|
$46.12
|
PP = $47.82
|
|
MB = $50.21
|
Most Recent Note - 5/24/2017 6:30:59 PM
G - It remains very extended from any sound base. Its 50 DMA line ($67) defines near-term support to watch above prior highs in the $64 area.
>>> FEATURED STOCK ARTICLE : Traded Up 108% in 10 Months Since First Highlighted - 5/18/2017 |
View all notes |
Set NEW NOTE alert |
Company Profile |
SEC
News |
Chart |
Request a new note
C
A
S
I |
DY
-
NYSE
Dycom Inds Inc
MATERIALS and CONSTRUCTION - Heavy Construction
|
$84.05
|
-4.92
-5.53% |
$90.32
|
2,990,476
443.49% of 50 DAV
50 DAV is 674,300
|
$110.64
-24.03%
|
5/23/2017
|
$109.25
|
PP = $110.07
|
|
MB = $115.57
|
Most Recent Note - 5/25/2017 5:57:55 PM
It will be dropped from the Featured Stocks list tonight. Gapped down on the prior session violating its 50 DMA line, triggering a technical sell signal. Slumped further today and violated its 200 DMA line. bearish action came after it reported earnings +20% on +18% sales revenues for the Apr '17 quarter, below the +25% minimum guideline (C criteria).
>>> FEATURED STOCK ARTICLE : In Tight Range Near All-Time High With Earnings News Due - 5/23/2017 |
View all notes |
Set NEW NOTE alert |
Company Profile |
SEC
News |
Chart |
Request a new note
C
A
S
I |
Symbol/Exchange
Company Name
Industry Group |
PRICE |
CHANGE
(%Change) |
Day High |
Volume
(% DAV)
(% 50 day avg vol) |
52 Wk Hi
% From Hi |
Featured
Date |
Price
Featured |
Pivot Featured |
|
Max Buy |
BEAT
-
NASDAQ
BioTelemetry Inc
Medical-Services
|
$28.30
|
+0.35
1.25% |
$28.85
|
433,048
79.90% of 50 DAV
50 DAV is 542,000
|
$34.00
-16.76%
|
2/14/2017
|
$25.10
|
PP = $24.55
|
|
MB = $25.78
|
Most Recent Note - 5/24/2017 10:49:26 AM
G - Met resistance at its 50 DMA line recently and today it is slumping toward prior lows in the $26.50 - $27.00 area defining the next level of support. Gains above the 50 DMA line are needed for its outlook to improve. Reported earnings -20% on +15% sales revenues for the Mar '17 quarter versus the year ago period, raising fundamental concerns.
>>> FEATURED STOCK ARTICLE : Extended From Sound Base and Earnings Below +25% Guideline - 5/3/2017 |
View all notes |
Set NEW NOTE alert |
Company Profile |
SEC
News |
Chart |
Request a new note
C
A
S
I |
ULTA
-
NYSE
Ulta Beauty Inc
SPECIALTY RETAIL - Specialty Retail, Other
|
$293.04
|
+12.53
4.47% |
$293.84
|
2,105,937
377.88% of 50 DAV
50 DAV is 557,300
|
$301.40
-2.77%
|
5/5/2017
|
$293.17
|
PP = $289.37
|
|
MB = $303.84
|
Most Recent Note - 5/25/2017 12:45:03 PM
Y - Due to report Apr '17 quarterly results after the close today. Volume and volatility often increase near earnings news. Color code is changed to yellow after finding prompt support and rebounding above its 50 DMA line. However, its Relative Strength rank slumped to 66, below the 80+ minimum guideline for buy candidates.
>>> FEATURED STOCK ARTICLE : Holding Ground After Recent Gains Lacking Great Volume - 5/12/2017 |
View all notes |
Set NEW NOTE alert |
Company Profile |
SEC
News |
Chart |
Request a new note
C
A
S
I |
ESNT
-
NYSE
Essent Group Ltd
Finance-MrtgandRel Svc
|
$36.48
|
-0.09
-0.25% |
$36.71
|
392,409
60.19% of 50 DAV
50 DAV is 652,000
|
$39.50
-7.65%
|
4/4/2017
|
$36.38
|
PP = $36.81
|
|
MB = $38.65
|
Most Recent Note - 5/22/2017 5:47:20 PM
G - Color code is changed to green while consolidating below its 50 DMA line ($36.59). Subsequent losses below the prior low ($34.08 on 5/05/17) would raise greater concerns and trigger a worrisome technical sell signal. A rebound above the 50 DMA line is needed fro its outlook to improve.
>>> FEATURED STOCK ARTICLE : Rebound Above 50-Day Moving Average Helped Outlook - 5/11/2017 |
View all notes |
Set NEW NOTE alert |
Company Profile |
SEC
News |
Chart |
Request a new note
C
A
S
I |
MTSI
-
NASDAQ
Macom Tech Solution Hldg
Elec-Semiconductor Mfg
|
$59.89
|
-0.19
-0.32% |
$61.67
|
1,496,720
197.20% of 50 DAV
50 DAV is 759,000
|
$61.45
-2.54%
|
5/16/2017
|
$52.52
|
PP = $53.89
|
|
MB = $56.58
|
Most Recent Note - 5/25/2017 12:23:31 PM
G - Touched a new all-time high today. Stubbornly held its ground following considerable volume-driven gains, and it is extended from any sound base. Prior highs in the $54-55 area define initial support to watch on pullbacks. Fundamentals remain strong through the Mar '17 quarter.
>>> FEATURED STOCK ARTICLE : Big Breakout Gain With More Than 5 Times Average Volume - 5/16/2017 |
View all notes |
Set NEW NOTE alert |
Company Profile |
SEC
News |
Chart |
Request a new note
C
A
S
I |
VEEV
-
NYSE
Veeva Systems Inc Cl A
Computer Sftwr-Medical
|
$61.74
|
+0.67
1.10% |
$62.05
|
2,619,661
195.50% of 50 DAV
50 DAV is 1,340,000
|
$62.64
-1.44%
|
3/16/2017
|
$49.00
|
PP = $48.05
|
|
MB = $50.45
|
Most Recent Note - 5/22/2017 5:50:28 PM
G - Very extended from any sound base and hitting yet another new all-time high with above average volume behind today's 3rd consecutive gain. Its 50 DMA line ($52.54) defines support above prior highs in the $47-48 area.
>>> FEATURED STOCK ARTICLE : Wedging Into New High Territory, Extended From Sound Base - 5/15/2017 |
View all notes |
Set NEW NOTE alert |
Company Profile |
SEC
News |
Chart |
Request a new note
C
A
S
I |
Symbol/Exchange
Company Name
Industry Group |
PRICE |
CHANGE
(%Change) |
Day High |
Volume
(% DAV)
(% 50 day avg vol) |
52 Wk Hi
% From Hi |
Featured
Date |
Price
Featured |
Pivot Featured |
|
Max Buy |
ANET
-
NYSE
Arista Networks Inc
TELECOMMUNICATIONS - Communication Equipment
|
$148.06
|
+3.78
2.62% |
$148.23
|
992,091
128.68% of 50 DAV
50 DAV is 771,000
|
$148.60
-0.36%
|
4/17/2017
|
$132.75
|
PP = $135.27
|
|
MB = $142.03
|
Most Recent Note - 5/25/2017 6:07:56 PM
G - Posted a volume-driven gain today for a new record high close. Very extended from any sound base. Its 50 DMA line ($137.45) and prior lows define near-term support to watch.
>>> FEATURED STOCK ARTICLE : Bullish Technical Action Following Recent Earnings - 5/8/2017 |
View all notes |
Set NEW NOTE alert |
Company Profile |
SEC
News |
Chart |
Request a new note
C
A
S
I |
GRUB
-
NYSE
Grubhub Inc
COMPUTER SOFTWARE and SERVICES - Technical and System Software
|
$42.35
|
-0.48
-1.12% |
$43.20
|
1,850,233
78.10% of 50 DAV
50 DAV is 2,369,000
|
$46.84
-9.58%
|
4/28/2017
|
$44.22
|
PP = $44.68
|
|
MB = $46.91
|
Most Recent Note - 5/22/2017 5:41:55 PM
Y - Recently stalled after hitting a new high and encountered mild distributional pressure. A confirming gain backed by at least +40% above average volume and strong close above the pivot point may clinch a technical buy signal. See the latest FSU analysis for more details and a new annotated graph.
>>> FEATURED STOCK ARTICLE : Stalled After Reaching New Highs and Encountered Mild Pressure - 5/22/2017 |
View all notes |
Set NEW NOTE alert |
Company Profile |
SEC
News |
Chart |
Request a new note
C
A
S
I |
IBP
-
NYSE
Installed Building Prod
DIVERSIFIED SERVICES - Business/Management Services
|
$48.95
|
+0.20
0.41% |
$49.15
|
92,521
62.94% of 50 DAV
50 DAV is 147,000
|
$55.45
-11.72%
|
4/17/2017
|
$51.75
|
PP = $53.10
|
|
MB = $55.76
|
Most Recent Note - 5/24/2017 6:31:54 PM
G - Quietly consolidating near the recent low ($46.65 on 5/09/17). Prior highs in the $44 area define the next support level. A rebound above the 50 DMA line ($51.12) is needed for its outlook to improve.
>>> FEATURED STOCK ARTICLE : Due to Report Earnings Prior to Friday's Open - 5/4/2017 |
View all notes |
Set NEW NOTE alert |
Company Profile |
SEC
News |
Chart |
Request a new note
C
A
S
I |
NCOM
-
NASDAQ
National Commerce Corp
BANKING - Regional - Southeast Banks
|
$37.95
|
+0.15
0.40% |
$38.30
|
18,398
61.33% of 50 DAV
50 DAV is 30,000
|
$40.00
-5.13%
|
4/25/2017
|
$38.95
|
PP = $40.09
|
|
MB = $42.09
|
Most Recent Note - 5/24/2017 10:58:51 AM
Y - Found support while consolidating near its 50 DMA line ($37.47) and its color code is changed to yellow. Prior lows in the $35 area define the next important chart support level to watch. Subsequent gains above the pivot point backed by a minimum of +40% above average volume may trigger a technical buy signal.
>>> FEATURED STOCK ARTICLE : Challenging 52-Week High With Volume-Driven Gains - 4/26/2017 |
View all notes |
Set NEW NOTE alert |
Company Profile |
SEC
News |
Chart |
Request a new note
C
A
S
I |
INGN
-
NASDAQ
Inogen Inc
HEALTH SERVICES - Medical Instruments and Supplies
|
$88.95
|
+2.19
2.52% |
$89.24
|
138,882
82.67% of 50 DAV
50 DAV is 168,000
|
$88.62
0.38%
|
4/17/2017
|
$76.77
|
PP = $80.04
|
|
MB = $84.04
|
Most Recent Note - 5/25/2017 6:10:10 PM
G - Posted a gain with lighter volume today while rallying for a new all-time high. Prior highs in the $79 area define support along with its 50 DMA line ($79.84). Fundamentals remain strong.
>>> FEATURED STOCK ARTICLE : Wedging Higher With Recent Gains Lacking Great Volume - 5/1/2017 |
View all notes |
Set NEW NOTE alert |
Company Profile |
SEC
News |
Chart |
Request a new note
C
A
S
I |
Symbol/Exchange
Company Name
Industry Group |
PRICE |
CHANGE
(%Change) |
Day High |
Volume
(% DAV)
(% 50 day avg vol) |
52 Wk Hi
% From Hi |
Featured
Date |
Price
Featured |
Pivot Featured |
|
Max Buy |
PLAY
-
NASDAQ
Dave & Buster's Ent Inc
Retail-Restaurants
|
$66.55
|
-0.27
-0.40% |
$68.25
|
402,318
53.86% of 50 DAV
50 DAV is 747,000
|
$67.83
-1.89%
|
2/23/2017
|
$55.41
|
PP = $58.35
|
|
MB = $61.27
|
Most Recent Note - 5/24/2017 11:03:18 AM
G - Hovering near its all-time high, stubbornly holding its ground. Its 50 DMA line ($62.79) defines near-term support to watch on pullbacks. Jan '17 quarterly earnings were below the +25% minimum guideline (C criteria), raising fundamental concerns.
>>> FEATURED STOCK ARTICLE : New Record High With Solid Gain on Near Average Volume - 5/2/2017 |
View all notes |
Set NEW NOTE alert |
Company Profile |
SEC
News |
Chart |
Request a new note
C
A
S
I |
OLLI
-
NASDAQ
Ollie's Bargain Outlet
Retail-DiscountandVariety
|
$41.85
|
+0.95
2.32% |
$42.05
|
555,149
85.67% of 50 DAV
50 DAV is 648,000
|
$41.35
1.21%
|
3/27/2017
|
$32.80
|
PP = $33.55
|
|
MB = $35.23
|
Most Recent Note - 5/25/2017 6:11:06 PM
G - Hit a new all-time high today, and it is very extended from any sound base. Recent low ($37.60 on 5/16/17) defines near-term support above its 50 DMA line. Due to report Apr '17 quarterly results on 5/31/17.
>>> FEATURED STOCK ARTICLE : Retailer Rallied +25% in 2 Months Since Featured - 5/19/2017 |
View all notes |
Set NEW NOTE alert |
Company Profile |
SEC
News |
Chart |
Request a new note
C
A
S
I |
MOMO
-
NASDAQ
Momo Inc Ads Cl A
INTERNET - Content
|
$38.41
|
-0.23
-0.60% |
$39.63
|
14,843,271
250.06% of 50 DAV
50 DAV is 5,936,000
|
$45.95
-16.41%
|
3/7/2017
|
$29.71
|
PP = $27.83
|
|
MB = $29.22
|
Most Recent Note - 5/25/2017 6:13:03 PM
G - Undercut its 50 DMA line ($37.35) yet found support and ended the session above that important short-term average. Following a "negative reversal" on 5/22/17 at its all-time high it has endured distributional pressure.
>>> FEATURED STOCK ARTICLE : Hovering Near Record High, Extended From Prior Base - 5/9/2017 |
View all notes |
Set NEW NOTE alert |
Company Profile |
SEC
News |
Chart |
Request a new note
C
A
S
I |
HLI
-
NYSE
Houlihan Lokey Inc Cl A
Finance-Invest Bnk/Bkrs
|
$33.45
|
-0.09
-0.27% |
$34.08
|
226,846
97.78% of 50 DAV
50 DAV is 232,000
|
$36.65
-8.73%
|
5/10/2017
|
$35.85
|
PP = $35.05
|
|
MB = $36.80
|
Most Recent Note - 5/22/2017 5:43:50 PM
Y - Quietly consolidating above its 50 DMA line ($33.58) defining important near-term support. A subsequent violation would raise concerns and trigger a technical sell signal.
>>> FEATURED STOCK ARTICLE : Breakaway Gap Followed Strong Earnings News - 5/10/2017 |
View all notes |
Set NEW NOTE alert |
Company Profile |
SEC
News |
Chart |
Request a new note
C
A
S
I |
|
|
|
THESE ARE NOT BUY RECOMMENDATIONS!
Comments contained in the body of this report are technical
opinions only. The material herein has been obtained
from sources believed to be reliable and accurate, however,
its accuracy and completeness cannot be guaranteed.
This site is not an investment advisor, hence it does
not endorse or recommend any securities or other investments.
Any recommendation contained in this report may not
be suitable for all investors and it is not to be deemed
an offer or solicitation on our part with respect to
the purchase or sale of any securities. All trademarks,
service marks and trade names appearing in this report
are the property of their respective owners, and are
likewise used for identification purposes only.
This report is a service available
only to active Paid Premium Members.
You may opt-out of receiving report notifications
at any time. Questions or comments may be submitted
by writing to Premium Membership Services 665 S.E. 10 Street, Suite 201 Deerfield Beach, FL 33441-5634 or by calling 1-800-965-8307
or 954-785-1121.
|
|
|