You are not logged in.
This means you
CAN ONLY VIEW reports that were published prior to Sunday, March 30, 2025.
You
MUST UPGRADE YOUR MEMBERSHIP if you want to see any current reports.
AFTER MARKET UPDATE - TUESDAY, MAY 16TH, 2017
Previous After Market Report Next After Market Report >>>
|
|
|
|
DOW |
-2.19 |
20,979.75 |
-0.01% |
|
Volume |
945,100,150 |
-11% |
|
Volume |
1,808,965,280 |
+9% |
|
NASDAQ |
+20.20 |
6,169.87 |
+0.33% |
|
Advancers |
1,296 |
45% |
|
Advancers |
1,417 |
50% |
|
S&P 500 |
-1.65 |
2,400.67 |
-0.07% |
|
Decliners |
1,599 |
55% |
|
Decliners |
1,425 |
50% |
|
Russell 2000 |
+0.76 |
1,394.68 |
+0.05% |
|
52 Wk Highs |
180 |
|
|
52 Wk Highs |
222 |
|
|
S&P 600 |
-0.52 |
843.88 |
-0.06% |
|
52 Wk Lows |
60 |
|
|
52 Wk Lows |
69 |
|
|
 |
Major Indices Led by Tech-Heavy Nasdaq Composite Index
Kenneth J. Gruneisen - Passed the CAN SLIM® Master's Exam
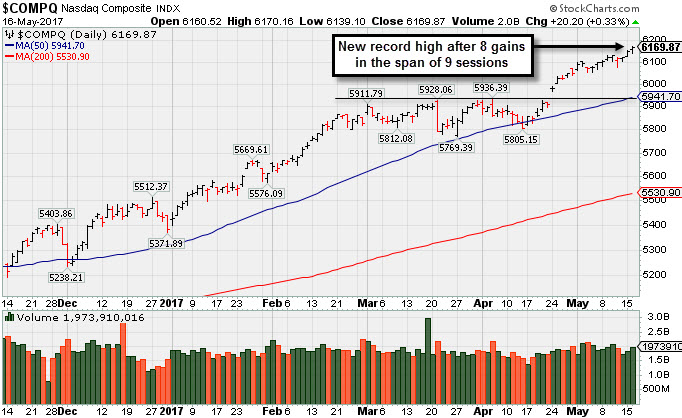
The major Dow Jones Industrial Average and S&P 500 Index ended slightly in the red on Tuesday, meanwhile the tech-heavy Nasdaq Composite Index led. The volume totals reported were mixed, lighter than the prior session total on the NYSE and higher on the Nasdaq exchange. Breadth was fairly even on the Nasdaq exchange but decliners led advancers by an 8-7 margin on the NYSE. Leadership improved as there were 76 high-ranked companies from the Leaders List that made new 52-week highs and were listed on the BreakOuts Page, versus the total of 70 on the prior session. New 52-week highs totals expanded and solidly outnumbered new 52-week lows on the NYSE and on the Nasdaq exchange. PICTURED: The Nasdaq Composite Index posted an 8th gain in the span of 9 sessions, hitting new record highs. The Nasdaq Composite has been setting the pace in 2017 with a +14.6% YTD gain. Meanwhile, the S&P 500 Index is +7.2%, Dow Jones Industrial Average is up +6.2%, and the Small Cap Russell 2000 up +2.8%.
The major averages' (M criteria) are in a confirmed uptrend, and there remains a healthy level of market leadership (number of high-ranked stocks hitting new highs). New buying efforts should be made only in stocks matching all of the fundamental and technical criteria of the fact-based investment system. The Featured Stocks Page lists noteworthy high-ranked leaders.
The Technology stocks including Microsoft (MSFT +1.43%), Amazon (AMZN +0.85%), and NVIDIA (NVDA +1.86%) boosted the Nasdaq to another record high on Tuesday. Meanwhile, Citigroup (C +1.74%) helped lead the financial sector. Health care sector components weighed negatively as Pfizer (PFE), UnitedHealth (UNH), and Bristol-Myers (BMY) ended with losses between 1.3% and 2.0%.
Retailers weighed on the consumer discretionary space following the latest batch of earnings reports. TJX (TJX -4.08%) and Dick's Sporting Goods (DKS -13.73%) both fell in reaction to their quarterly results. The retail industry will be swayed by earnings news from Target (TGT -1.48%) on Wednsesday and Wal-Mart (WMT -1.55%) on Thursday. In the bond market, U.S. Treasuries settled with modest gains across the board, leaving the benchmark 10-yr yield two basis points lower at 2.32%. The U.S. Dollar Index (98.04, -0.77) slipped to its lowest level since the U.S. presidential election on November 8. The greenback lost 1.0% against the euro (1.1088) after eurozone GDP increased an in-line 0.5% quarter-over-quarter.
Housing starts decreased to a seasonally adjusted annualized rate of 1.172 million units in April, down from a revised 1.203 million units in March (from 1.215 million). |
 Kenneth J. Gruneisen started out as a licensed stockbroker in August 1987, a couple of months prior to the historic stock market crash that took the Dow Jones Industrial Average down -22.6% in a single day. He has published daily fact-based fundamental and technical analysis on high-ranked stocks online for two decades. Through FACTBASEDINVESTING.COM, Kenneth provides educational articles, news, market commentary, and other information regarding proven investment systems that work in good times and bad.
Comments contained in the body of this report are technical opinions only and are not necessarily those of Gruneisen Growth Corp. The material herein has been obtained from sources believed to be reliable and accurate, however, its accuracy and completeness cannot be guaranteed. Our firm, employees, and customers may effect transactions, including transactions contrary to any recommendation herein, or have positions in the securities mentioned herein or options with respect thereto. Any recommendation contained in this report may not be suitable for all investors and it is not to be deemed an offer or solicitation on our part with respect to the purchase or sale of any securities. |
|
 |
Financials, Techs, and Gold & Silver Index Rose
Kenneth J. Gruneisen - Passed the CAN SLIM® Master's Exam
The financial indexes gave a small boost to the major averages on Tuesday as the Broker/Dealer Index ($XBD +0.15%) and the Bank Index ($BKX +0.47%) both ended the session slightly higher. The Retail Index ($RLX -0.02%) finished flat. The tech sector had a positive bias as the Semiconductor Index ($SOX +1.49%) set the pace, followed by the Biotechnology Index ($BTK +0.67%) and the Networking Index ($NWX +0.24%). Commodity-linked groups were mixed as the Gold & Silver index ($XAU +0.73%) was higher, but the Integrated Oil Index ($XOI -0.44%) and the Oil Services Index ($OSX -0.22%) both edged lower. Charts courtesy www.stockcharts.com
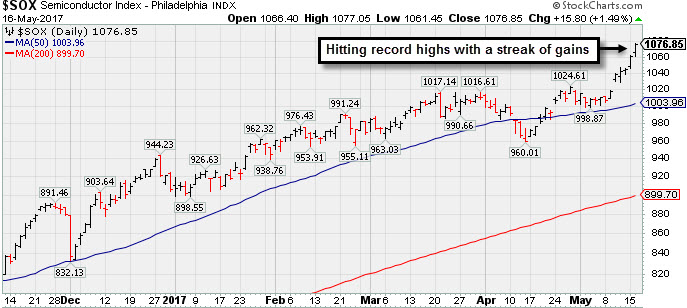 PICTURED: The Semiconductor Index ($SOX +1.49%) is hitting record highs with a streak of gains as chipmakers have shown broad strength. The SOX index is up 7.1% so far in May. Recent leadership in the group bodes especially well for Semiconductor stocks.
| Oil Services |
$OSX |
149.96 |
-0.32 |
-0.21% |
-18.41% |
| Integrated Oil |
$XOI |
1,164.59 |
-5.14 |
-0.44% |
-8.15% |
| Semiconductor |
$SOX |
1,076.85 |
+15.80 |
+1.49% |
+18.80% |
| Networking |
$NWX |
449.64 |
+1.07 |
+0.24% |
+0.79% |
| Broker/Dealer |
$XBD |
216.91 |
+0.32 |
+0.15% |
+5.66% |
| Retail |
$RLX |
1,514.08 |
-0.26 |
-0.02% |
+12.74% |
| Gold & Silver |
$XAU |
85.78 |
+0.62 |
+0.73% |
+8.78% |
| Bank |
$BKX |
92.69 |
+0.43 |
+0.47% |
+0.98% |
| Biotech |
$BTK |
3,690.00 |
+24.42 |
+0.67% |
+20.00% |
|
|
|
 |
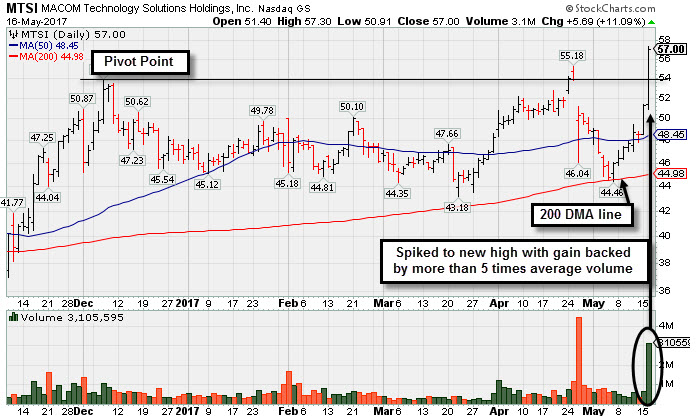
Big Breakout Gain With More Than 5 Times Average Volume
Kenneth J. Gruneisen - Passed the CAN SLIM® Master's Exam
Macom Tech Solution Hldg (MTSI +$5.69 or +11.09% to $57.00) finished strong after highlighted in yellow with new pivot point cited based on its 12/07/16 high plus 10 cents in the earlier mid-day report (read here). It rallied above prior highs with a considerable gain while volume was more than 5 times average, triggering a technical buy signal. No resistance remains due to overhead supply. However, disciplined investors avoid chasing stocks more than +5% above their prior high or pivot point, and it quickly rallied and closed the session above its "max buy" level.
The high-ranked Electronics - Semiconductor manufacturing firm was last shown in this FSU section on 4/25/17 with an annotated graph under the headline, "Strong Earnings Report While Perched at All-Time High." Due to weak action it was noted and dropped from the Featured Stocks list on 5/03/17. It showed resilience since then, and after finding support at its 200-day moving average (DMA) line, rebounding above the 50 DMA line ($48.45) helped its outlook to improve.
Most recently, it reported Mar '17 quarterly earnings +38% on +39% sales revenues, continuing its streak of earnings increases above the +25% minimum guideline (C criteria). Earnings rose +47% on +31% sales revenues for the Dec '16 quarter, . Recent years showed strong annual earnings (A criteria) increases after a slight downturn in FY '13 and '14.
It completed a new Public Offering on 2/05/15. The number of top-rated funds owning its shares rose from 351 in Jun '16 to 386 in Mar '17. The current Up/Down Volume Ratio is 1.1, a nearly neutral reading concerning whether its shares have been under institutional accumulation over the past 50 days (I criteria). Its Timeliness Rating is B and Sponsorship Rating is C. Its small supply of only 26.8 million shares in the public float (S criteria) can contribute to greater price volatility in the event of institutional buying or selling.
|
|
|
Color Codes Explained :
Y - Better candidates highlighted by our
staff of experts.
G - Previously featured
in past reports as yellow but may no longer be buyable under the
guidelines.
***Last / Change / Volume data in this table is the closing quote data***
Symbol/Exchange
Company Name
Industry Group |
PRICE |
CHANGE
(%Change) |
Day High |
Volume
(% DAV)
(% 50 day avg vol) |
52 Wk Hi
% From Hi |
Featured
Date |
Price
Featured |
Pivot Featured |
|
Max Buy |
SBCF
-
NASDAQ
Seacoast Banking Corp Fl
BANKING - Regional - Mid-Atlantic Banks
|
$23.50
|
+0.10
0.43% |
$23.67
|
258,291
78.99% of 50 DAV
50 DAV is 327,000
|
$25.88
-9.20%
|
4/24/2017
|
$25.33
|
PP = $24.38
|
|
MB = $25.60
|
Most Recent Note - 5/11/2017 5:09:41 PM
G - Slumped below its 50 DMA line ($23.80) with higher volume behind today's loss raising concerns, and its color code was changed to green. Recent gains above the pivot point lacked the above average volume needed to trigger a proper new (or add-on) technical buy signal. Recent low ($21.89 on 3/22/17) defines important support where violations would raise more serious concerns and trigger worrisome technical sell signals.
>>> FEATURED STOCK ARTICLE : Pullback Following Recent Gains With Unimpressive Volume - 4/27/2017 |
View all notes |
Set NEW NOTE alert |
Company Profile |
SEC
News |
Chart |
Request a new note
C
A
S
I |
CSFL
-
NASDAQ
Centerstate Banks Inc
Banks-Southeast
|
$25.18
|
+0.03
0.12% |
$25.31
|
226,234
68.56% of 50 DAV
50 DAV is 330,000
|
$26.94
-6.52%
|
3/13/2017
|
$25.54
|
PP = $26.40
|
|
MB = $27.72
|
Most Recent Note - 5/11/2017 5:11:09 PM
G - Slumped below its 50 DMA line ($25.27) with higher (near average ) volume behind its loss raising concerns and its color code is changed to green. Reported earnings +10% on +13% sales revenues for the Mar '17 quarter, below the +25% minimum earnings guideline. Damaging losses below its recent low ($23.64 on 4/17/17) would raise more serious concerns.
>>> FEATURED STOCK ARTICLE : Positive Reversal After Intra-day Low Undercut Prior Lows - 4/17/2017 |
View all notes |
Set NEW NOTE alert |
Company Profile |
SEC
News |
Chart |
Request a new note
C
A
S
I |
EW
-
NYSE
Edwards Lifesciences Cp
HEALTH SERVICES - Medical Appliances and Equipment
|
$113.65
|
+0.22
0.19% |
$115.94
|
3,180,273
173.41% of 50 DAV
50 DAV is 1,834,000
|
$121.75
-6.65%
|
5/16/2017
|
$114.12
|
PP = $113.04
|
|
MB = $118.69
|
 Most Recent Note - 5/16/2017 1:26:06 PM
Y - Color code is changed to yellow with pivot point cited based on its 4/26/17 high after a cup-with-handle base. A gain backed by at least +40% above average volume may clinch a technical buy signal. Reported earnings +32% on +27% sales revenues for the Mar '17 quarter. Three of the past 4 quarterly comparisons had earnings above the +25% minimum guideline (C criteria) and its annual earnings growth (A criteria) is a good match with the fact-based investment system's fundamental guidelines.
>>> FEATURED STOCK ARTICLE : Perched Near Pivot Point After Eight Consecutive Gains - 7/7/2011 |
View all notes |
Set NEW NOTE alert |
Company Profile |
SEC
News |
Chart |
Request a new note
C
A
S
I |
HTHT
-
NASDAQ
China Lodging Group Ads
LEISURE - Lodging
|
$76.75
|
-1.65
-2.10% |
$78.00
|
306,127
152.30% of 50 DAV
50 DAV is 201,000
|
$81.01
-5.26%
|
9/29/2016
|
$46.12
|
PP = $47.82
|
|
MB = $50.21
|
Most Recent Note - 5/16/2017 1:27:27 PM
G - Still perched near its all-time high, very extended from any sound base. Prior highs in the $64 area and its 50 DMA line define near term support to watch. Reported earnings +74% on +4% sales revenues for first quarter ended March 31, 2017.
>>> FEATURED STOCK ARTICLE : Support Shown Promptly After 50-Day Moving Average Violation - 4/19/2017 |
View all notes |
Set NEW NOTE alert |
Company Profile |
SEC
News |
Chart |
Request a new note
C
A
S
I |
BEAT
-
NASDAQ
BioTelemetry Inc
Medical-Services
|
$28.85
|
+0.55
1.94% |
$28.95
|
439,155
83.81% of 50 DAV
50 DAV is 524,000
|
$34.00
-15.15%
|
2/14/2017
|
$25.10
|
PP = $24.55
|
|
MB = $25.78
|
Most Recent Note - 5/12/2017 2:17:49 PM
G - Slumping below its 50 DMA line ($29) again raising concerns with today's 3rd consecutive loss. The 5/04/17 low $26.50 defines important near-term support to watch. Reported earnings -20% on +15% sales revenues for the Mar '17 quarter versus the year ago period, raising fundamental concerns.
>>> FEATURED STOCK ARTICLE : Extended From Sound Base and Earnings Below +25% Guideline - 5/3/2017 |
View all notes |
Set NEW NOTE alert |
Company Profile |
SEC
News |
Chart |
Request a new note
C
A
S
I |
Symbol/Exchange
Company Name
Industry Group |
PRICE |
CHANGE
(%Change) |
Day High |
Volume
(% DAV)
(% 50 day avg vol) |
52 Wk Hi
% From Hi |
Featured
Date |
Price
Featured |
Pivot Featured |
|
Max Buy |
ULTA
-
NASDAQ
Ulta Beauty Inc
SPECIALTY RETAIL - Specialty Retail, Other
|
$293.33
|
-2.08
-0.70% |
$295.99
|
691,417
105.40% of 50 DAV
50 DAV is 656,000
|
$301.40
-2.68%
|
5/5/2017
|
$293.17
|
PP = $289.37
|
|
MB = $303.84
|
Most Recent Note - 5/12/2017 6:19:07 PM
Y - Volume totals have been cooling while stubbornly holding its ground near all-time highs. Recent gains lacked great volume while rising above the new pivot point cited based on its 3/17/17 high plus 10 cents. Prior highs near the $289 area define important support above its 50 DMA line ($284.51). See the latest FSU analysis for more details and a new annotated graph.
>>> FEATURED STOCK ARTICLE : Holding Ground After Recent Gains Lacking Great Volume - 5/12/2017 |
View all notes |
Set NEW NOTE alert |
Company Profile |
SEC
News |
Chart |
Request a new note
C
A
S
I |
ESNT
-
NYSE
Essent Group Ltd
Finance-MrtgandRel Svc
|
$37.21
|
+0.13
0.35% |
$37.50
|
412,035
61.41% of 50 DAV
50 DAV is 671,000
|
$39.50
-5.80%
|
4/4/2017
|
$36.38
|
PP = $36.81
|
|
MB = $38.65
|
Most Recent Note - 5/11/2017 5:07:54 PM
Y - Color code was changed to yellow after rebounding above its 50 DMA line ($36.38) helped its outlook improve. See the latest FSU analysis for more details and a new annotated graph.
>>> FEATURED STOCK ARTICLE : Rebound Above 50-Day Moving Average Helped Outlook - 5/11/2017 |
View all notes |
Set NEW NOTE alert |
Company Profile |
SEC
News |
Chart |
Request a new note
C
A
S
I |
MTSI
-
NASDAQ
Macom Tech Solution Hldg
Elec-Semiconductor Mfg
|
$57.00
|
+5.69
11.09% |
$57.30
|
3,105,595
553.58% of 50 DAV
50 DAV is 561,000
|
$55.18
3.31%
|
5/16/2017
|
$52.52
|
PP = $53.89
|
|
MB = $56.58
|
Most Recent Note - 5/16/2017 5:59:35 PM
Y - Finished near the session high with a big gain backed by more than 5 times average volume after highlighted in yellow with new pivot point cited based on its 12/07/16 high plus 10 cents in the earlier mid-day report. Fundamentals remain strong through the Mar '17 quarter. Found support at its 200 DMA line and rebounded above the 50 DMA line ($48.45) helping its outlook to improve. It showed resilience since dropped from the Featured Stocks list on 5/03/17. See the latest FSU analysis for more details and a new annotated graph.
>>> FEATURED STOCK ARTICLE : Big Breakout Gain With More Than 5 Times Average Volume - 5/16/2017 |
View all notes |
Set NEW NOTE alert |
Company Profile |
SEC
News |
Chart |
Request a new note
C
A
S
I |
VEEV
-
NYSE
Veeva Systems Inc Cl A
Computer Sftwr-Medical
|
$59.09
|
+1.97
3.45% |
$59.78
|
2,379,412
195.19% of 50 DAV
50 DAV is 1,219,000
|
$57.68
2.44%
|
3/16/2017
|
$49.00
|
PP = $48.05
|
|
MB = $50.45
|
Most Recent Note - 5/16/2017 1:48:28 PM
G - Hitting yet another new all-time high with today's gain backed by above average volume, getting very extended from any sound base. Its 50 DMA line ($51.33) defines support above prior highs in the $47-48 area. See the latest FSU analysis for more details and an annotated graph.
>>> FEATURED STOCK ARTICLE : Wedging Into New High Territory, Extended From Sound Base - 5/15/2017 |
View all notes |
Set NEW NOTE alert |
Company Profile |
SEC
News |
Chart |
Request a new note
C
A
S
I |
ANET
-
NYSE
Arista Networks Inc
TELECOMMUNICATIONS - Communication Equipment
|
$147.45
|
+0.03
0.02% |
$148.60
|
1,180,908
150.82% of 50 DAV
50 DAV is 783,000
|
$148.13
-0.46%
|
4/17/2017
|
$132.75
|
PP = $135.27
|
|
MB = $142.03
|
Most Recent Note - 5/12/2017 2:24:36 PM
G - Inching to another new all-time high today while adding to a streak of small gains on light volume. Extended from any sound base. Its 50 DMA line ($133) defines near-term support to watch on pullbacks.
>>> FEATURED STOCK ARTICLE : Bullish Technical Action Following Recent Earnings - 5/8/2017 |
View all notes |
Set NEW NOTE alert |
Company Profile |
SEC
News |
Chart |
Request a new note
C
A
S
I |
Symbol/Exchange
Company Name
Industry Group |
PRICE |
CHANGE
(%Change) |
Day High |
Volume
(% DAV)
(% 50 day avg vol) |
52 Wk Hi
% From Hi |
Featured
Date |
Price
Featured |
Pivot Featured |
|
Max Buy |
GRUB
-
NYSE
Grubhub Inc
COMPUTER SOFTWARE and SERVICES - Technical and System Software
|
$44.65
|
+0.33
0.74% |
$44.86
|
1,733,014
72.39% of 50 DAV
50 DAV is 2,394,000
|
$46.84
-4.67%
|
4/28/2017
|
$44.22
|
PP = $44.68
|
|
MB = $46.91
|
Most Recent Note - 5/12/2017 2:26:04 PM
Y - Hovering near its 52-week high with volume totals cooling while stubbornly holding its ground. A gain backed by at least +40% above average volume and strong close above the pivot point may clinch a technical buy signal.
>>> FEATURED STOCK ARTICLE : Hit New 52-Week High But Ended Near Session Low - 4/28/2017 |
View all notes |
Set NEW NOTE alert |
Company Profile |
SEC
News |
Chart |
Request a new note
C
A
S
I |
IBP
-
NYSE
Installed Building Prod
DIVERSIFIED SERVICES - Business/Management Services
|
$48.45
|
+0.10
0.21% |
$49.00
|
230,386
159.99% of 50 DAV
50 DAV is 144,000
|
$55.45
-12.62%
|
4/17/2017
|
$51.75
|
PP = $53.10
|
|
MB = $55.76
|
Most Recent Note - 5/12/2017 2:28:15 PM
G - Failing to rebound after recently violating its 50-day moving average (DMA) line. Prior highs in the $44 area define the next support level. A rebound above the 50 DMA line ($51.32) is needed for its outlook to improve.
>>> FEATURED STOCK ARTICLE : Due to Report Earnings Prior to Friday's Open - 5/4/2017 |
View all notes |
Set NEW NOTE alert |
Company Profile |
SEC
News |
Chart |
Request a new note
C
A
S
I |
NCOM
-
NASDAQ
National Commerce Corp
BANKING - Regional - Southeast Banks
|
$38.50
|
+0.35
0.92% |
$38.55
|
14,750
46.09% of 50 DAV
50 DAV is 32,000
|
$40.00
-3.75%
|
4/25/2017
|
$38.95
|
PP = $40.09
|
|
MB = $42.09
|
Most Recent Note - 5/12/2017 2:22:05 PM
Y - Pulling back near its 50 DMA line ($37.33) defining near-term support. Volume totals have been cooling while consolidating within close striking distance of its 52-week high. A gain above the pivot point backed by a minimum of +40% above average volume may trigger a technical buy signal.
>>> FEATURED STOCK ARTICLE : Challenging 52-Week High With Volume-Driven Gains - 4/26/2017 |
View all notes |
Set NEW NOTE alert |
Company Profile |
SEC
News |
Chart |
Request a new note
C
A
S
I |
INGN
-
NASDAQ
Inogen Inc
HEALTH SERVICES - Medical Instruments and Supplies
|
$82.26
|
+0.39
0.48% |
$82.28
|
233,502
135.76% of 50 DAV
50 DAV is 172,000
|
$88.62
-7.17%
|
4/17/2017
|
$76.77
|
PP = $80.04
|
|
MB = $84.04
|
Most Recent Note - 5/15/2017 7:50:41 PM
Y - Consolidating near all-time highs following a volume-driven gain on 5/10/17. Prior highs in the $79 area define support along with its 50 DMA line ($77.94).
>>> FEATURED STOCK ARTICLE : Wedging Higher With Recent Gains Lacking Great Volume - 5/1/2017 |
View all notes |
Set NEW NOTE alert |
Company Profile |
SEC
News |
Chart |
Request a new note
C
A
S
I |
PLAY
-
NASDAQ
Dave & Buster's Ent Inc
Retail-Restaurants
|
$67.25
|
+1.00
1.51% |
$67.38
|
520,941
67.31% of 50 DAV
50 DAV is 774,000
|
$67.15
0.15%
|
2/23/2017
|
$55.41
|
PP = $58.35
|
|
MB = $61.27
|
Most Recent Note - 5/12/2017 2:30:32 PM
G - Volume totals have been cooling while stubbornly holding its ground near its all-time high. Its 50 DMA line ($61.44) defines near-term support to watch on pullbacks. Latest quarter was below the +25% minimum guideline (C criteria), raising fundamental concerns.
>>> FEATURED STOCK ARTICLE : New Record High With Solid Gain on Near Average Volume - 5/2/2017 |
View all notes |
Set NEW NOTE alert |
Company Profile |
SEC
News |
Chart |
Request a new note
C
A
S
I |
Symbol/Exchange
Company Name
Industry Group |
PRICE |
CHANGE
(%Change) |
Day High |
Volume
(% DAV)
(% 50 day avg vol) |
52 Wk Hi
% From Hi |
Featured
Date |
Price
Featured |
Pivot Featured |
|
Max Buy |
OLLI
-
NASDAQ
Ollie's Bargain Outlet
Retail-DiscountandVariety
|
$38.65
|
-0.28
-0.71% |
$38.95
|
768,386
123.73% of 50 DAV
50 DAV is 621,000
|
$41.30
-6.42%
|
3/27/2017
|
$32.80
|
PP = $33.55
|
|
MB = $35.23
|
Most Recent Note - 5/12/2017 2:29:35 PM
G - Sputtering since a "negative reversal" on 5/08/17 after touching a new all-time high. Very extended from any sound base. Reported earnings +22% on +16% sales revenues for the Jan '17 quarter, below the +25% minimum earnings guideline (C criteria), raising fundamental concerns. Its 50 DMA line ($34.86) and prior highs in the $33 area define near-term support to watch.
>>> FEATURED STOCK ARTICLE : Winning Streak Continues for Discount Retailer - 4/24/2017 |
View all notes |
Set NEW NOTE alert |
Company Profile |
SEC
News |
Chart |
Request a new note
C
A
S
I |
MOMO
-
NASDAQ
Momo Inc Ads Cl A
INTERNET - Content
|
$43.82
|
+3.71
9.25% |
$44.59
|
11,303,021
198.37% of 50 DAV
50 DAV is 5,698,000
|
$41.21
6.33%
|
3/7/2017
|
$29.71
|
PP = $27.83
|
|
MB = $29.22
|
Most Recent Note - 5/16/2017 1:30:36 PM
G - Hitting yet another new all-time high with today's gain on higher volume following a consolidation in a very tight trading range. Its 50 DMA line ($36.11) defines important near-term support to watch.
>>> FEATURED STOCK ARTICLE : Hovering Near Record High, Extended From Prior Base - 5/9/2017 |
View all notes |
Set NEW NOTE alert |
Company Profile |
SEC
News |
Chart |
Request a new note
C
A
S
I |
HLI
-
NYSE
Houlihan Lokey Inc Cl A
Finance-Invest Bnk/Bkrs
|
$35.23
|
+0.41
1.18% |
$35.25
|
141,149
58.57% of 50 DAV
50 DAV is 241,000
|
$36.65
-3.87%
|
5/10/2017
|
$35.85
|
PP = $35.05
|
|
MB = $36.80
|
Most Recent Note - 5/11/2017 5:13:48 PM
Y - Pulled back today with a loss on above average volume slightly undercutting its pivot point, raising some concerns. Highlighted in the 5/10/17 mid-day report in yellow with pivot point cited based on its 3/31/17 high plus 10 cents. There was a "breakaway gap" and considerable gain today backed by +174% above average volume hitting new all-time highs and triggering a technical buy signal. Reported earnings +37% on +40% sales revenues for the Mar '17 quarter, and 3 of the past 4 quarterly comparisons were above the +25% minimum earning guideline (C criteria). Annual earnings growth (A criteria) history is a good match with the fact-based investment system's guidelines. See the latest FSU analysis for more details and an annotated graph.
>>> FEATURED STOCK ARTICLE : Breakaway Gap Followed Strong Earnings News - 5/10/2017 |
View all notes |
Set NEW NOTE alert |
Company Profile |
SEC
News |
Chart |
Request a new note
C
A
S
I |
|
|
|
THESE ARE NOT BUY RECOMMENDATIONS!
Comments contained in the body of this report are technical
opinions only. The material herein has been obtained
from sources believed to be reliable and accurate, however,
its accuracy and completeness cannot be guaranteed.
This site is not an investment advisor, hence it does
not endorse or recommend any securities or other investments.
Any recommendation contained in this report may not
be suitable for all investors and it is not to be deemed
an offer or solicitation on our part with respect to
the purchase or sale of any securities. All trademarks,
service marks and trade names appearing in this report
are the property of their respective owners, and are
likewise used for identification purposes only.
This report is a service available
only to active Paid Premium Members.
You may opt-out of receiving report notifications
at any time. Questions or comments may be submitted
by writing to Premium Membership Services 665 S.E. 10 Street, Suite 201 Deerfield Beach, FL 33441-5634 or by calling 1-800-965-8307
or 954-785-1121.
|
|
|