***Last / Change / Volume data in this table is the closing quote data***
Symbol/Exchange
Company Name
Industry Group |
PRICE |
CHANGE
(%Change) |
Day High |
Volume
(% DAV)
(% 50 day avg vol) |
52 Wk Hi
% From Hi |
Featured
Date |
Price
Featured |
Pivot Featured |
|
Max Buy |
THO
-
NYSE
Thor Industries Inc
AUTOMOTIVE - Recreational Vehicles
|
$107.03
|
+1.93
1.84% |
$107.07
|
569,243
68.42% of 50 DAV
50 DAV is 832,000
|
$115.74
-7.52%
|
6/7/2017
|
$102.95
|
PP = $98.92
|
|
MB = $103.87
|
Most Recent Note - 6/15/2017 5:36:06 PM
G - Color code is changed to green while stubbornly holding its ground just above its "max buy" level. Highlighted in 6/07/17 mid-day report in yellow with pivot point cited based on its 4/27/17 high.
>>> FEATURED STOCK ARTICLE : Some Overhead Supply Remains After Latest Technical Breakout - 6/8/2017 |
View all notes |
Set NEW NOTE alert |
Company Profile |
SEC
News |
Chart |
Request a new note
C
A
S
I |
SBCF
-
NASDAQ
Seacoast Banking Corp Fl
BANKING - Regional - Mid-Atlantic Banks
|
$24.01
|
-0.35
-1.44% |
$24.44
|
214,075
69.28% of 50 DAV
50 DAV is 309,000
|
$25.88
-7.23%
|
6/9/2017
|
$24.13
|
PP = $25.98
|
|
MB = $27.28
|
Most Recent Note - 6/19/2017 5:30:01 PM
Y - Quietly consolidating within striking distance of the new pivot point cited based on its 4/25/17 high. Previously noted - "Subsequent volume-driven gains for new highs may trigger a new technical buy signal. Rebound above the 50 DMA line helped its outlook improve. Fundamentals remain strong."
>>> FEATURED STOCK ARTICLE : Relative Strength Rating Slumped After Lingering Below 50 DMA - 5/25/2017 |
View all notes |
Set NEW NOTE alert |
Company Profile |
SEC
News |
Chart |
Request a new note
C
A
S
I |
BLMT
-
NASDAQ
B S B Bancorp Inc
BANKING - Regional - Midwest Banks
|
$29.75
|
-0.40
-1.33% |
$30.15
|
10,610
62.41% of 50 DAV
50 DAV is 17,000
|
$30.75
-3.25%
|
6/16/2017
|
$29.85
|
PP = $29.80
|
|
MB = $31.29
|
Most Recent Note - 6/16/2017 5:26:49 PM
Y - Posted a gain with heavy volume today after highlighted in yellow with pivot point cited based on its 4/26/17 high. Perched near its all-time high following volume-driven gains from a sound base. Reported earnings +43% on +20% sales revenues for the Mar '17 quarter. Prior quarterly earnings increases also have been above the +25% minimum guideline (C criteria). Annual earnings (A criteria) history has been strong. See the latest FSU analysis for more details and a new annotated graph.
>>> FEATURED STOCK ARTICLE : Perched Near High After Volume-Driven Gains - 6/16/2017 |
View all notes |
Set NEW NOTE alert |
Company Profile |
SEC
News |
Chart |
Request a new note
C
A
S
I |
BERY
-
NYSE
Berry Global Group Inc
CONSUMER NON-DURABLES - Packaging and Containers
|
$57.81
|
-0.27
-0.46% |
$58.81
|
963,848
80.05% of 50 DAV
50 DAV is 1,204,000
|
$58.95
-1.93%
|
5/26/2017
|
$58.31
|
PP = $57.04
|
|
MB = $59.89
|
Most Recent Note - 6/15/2017 5:30:09 PM
Y -Still consolidating in a tight range above its pivot point, quietly holding its ground near its 52-week high. Reported earnings +36% on +12% sales revenues for the Mar '17 quarter, and fundamentals remain strong.
>>> FEATURED STOCK ARTICLE : Rising From Advanced Base With Above Average Volume - 5/26/2017 |
View all notes |
Set NEW NOTE alert |
Company Profile |
SEC
News |
Chart |
Request a new note
C
A
S
I |
EW
-
NYSE
Edwards Lifesciences Cp
HEALTH SERVICES - Medical Appliances and Equipment
|
$118.89
|
+1.02
0.87% |
$119.33
|
976,511
66.20% of 50 DAV
50 DAV is 1,475,000
|
$121.75
-2.35%
|
5/16/2017
|
$114.12
|
PP = $113.04
|
|
MB = $118.69
|
Most Recent Note - 6/19/2017 5:25:23 PM
G - Posted a solid gain today, and its color code is changed to green after rallying above its recent high and above its "max buy" level. Perched within close striking distance of its all-time high
>>> FEATURED STOCK ARTICLE : Some Overhead Supply Remains For High Ranked Medical Firm - 5/17/2017 |
View all notes |
Set NEW NOTE alert |
Company Profile |
SEC
News |
Chart |
Request a new note
C
A
S
I |
Symbol/Exchange
Company Name
Industry Group |
PRICE |
CHANGE
(%Change) |
Day High |
Volume
(% DAV)
(% 50 day avg vol) |
52 Wk Hi
% From Hi |
Featured
Date |
Price
Featured |
Pivot Featured |
|
Max Buy |
NTES
-
NASDAQ
Netease Inc Adr
INTERNET - Internet Information Providers
|
$323.73
|
+7.23
2.28% |
$327.26
|
1,034,533
78.02% of 50 DAV
50 DAV is 1,326,000
|
$323.10
0.19%
|
6/8/2017
|
$310.76
|
PP = $307.62
|
|
MB = $323.00
|
 Most Recent Note - 6/21/2017 6:34:56 PM
G - Wedged up and hit a new high, closing above its "max buy" level with today's gain lacking great volume conviction. Color code is changed to green. Fundamentals remain strong and it reported earnings +52% on +62% sales revenues for the Mar '17 quarter.
>>> FEATURED STOCK ARTICLE : Encountered Distributional Pressure After Hitting New Highs - 6/9/2017 |
View all notes |
Set NEW NOTE alert |
Company Profile |
SEC
News |
Chart |
Request a new note
C
A
S
I |
STMP
-
NASDAQ
Stamps.com Inc
INTERNET - Internet Software and Services
|
$147.80
|
+1.20
0.82% |
$148.25
|
180,035
25.68% of 50 DAV
50 DAV is 701,000
|
$150.85
-2.02%
|
5/24/2017
|
$133.10
|
PP = $136.10
|
|
MB = $142.91
|
Most Recent Note - 6/20/2017 5:23:33 PM
G - Pulled back from its 52-week high with a loss on light volume. It remains above its "max buy" level. Prior high ($136 on 2/22/17) defines near term support to watch.
>>> FEATURED STOCK ARTICLE : Rallying From Bottom of 13-Week Cup Shaped Base - 5/24/2017 |
View all notes |
Set NEW NOTE alert |
Company Profile |
SEC
News |
Chart |
Request a new note
C
A
S
I |
MELI
-
NASDAQ
Mercadolibre Inc
INTERNET - Internet Software and; Services
|
$276.99
|
+5.72
2.11% |
$277.40
|
563,360
92.81% of 50 DAV
50 DAV is 607,000
|
$297.95
-7.03%
|
6/15/2017
|
$261.73
|
PP = $297.95
|
|
MB = $312.85
|
Most Recent Note - 6/21/2017 6:32:15 PM
Y - Found support at its 50 DMA line. Valid secondary buy point exists up to +5% above the latest high after successfully testing support at its 10-week moving average line. More damaging losses would raise concerns and hurt its outlook.
>>> FEATURED STOCK ARTICLE : Test of 10-Week Moving Average May Be a Secondary Buy Point - 6/15/2017 |
View all notes |
Set NEW NOTE alert |
Company Profile |
SEC
News |
Chart |
Request a new note
C
A
S
I |
HTHT
-
NASDAQ
China Lodging Group Ads
LEISURE - Lodging
|
$79.59
|
+4.11
5.45% |
$81.32
|
391,081
171.53% of 50 DAV
50 DAV is 228,000
|
$88.08
-9.64%
|
9/29/2016
|
$46.12
|
PP = $47.82
|
|
MB = $50.21
|
Most Recent Note - 6/21/2017 1:38:25 PM
G - Finding support and posting a volume-driven gain today after slumping toward its 50 DMA line ($73.81) defining important near-term support to watch.
>>> FEATURED STOCK ARTICLE : Traded Up 108% in 10 Months Since First Highlighted - 5/18/2017 |
View all notes |
Set NEW NOTE alert |
Company Profile |
SEC
News |
Chart |
Request a new note
C
A
S
I |
BEAT
-
NASDAQ
BioTelemetry Inc
Medical-Services
|
$30.20
|
+0.45
1.51% |
$30.50
|
336,956
60.39% of 50 DAV
50 DAV is 558,000
|
$34.00
-11.18%
|
2/14/2017
|
$25.10
|
PP = $24.55
|
|
MB = $25.78
|
Most Recent Note - 6/20/2017 3:38:39 PM
G - Consolidating near its 50 DMA line ($29.83). Prior lows in the $26.50 - $27.00 area define the next important level of support. Raised fundamental concerns with sub par Mar '17 earnings that were repeatedly noted.
>>> FEATURED STOCK ARTICLE : Lingering Below 50-Day Moving Average Line - 6/1/2017 |
View all notes |
Set NEW NOTE alert |
Company Profile |
SEC
News |
Chart |
Request a new note
C
A
S
I |
Symbol/Exchange
Company Name
Industry Group |
PRICE |
CHANGE
(%Change) |
Day High |
Volume
(% DAV)
(% 50 day avg vol) |
52 Wk Hi
% From Hi |
Featured
Date |
Price
Featured |
Pivot Featured |
|
Max Buy |
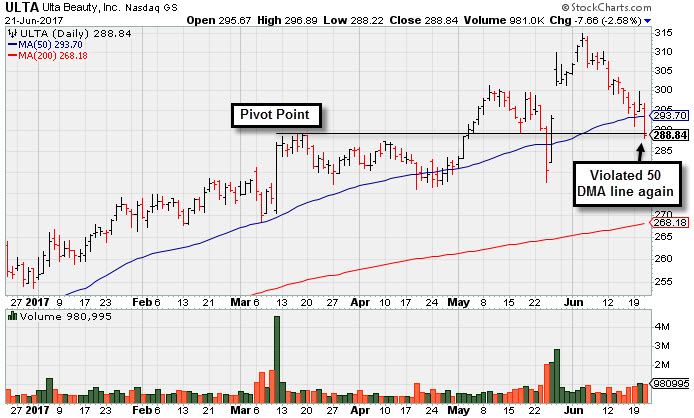
ULTA
-
NYSE
Ulta Beauty Inc
SPECIALTY RETAIL - Specialty Retail, Other
|
$288.84
|
-7.66
-2.58% |
$296.89
|
979,382
140.41% of 50 DAV
50 DAV is 697,500
|
$314.86
-8.26%
|
5/5/2017
|
$293.17
|
PP = $289.37
|
|
MB = $303.84
|
Most Recent Note - 6/21/2017 6:30:18 PM
G - Color code is changed to green after violating its 50 DMA line and slumping below its pivot point after enduring mild distributional pressure. Its Relative Strength rating fell to 69, below the 80+ minimum guideline for buy candidates. See the latest FSU analysis for more details and a new annotated graph.
>>> FEATURED STOCK ARTICLE : Violation of 50-Day Moving Average and Slumping Relative Strength - 6/21/2017 |
View all notes |
Set NEW NOTE alert |
Company Profile |
SEC
News |
Chart |
Request a new note
C
A
S
I |
ESNT
-
NYSE
Essent Group Ltd
Finance-MrtgandRel Svc
|
$36.23
|
-0.05
-0.14% |
$36.55
|
259,116
46.77% of 50 DAV
50 DAV is 554,000
|
$39.50
-8.28%
|
4/4/2017
|
$36.38
|
PP = $36.81
|
|
MB = $38.65
|
Most Recent Note - 6/20/2017 5:21:33 PM
G - Consolidating just below its 50 DMA line ($36.81). Subsequent losses below the prior low ($34.08 on 5/05/17) would raise greater concerns and trigger a worrisome technical sell signal. See the latest FSU analysis for more details and a new annotated graph.
>>> FEATURED STOCK ARTICLE : Sputtering Below its 50-Day Moving Average - 6/20/2017 |
View all notes |
Set NEW NOTE alert |
Company Profile |
SEC
News |
Chart |
Request a new note
C
A
S
I |
FIVE
-
NASDAQ
Five Below Inc
Retail-DiscountandVariety
|
$48.32
|
+0.21
0.44% |
$48.69
|
812,615
68.81% of 50 DAV
50 DAV is 1,181,000
|
$54.13
-10.73%
|
6/2/2017
|
$50.76
|
PP = $52.63
|
|
MB = $55.26
|
Most Recent Note - 6/20/2017 4:17:10 PM
G - Still sputtering below its 50 DMA line ($49.97), and a rebound above that short-term average is needed for its outlook to improve. Failed to produce confirming gains after previously noted - "A convincing volume-driven gain above the pivot point is still needed to clinch a proper technical buy signal."
>>> FEATURED STOCK ARTICLE : Retail - Discount & Variety Firm Perched Near Highs - 6/2/2017 |
View all notes |
Set NEW NOTE alert |
Company Profile |
SEC
News |
Chart |
Request a new note
C
A
S
I |
MTSI
-
NASDAQ
Macom Tech Solution Hldg
Elec-Semiconductor Mfg
|
$56.59
|
-0.17
-0.30% |
$57.40
|
573,288
62.18% of 50 DAV
50 DAV is 922,000
|
$61.70
-8.28%
|
5/16/2017
|
$52.52
|
PP = $53.89
|
|
MB = $56.58
|
Most Recent Note - 6/20/2017 5:25:00 PM
G - Pulled back on light volume closing just above its "max buy" level. The recent lows and its 50 DMA line define important support in the $54-55 area where violations would raise concerns and trigger technical sell signals.
>>> FEATURED STOCK ARTICLE : Big Breakout Gain With More Than 5 Times Average Volume - 5/16/2017 |
View all notes |
Set NEW NOTE alert |
Company Profile |
SEC
News |
Chart |
Request a new note
C
A
S
I |
VEEV
-
NYSE
Veeva Systems Inc Cl A
Computer Sftwr-Medical
|
$62.40
|
+1.07
1.74% |
$62.61
|
1,428,434
82.76% of 50 DAV
50 DAV is 1,726,000
|
$68.07
-8.33%
|
3/16/2017
|
$49.00
|
PP = $48.05
|
|
MB = $50.45
|
Most Recent Note - 6/19/2017 5:32:14 PM
G - Rebounding toward its prior high after finding support near Its 50 DMA line ($57.49). That short term average and recent low ($56.94 on 6/12/17) define important near-term support to watch.
>>> FEATURED STOCK ARTICLE : Wedging Into New High Territory, Extended From Sound Base - 5/15/2017 |
View all notes |
Set NEW NOTE alert |
Company Profile |
SEC
News |
Chart |
Request a new note
C
A
S
I |
Symbol/Exchange
Company Name
Industry Group |
PRICE |
CHANGE
(%Change) |
Day High |
Volume
(% DAV)
(% 50 day avg vol) |
52 Wk Hi
% From Hi |
Featured
Date |
Price
Featured |
Pivot Featured |
|
Max Buy |
ANET
-
NYSE
Arista Networks Inc
TELECOMMUNICATIONS - Communication Equipment
|
$158.16
|
+3.13
2.02% |
$158.84
|
796,101
97.56% of 50 DAV
50 DAV is 816,000
|
$158.57
-0.26%
|
4/17/2017
|
$132.75
|
PP = $135.27
|
|
MB = $142.03
|
Most Recent Note - 6/15/2017 5:37:20 PM
G - Very extended from any sound base. Its 50 DMA line ($143.11) and prior lows define near-term support to watch.
>>> FEATURED STOCK ARTICLE : Computer Networking Firm Very Extended From Any Sound Base - 6/6/2017 |
View all notes |
Set NEW NOTE alert |
Company Profile |
SEC
News |
Chart |
Request a new note
C
A
S
I |
GRUB
-
NYSE
Grubhub Inc
COMPUTER SOFTWARE and SERVICES - Technical and System Software
|
$46.54
|
+1.15
2.53% |
$47.75
|
3,780,024
157.76% of 50 DAV
50 DAV is 2,396,000
|
$46.84
-0.63%
|
6/21/2017
|
$47.33
|
PP = $46.94
|
|
MB = $49.29
|
Most Recent Note - 6/21/2017 1:37:33 PM
Y - Hit a new 52-week high with today's 3rd consecutive gain and it is challenging its all-time high. A new pivot point is cited based on its 5/08/17 high plus 10 cents. A confirming gain backed by at least +40% above average volume and strong close above the pivot point may clinch a technical buy signal.
>>> FEATURED STOCK ARTICLE : Stalled After Reaching New Highs and Encountered Mild Pressure - 5/22/2017 |
View all notes |
Set NEW NOTE alert |
Company Profile |
SEC
News |
Chart |
Request a new note
C
A
S
I |
IBP
-
NYSE
Installed Building Prod
DIVERSIFIED SERVICES - Business/Management Services
|
$53.75
|
-0.05
-0.09% |
$54.15
|
99,564
63.82% of 50 DAV
50 DAV is 156,000
|
$55.45
-3.07%
|
6/13/2017
|
$54.25
|
PP = $55.55
|
|
MB = $58.33
|
Most Recent Note - 6/20/2017 3:41:40 PM
Y - Perched within close striking distance of the new pivot point cited based on its 4/27/17 high plus 10 cents. Subsequent volume-driven gains above the pivot point may trigger a new technical buy signal. Its 50 DMA line ($51.16) defines near-term support above the recent low ($46.65 on 5/09/17).
>>> FEATURED STOCK ARTICLE : Consolidating Near 50-Day Moving Average Line - 6/5/2017 |
View all notes |
Set NEW NOTE alert |
Company Profile |
SEC
News |
Chart |
Request a new note
C
A
S
I |
NCOM
-
NASDAQ
National Commerce Corp
BANKING - Regional - Southeast Banks
|
$38.25
|
-0.45
-1.16% |
$38.80
|
19,212
66.25% of 50 DAV
50 DAV is 29,000
|
$40.00
-4.38%
|
4/25/2017
|
$38.95
|
PP = $40.09
|
|
MB = $42.09
|
Most Recent Note - 6/21/2017 2:00:01 PM
Y - Still perched within close striking distance of its 52-week high and consolidating above its 50 DMA line ($38.17). Subsequent gains above the pivot point backed by a minimum of +40% above average volume may trigger a technical buy signal. Prior lows in the $36-35 area define the next important support level.
>>> FEATURED STOCK ARTICLE : Sputtering Near 50-Day Moving Average After Stalling - 5/30/2017 |
View all notes |
Set NEW NOTE alert |
Company Profile |
SEC
News |
Chart |
Request a new note
C
A
S
I |
INGN
-
NASDAQ
Inogen Inc
HEALTH SERVICES - Medical Instruments and Supplies
|
$95.95
|
+1.51
1.60% |
$96.00
|
175,953
93.10% of 50 DAV
50 DAV is 189,000
|
$95.43
0.54%
|
4/17/2017
|
$76.77
|
PP = $80.04
|
|
MB = $84.04
|
Most Recent Note - 6/16/2017 5:28:44 PM
G - Posted a small gain with heavy volume today. Perched near its all-time high, very extended from its prior base. Near-term support is its 50 DMA line ($84.18).
>>> FEATURED STOCK ARTICLE : Perched at All Time High Following Volume-Driven Gains - 5/31/2017 |
View all notes |
Set NEW NOTE alert |
Company Profile |
SEC
News |
Chart |
Request a new note
C
A
S
I |
Symbol/Exchange
Company Name
Industry Group |
PRICE |
CHANGE
(%Change) |
Day High |
Volume
(% DAV)
(% 50 day avg vol) |
52 Wk Hi
% From Hi |
Featured
Date |
Price
Featured |
Pivot Featured |
|
Max Buy |
HQY
-
NASDAQ
Healthequity Inc
COMPUTER SOFTWARE and SERVICES - Healthcare Information Service
|
$51.44
|
-0.24
-0.46% |
$52.25
|
481,207
98.21% of 50 DAV
50 DAV is 490,000
|
$54.95
-6.39%
|
6/7/2017
|
$50.01
|
PP = $49.35
|
|
MB = $51.82
|
Most Recent Note - 6/20/2017 4:18:31 PM
G - Quietly consolidating near its "max buy" level and above prior highs in the $49 area defining initial support.
>>> FEATURED STOCK ARTICLE : High Volume Breakout Quickly Getting Extended - 6/7/2017 |
View all notes |
Set NEW NOTE alert |
Company Profile |
SEC
News |
Chart |
Request a new note
C
A
S
I |
PLAY
-
NASDAQ
Dave & Buster's Ent Inc
Retail-Restaurants
|
$66.08
|
-0.78
-1.17% |
$67.20
|
744,384
109.47% of 50 DAV
50 DAV is 680,000
|
$73.48
-10.07%
|
2/23/2017
|
$55.41
|
PP = $58.35
|
|
MB = $61.27
|
Most Recent Note - 6/20/2017 3:59:42 PM
G - Extended from any sound base, slumping toward its 50 DMA line ($65.75) and prior lows defining near-term support to watch.
>>> FEATURED STOCK ARTICLE : Perched Near Record High After Solid April '17 Quarterly Results - 6/12/2017 |
View all notes |
Set NEW NOTE alert |
Company Profile |
SEC
News |
Chart |
Request a new note
C
A
S
I |
OLLI
-
NASDAQ
Ollie's Bargain Outlet
Retail-DiscountandVariety
|
$40.25
|
-0.30
-0.74% |
$41.45
|
764,572
115.49% of 50 DAV
50 DAV is 662,000
|
$44.08
-8.68%
|
3/27/2017
|
$32.80
|
PP = $33.55
|
|
MB = $35.23
|
Most Recent Note - 6/20/2017 5:25:45 PM
G - Pulled back today on light volume. It is extended from any sound base. Its 50 DMA line ($39.52) and recent low ($37.60 on 5/16/17) define near-term support to watch on pullbacks. Fundamentals remain strong.
>>> FEATURED STOCK ARTICLE : Retailer Rallied +25% in 2 Months Since Featured - 5/19/2017 |
View all notes |
Set NEW NOTE alert |
Company Profile |
SEC
News |
Chart |
Request a new note
C
A
S
I |
MOMO
-
NASDAQ
Momo Inc Ads Cl A
INTERNET - Content
|
$38.70
|
+0.81
2.14% |
$39.39
|
6,684,940
94.82% of 50 DAV
50 DAV is 7,050,000
|
$45.95
-15.78%
|
3/7/2017
|
$29.71
|
PP = $27.83
|
|
MB = $29.22
|
Most Recent Note - 6/21/2017 2:01:57 PM
G - Posting a 4th consecutive small gain challenging its 50 DMA line which may act as resistance. A rebound above the 50 DMA line ($38.79) is needed for its outlook to improve. Prior low ($35.55 on 4/26/17) defines the next important chart support level where a violation would raise more serious concerns.
>>> FEATURED STOCK ARTICLE : Sputtering Below 50-Day Moving Average Line - 6/14/2017 |
View all notes |
Set NEW NOTE alert |
Company Profile |
SEC
News |
Chart |
Request a new note
C
A
S
I |
HLI
-
NYSE
Houlihan Lokey Inc Cl A
Finance-Invest Bnk/Bkrs
|
$34.70
|
-0.12
-0.34% |
$35.04
|
100,248
54.48% of 50 DAV
50 DAV is 184,000
|
$36.65
-5.32%
|
5/10/2017
|
$35.85
|
PP = $35.05
|
|
MB = $36.80
|
Most Recent Note - 6/19/2017 5:26:57 PM
Y - Gapped up today while consolidating above its 50 DMA line ($33.85). Recent low ($32.72 on 5/31/17) defines near-term support where violations would raise concerns and trigger a more worrisome technical sell signal. See the latest FSU analysis for more details and a new annotated graph.
>>> FEATURED STOCK ARTICLE : Gapped Up and Nearly Challenged Prior High - 6/19/2017 |
View all notes |
Set NEW NOTE alert |
Company Profile |
SEC
News |
Chart |
Request a new note
C
A
S
I |
Symbol/Exchange
Company Name
Industry Group |
PRICE |
CHANGE
(%Change) |
Day High |
Volume
(% DAV)
(% 50 day avg vol) |
52 Wk Hi
% From Hi |
Featured
Date |
Price
Featured |
Pivot Featured |
|
Max Buy |