***Last / Change / Volume data in this table is the closing quote data***
Symbol/Exchange
Company Name
Industry Group |
PRICE |
CHANGE
(%Change) |
Day High |
Volume
(% DAV)
(% 50 day avg vol) |
52 Wk Hi
% From Hi |
Featured
Date |
Price
Featured |
Pivot Featured |
|
Max Buy |
THO
-
NYSE
Thor Industries Inc
AUTOMOTIVE - Recreational Vehicles
|
$106.53
|
+1.40
1.33% |
$107.00
|
659,959
78.75% of 50 DAV
50 DAV is 838,000
|
$115.74
-7.96%
|
6/7/2017
|
$102.95
|
PP = $98.92
|
|
MB = $103.87
|
Most Recent Note - 6/15/2017 5:36:06 PM
G - Color code is changed to green while stubbornly holding its ground just above its "max buy" level. Highlighted in 6/07/17 mid-day report in yellow with pivot point cited based on its 4/27/17 high.
>>> FEATURED STOCK ARTICLE : Some Overhead Supply Remains After Latest Technical Breakout - 6/8/2017 |
View all notes |
Set NEW NOTE alert |
Company Profile |
SEC
News |
Chart |
Request a new note
C
A
S
I |
SBCF
-
NASDAQ
Seacoast Banking Corp Fl
BANKING - Regional - Mid-Atlantic Banks
|
$24.59
|
+0.04
0.16% |
$25.10
|
140,475
43.90% of 50 DAV
50 DAV is 320,000
|
$25.88
-4.98%
|
6/9/2017
|
$24.13
|
PP = $25.98
|
|
MB = $27.28
|
 Most Recent Note - 6/19/2017 5:30:01 PM
Y - Quietly consolidating within striking distance of the new pivot point cited based on its 4/25/17 high. Previously noted - "Subsequent volume-driven gains for new highs may trigger a new technical buy signal. Rebound above the 50 DMA line helped its outlook improve. Fundamentals remain strong."
>>> FEATURED STOCK ARTICLE : Relative Strength Rating Slumped After Lingering Below 50 DMA - 5/25/2017 |
View all notes |
Set NEW NOTE alert |
Company Profile |
SEC
News |
Chart |
Request a new note
C
A
S
I |
BLMT
-
NASDAQ
B S B Bancorp Inc
BANKING - Regional - Midwest Banks
|
$30.40
|
+0.20
0.66% |
$30.40
|
14,856
87.39% of 50 DAV
50 DAV is 17,000
|
$30.75
-1.14%
|
6/16/2017
|
$29.85
|
PP = $29.80
|
|
MB = $31.29
|
Most Recent Note - 6/16/2017 5:26:49 PM
Y - Posted a gain with heavy volume today after highlighted in yellow with pivot point cited based on its 4/26/17 high. Perched near its all-time high following volume-driven gains from a sound base. Reported earnings +43% on +20% sales revenues for the Mar '17 quarter. Prior quarterly earnings increases also have been above the +25% minimum guideline (C criteria). Annual earnings (A criteria) history has been strong. See the latest FSU analysis for more details and a new annotated graph.
>>> FEATURED STOCK ARTICLE : Perched Near High After Volume-Driven Gains - 6/16/2017 |
View all notes |
Set NEW NOTE alert |
Company Profile |
SEC
News |
Chart |
Request a new note
C
A
S
I |
BERY
-
NYSE
Berry Global Group Inc
CONSUMER NON-DURABLES - Packaging and Containers
|
$57.76
|
+0.00
0.00% |
$58.31
|
1,065,652
89.18% of 50 DAV
50 DAV is 1,195,000
|
$58.95
-2.02%
|
5/26/2017
|
$58.31
|
PP = $57.04
|
|
MB = $59.89
|
Most Recent Note - 6/15/2017 5:30:09 PM
Y -Still consolidating in a tight range above its pivot point, quietly holding its ground near its 52-week high. Reported earnings +36% on +12% sales revenues for the Mar '17 quarter, and fundamentals remain strong.
>>> FEATURED STOCK ARTICLE : Rising From Advanced Base With Above Average Volume - 5/26/2017 |
View all notes |
Set NEW NOTE alert |
Company Profile |
SEC
News |
Chart |
Request a new note
C
A
S
I |
EW
-
NYSE
Edwards Lifesciences Cp
HEALTH SERVICES - Medical Appliances and Equipment
|
$118.84
|
+3.85
3.35% |
$119.12
|
1,570,296
107.78% of 50 DAV
50 DAV is 1,457,000
|
$121.75
-2.39%
|
5/16/2017
|
$114.12
|
PP = $113.04
|
|
MB = $118.69
|
Most Recent Note - 6/19/2017 5:25:23 PM
G - Posted a solid gain today, and its color code is changed to green after rallying above its recent high and above its "max buy" level. Perched within close striking distance of its all-time high
>>> FEATURED STOCK ARTICLE : Some Overhead Supply Remains For High Ranked Medical Firm - 5/17/2017 |
View all notes |
Set NEW NOTE alert |
Company Profile |
SEC
News |
Chart |
Request a new note
C
A
S
I |
Symbol/Exchange
Company Name
Industry Group |
PRICE |
CHANGE
(%Change) |
Day High |
Volume
(% DAV)
(% 50 day avg vol) |
52 Wk Hi
% From Hi |
Featured
Date |
Price
Featured |
Pivot Featured |
|
Max Buy |
NTES
-
NASDAQ
Netease Inc Adr
INTERNET - Internet Information Providers
|
$312.93
|
+15.96
5.37% |
$313.43
|
1,493,011
115.02% of 50 DAV
50 DAV is 1,298,000
|
$323.10
-3.15%
|
6/8/2017
|
$310.76
|
PP = $307.62
|
|
MB = $323.00
|
Most Recent Note - 6/19/2017 5:40:23 PM
Y - Gapped up and posted a big gain today on slightly above average volume, rising back above the pivot point cited based on its 3/01/17 high plus 10 cents. Fundamentals remain strong and it reported earnings +52% on +62% sales revenues for the Mar '17 quarter.
>>> FEATURED STOCK ARTICLE : Encountered Distributional Pressure After Hitting New Highs - 6/9/2017 |
View all notes |
Set NEW NOTE alert |
Company Profile |
SEC
News |
Chart |
Request a new note
C
A
S
I |
STMP
-
NASDAQ
Stamps.com Inc
INTERNET - Internet Software and Services
|
$150.00
|
+2.90
1.97% |
$150.85
|
446,940
60.48% of 50 DAV
50 DAV is 739,000
|
$149.80
0.13%
|
5/24/2017
|
$133.10
|
PP = $136.10
|
|
MB = $142.91
|
Most Recent Note - 6/16/2017 5:24:16 PM
G - Color code is changed to green after rising above its "max buy" level for a new high close. Prior high ($136 on 2/22/17) defines near term support to watch on pullbacks.
>>> FEATURED STOCK ARTICLE : Rallying From Bottom of 13-Week Cup Shaped Base - 5/24/2017 |
View all notes |
Set NEW NOTE alert |
Company Profile |
SEC
News |
Chart |
Request a new note
C
A
S
I |
MELI
-
NASDAQ
Mercadolibre Inc
INTERNET - Internet Software and; Services
|
$274.32
|
+10.87
4.13% |
$275.53
|
580,344
97.05% of 50 DAV
50 DAV is 598,000
|
$297.95
-7.93%
|
6/15/2017
|
$261.73
|
PP = $297.95
|
|
MB = $312.85
|
Most Recent Note - 6/19/2017 5:35:27 PM
Y - Gapped up today for a big gain on average volume. Highlighted in yellow in the 6/15/17 mid-day report. A valid secondary buy point exists up to +5% above the latest high after successfully testing support at its 10-week moving average line. More damaging losses would raise concerns and hurt its outlook.
>>> FEATURED STOCK ARTICLE : Test of 10-Week Moving Average May Be a Secondary Buy Point - 6/15/2017 |
View all notes |
Set NEW NOTE alert |
Company Profile |
SEC
News |
Chart |
Request a new note
C
A
S
I |
HTHT
-
NASDAQ
China Lodging Group Ads
LEISURE - Lodging
|
$78.44
|
+2.11
2.76% |
$79.27
|
217,393
97.49% of 50 DAV
50 DAV is 223,000
|
$88.08
-10.94%
|
9/29/2016
|
$46.12
|
PP = $47.82
|
|
MB = $50.21
|
Most Recent Note - 6/14/2017 11:38:02 AM
G - Enduring recent distributional pressure while retreating from its all-time high. Extended from any sound base and well above its 50 DMA line ($72.20) defining important near-term support to watch.
>>> FEATURED STOCK ARTICLE : Traded Up 108% in 10 Months Since First Highlighted - 5/18/2017 |
View all notes |
Set NEW NOTE alert |
Company Profile |
SEC
News |
Chart |
Request a new note
C
A
S
I |
BEAT
-
NASDAQ
BioTelemetry Inc
Medical-Services
|
$29.45
|
+0.85
2.97% |
$29.67
|
554,904
100.53% of 50 DAV
50 DAV is 552,000
|
$34.00
-13.38%
|
2/14/2017
|
$25.10
|
PP = $24.55
|
|
MB = $25.78
|
Most Recent Note - 6/13/2017 10:20:47 PM
G - Slumped back below its 50 DMA line ($29.69) today. Prior lows in the $26.50 - $27.00 area define the next important level of support. Raised fundamental concerns with sub par Mar '17 earnings that were repeatedly noted.
>>> FEATURED STOCK ARTICLE : Lingering Below 50-Day Moving Average Line - 6/1/2017 |
View all notes |
Set NEW NOTE alert |
Company Profile |
SEC
News |
Chart |
Request a new note
C
A
S
I |
Symbol/Exchange
Company Name
Industry Group |
PRICE |
CHANGE
(%Change) |
Day High |
Volume
(% DAV)
(% 50 day avg vol) |
52 Wk Hi
% From Hi |
Featured
Date |
Price
Featured |
Pivot Featured |
|
Max Buy |
ULTA
-
NYSE
Ulta Beauty Inc
SPECIALTY RETAIL - Specialty Retail, Other
|
$294.17
|
-1.77
-0.60% |
$297.00
|
878,417
129.83% of 50 DAV
50 DAV is 676,600
|
$314.86
-6.57%
|
5/5/2017
|
$293.17
|
PP = $289.37
|
|
MB = $303.84
|
Most Recent Note - 6/14/2017 12:47:32 PM
Y - Color code is changed to yellow while consolidating below its "max buy" level. However, its Relative Strength rating fell to 78, below the 80+ minimum guideline for buy candidates.
>>> FEATURED STOCK ARTICLE : Holding Ground After Recent Gains Lacking Great Volume - 5/12/2017 |
View all notes |
Set NEW NOTE alert |
Company Profile |
SEC
News |
Chart |
Request a new note
C
A
S
I |
ESNT
-
NYSE
Essent Group Ltd
Finance-MrtgandRel Svc
|
$36.84
|
+0.40
1.10% |
$37.29
|
219,145
37.98% of 50 DAV
50 DAV is 577,000
|
$39.50
-6.73%
|
4/4/2017
|
$36.38
|
PP = $36.81
|
|
MB = $38.65
|
Most Recent Note - 6/19/2017 5:22:33 PM
G - Still consolidating near its 50 DMA line ($36.81). Subsequent losses below the prior low ($34.08 on 5/05/17) would raise greater concerns and trigger a worrisome technical sell signal.
>>> FEATURED STOCK ARTICLE : Rebound Above 50-Day Moving Average Helped Outlook - 5/11/2017 |
View all notes |
Set NEW NOTE alert |
Company Profile |
SEC
News |
Chart |
Request a new note
C
A
S
I |
FIVE
-
NASDAQ
Five Below Inc
Retail-DiscountandVariety
|
$48.95
|
+0.93
1.94% |
$49.09
|
1,366,709
115.33% of 50 DAV
50 DAV is 1,185,000
|
$54.13
-9.57%
|
6/2/2017
|
$50.76
|
PP = $52.63
|
|
MB = $55.26
|
Most Recent Note - 6/14/2017 11:49:26 AM
G - Color code was changed to green after gapping down today and violating its 50 DMA line triggering a technical sell signal. It failed to produce confirming gains after previously noted - "A convincing volume-driven gain above the pivot point is still needed to clinch a proper technical buy signal."
>>> FEATURED STOCK ARTICLE : Retail - Discount & Variety Firm Perched Near Highs - 6/2/2017 |
View all notes |
Set NEW NOTE alert |
Company Profile |
SEC
News |
Chart |
Request a new note
C
A
S
I |
MTSI
-
NASDAQ
Macom Tech Solution Hldg
Elec-Semiconductor Mfg
|
$58.06
|
+2.20
3.94% |
$58.25
|
865,430
94.17% of 50 DAV
50 DAV is 919,000
|
$61.70
-5.90%
|
5/16/2017
|
$52.52
|
PP = $53.89
|
|
MB = $56.58
|
Most Recent Note - 6/19/2017 5:39:08 PM
G - Gapped up today and posted a big gain above its "max buy" level on near average volume and its color code is changed to green. The recent lows and its 50 DMA line define important support in the $54-55 area where violations would raise concerns and trigger technical sell signals.
>>> FEATURED STOCK ARTICLE : Big Breakout Gain With More Than 5 Times Average Volume - 5/16/2017 |
View all notes |
Set NEW NOTE alert |
Company Profile |
SEC
News |
Chart |
Request a new note
C
A
S
I |
VEEV
-
NYSE
Veeva Systems Inc Cl A
Computer Sftwr-Medical
|
$62.35
|
+2.72
4.56% |
$62.42
|
2,138,124
126.29% of 50 DAV
50 DAV is 1,693,000
|
$68.07
-8.40%
|
3/16/2017
|
$49.00
|
PP = $48.05
|
|
MB = $50.45
|
Most Recent Note - 6/19/2017 5:32:14 PM
G - Rebounding toward its prior high after finding support near Its 50 DMA line ($57.49). That short term average and recent low ($56.94 on 6/12/17) define important near-term support to watch.
>>> FEATURED STOCK ARTICLE : Wedging Into New High Territory, Extended From Sound Base - 5/15/2017 |
View all notes |
Set NEW NOTE alert |
Company Profile |
SEC
News |
Chart |
Request a new note
C
A
S
I |
Symbol/Exchange
Company Name
Industry Group |
PRICE |
CHANGE
(%Change) |
Day High |
Volume
(% DAV)
(% 50 day avg vol) |
52 Wk Hi
% From Hi |
Featured
Date |
Price
Featured |
Pivot Featured |
|
Max Buy |
ANET
-
NYSE
Arista Networks Inc
TELECOMMUNICATIONS - Communication Equipment
|
$156.66
|
+5.08
3.35% |
$157.66
|
801,155
97.82% of 50 DAV
50 DAV is 819,000
|
$158.57
-1.20%
|
4/17/2017
|
$132.75
|
PP = $135.27
|
|
MB = $142.03
|
Most Recent Note - 6/15/2017 5:37:20 PM
G - Very extended from any sound base. Its 50 DMA line ($143.11) and prior lows define near-term support to watch.
>>> FEATURED STOCK ARTICLE : Computer Networking Firm Very Extended From Any Sound Base - 6/6/2017 |
View all notes |
Set NEW NOTE alert |
Company Profile |
SEC
News |
Chart |
Request a new note
C
A
S
I |
GRUB
-
NYSE
Grubhub Inc
COMPUTER SOFTWARE and SERVICES - Technical and System Software
|
$45.34
|
+2.02
4.66% |
$46.46
|
3,251,074
138.40% of 50 DAV
50 DAV is 2,349,000
|
$46.84
-3.19%
|
4/28/2017
|
$44.22
|
PP = $44.68
|
|
MB = $46.91
|
Most Recent Note - 6/19/2017 12:37:12 PM
Y - Gapped up today challenging its 52-week high. A confirming gain backed by at least +40% above average volume and strong close above the pivot point may clinch a technical buy signal.
>>> FEATURED STOCK ARTICLE : Stalled After Reaching New Highs and Encountered Mild Pressure - 5/22/2017 |
View all notes |
Set NEW NOTE alert |
Company Profile |
SEC
News |
Chart |
Request a new note
C
A
S
I |
IBP
-
NYSE
Installed Building Prod
DIVERSIFIED SERVICES - Business/Management Services
|
$53.65
|
+0.15
0.28% |
$54.80
|
131,528
84.86% of 50 DAV
50 DAV is 155,000
|
$55.45
-3.25%
|
6/13/2017
|
$54.25
|
PP = $55.55
|
|
MB = $58.33
|
Most Recent Note - 6/13/2017 1:20:43 PM
Y - Color code is changed to yellow with new pivot point cited based on its 4/27/17 high plus 10 cents. Subsequent volume-driven gains above the pivot point may trigger a new technical buy signal. Rebounded above its 50 DMA line, rising near the prior high with today's 10th gain in the span of 11 sessions. The recent low ($46.65 on 5/09/17) defines important near-term support.
>>> FEATURED STOCK ARTICLE : Consolidating Near 50-Day Moving Average Line - 6/5/2017 |
View all notes |
Set NEW NOTE alert |
Company Profile |
SEC
News |
Chart |
Request a new note
C
A
S
I |
NCOM
-
NASDAQ
National Commerce Corp
BANKING - Regional - Southeast Banks
|
$38.95
|
+0.00
0.00% |
$39.45
|
17,680
58.93% of 50 DAV
50 DAV is 30,000
|
$40.00
-2.63%
|
4/25/2017
|
$38.95
|
PP = $40.09
|
|
MB = $42.09
|
Most Recent Note - 6/14/2017 11:41:11 AM
Y - Color code is changed to yellow while perched within close striking distance of its 52-week high and consolidating above its 50 DMA line ($37.95). Subsequent gains above the pivot point backed by a minimum of +40% above average volume may trigger a technical buy signal. Prior lows in the $36-35 area define the next important support level.
>>> FEATURED STOCK ARTICLE : Sputtering Near 50-Day Moving Average After Stalling - 5/30/2017 |
View all notes |
Set NEW NOTE alert |
Company Profile |
SEC
News |
Chart |
Request a new note
C
A
S
I |
INGN
-
NASDAQ
Inogen Inc
HEALTH SERVICES - Medical Instruments and Supplies
|
$93.77
|
+1.46
1.58% |
$94.40
|
209,188
111.27% of 50 DAV
50 DAV is 188,000
|
$95.43
-1.74%
|
4/17/2017
|
$76.77
|
PP = $80.04
|
|
MB = $84.04
|
Most Recent Note - 6/16/2017 5:28:44 PM
G - Posted a small gain with heavy volume today. Perched near its all-time high, very extended from its prior base. Near-term support is its 50 DMA line ($84.18).
>>> FEATURED STOCK ARTICLE : Perched at All Time High Following Volume-Driven Gains - 5/31/2017 |
View all notes |
Set NEW NOTE alert |
Company Profile |
SEC
News |
Chart |
Request a new note
C
A
S
I |
Symbol/Exchange
Company Name
Industry Group |
PRICE |
CHANGE
(%Change) |
Day High |
Volume
(% DAV)
(% 50 day avg vol) |
52 Wk Hi
% From Hi |
Featured
Date |
Price
Featured |
Pivot Featured |
|
Max Buy |
HQY
-
NASDAQ
Healthequity Inc
COMPUTER SOFTWARE and SERVICES - Healthcare Information Service
|
$51.40
|
+0.21
0.41% |
$52.25
|
349,184
70.97% of 50 DAV
50 DAV is 492,000
|
$54.95
-6.46%
|
6/7/2017
|
$50.01
|
PP = $49.35
|
|
MB = $51.82
|
Most Recent Note - 6/14/2017 11:52:56 AM
G - Consolidating above prior highs in the $49 area defining initial support. It is slightly extended from its prior base following volume-driven gains.
>>> FEATURED STOCK ARTICLE : High Volume Breakout Quickly Getting Extended - 6/7/2017 |
View all notes |
Set NEW NOTE alert |
Company Profile |
SEC
News |
Chart |
Request a new note
C
A
S
I |
PLAY
-
NASDAQ
Dave & Buster's Ent Inc
Retail-Restaurants
|
$69.02
|
+0.67
0.98% |
$69.99
|
618,004
91.42% of 50 DAV
50 DAV is 676,000
|
$73.48
-6.07%
|
2/23/2017
|
$55.41
|
PP = $58.35
|
|
MB = $61.27
|
Most Recent Note - 6/14/2017 6:03:47 PM
G - Pulled back with higher volume today, enduring more distributional pressure. Its 50 DMA line ($65.09) defines near-term support to watch.
>>> FEATURED STOCK ARTICLE : Perched Near Record High After Solid April '17 Quarterly Results - 6/12/2017 |
View all notes |
Set NEW NOTE alert |
Company Profile |
SEC
News |
Chart |
Request a new note
C
A
S
I |
OLLI
-
NASDAQ
Ollie's Bargain Outlet
Retail-DiscountandVariety
|
$41.65
|
+0.70
1.71% |
$41.95
|
625,527
95.35% of 50 DAV
50 DAV is 656,000
|
$44.08
-5.50%
|
3/27/2017
|
$32.80
|
PP = $33.55
|
|
MB = $35.23
|
Most Recent Note - 6/19/2017 5:28:21 PM
G - Posted a gain today on lighter (near average) volume. It is extended from any sound base. Its 50 DMA line ($39.38) and recent low ($37.60 on 5/16/17) define near-term support to watch on pullbacks. Fundamentals remain strong.
>>> FEATURED STOCK ARTICLE : Retailer Rallied +25% in 2 Months Since Featured - 5/19/2017 |
View all notes |
Set NEW NOTE alert |
Company Profile |
SEC
News |
Chart |
Request a new note
C
A
S
I |
MOMO
-
NASDAQ
Momo Inc Ads Cl A
INTERNET - Content
|
$37.70
|
+0.81
2.20% |
$38.13
|
4,207,526
59.51% of 50 DAV
50 DAV is 7,070,000
|
$45.95
-17.95%
|
3/7/2017
|
$29.71
|
PP = $27.83
|
|
MB = $29.22
|
Most Recent Note - 6/14/2017 6:00:42 PM
G - Sputtering below its 50 DMA line after losses on higher volume. A rebound above the 50 DMA line is needed for its outlook to improve. Prior low ($35.55 on 4/26/17) defines the next important chart support level where a violation would raise more serious concerns. See the latest FSU analysis for more details and a new annotated graph.
>>> FEATURED STOCK ARTICLE : Sputtering Below 50-Day Moving Average Line - 6/14/2017 |
View all notes |
Set NEW NOTE alert |
Company Profile |
SEC
News |
Chart |
Request a new note
C
A
S
I |
HLI
-
NYSE
Houlihan Lokey Inc Cl A
Finance-Invest Bnk/Bkrs
|
$34.90
|
+0.61
1.78% |
$35.53
|
239,378
128.70% of 50 DAV
50 DAV is 186,000
|
$36.65
-4.77%
|
5/10/2017
|
$35.85
|
PP = $35.05
|
|
MB = $36.80
|
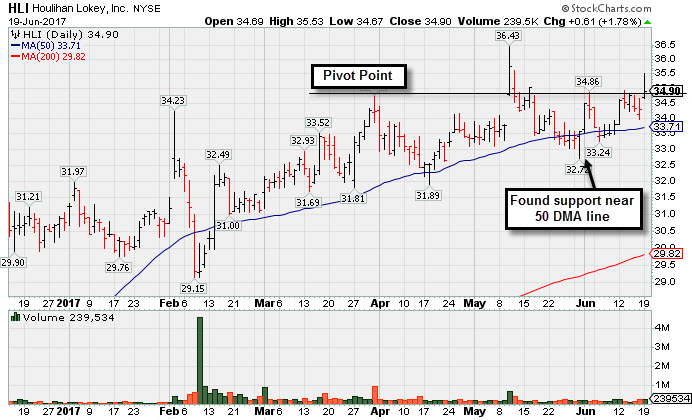
Most Recent Note - 6/19/2017 5:26:57 PM
Y - Gapped up today while consolidating above its 50 DMA line ($33.85). Recent low ($32.72 on 5/31/17) defines near-term support where violations would raise concerns and trigger a more worrisome technical sell signal. See the latest FSU analysis for more details and a new annotated graph.
>>> FEATURED STOCK ARTICLE : Gapped Up and Nearly Challenged Prior High - 6/19/2017 |
View all notes |
Set NEW NOTE alert |
Company Profile |
SEC
News |
Chart |
Request a new note
C
A
S
I |
Symbol/Exchange
Company Name
Industry Group |
PRICE |
CHANGE
(%Change) |
Day High |
Volume
(% DAV)
(% 50 day avg vol) |
52 Wk Hi
% From Hi |
Featured
Date |
Price
Featured |
Pivot Featured |
|
Max Buy |