You are not logged in.
This means you
CAN ONLY VIEW reports that were published prior to Thursday, March 20, 2025.
You
MUST UPGRADE YOUR MEMBERSHIP if you want to see any current reports.
AFTER MARKET UPDATE - THURSDAY, MAY 18TH, 2017
Previous After Market Report Next After Market Report >>>
|
|
|
|
DOW |
+56.09 |
20,663.02 |
+0.27% |
|
Volume |
1,168,669,640 |
+0% |
|
Volume |
1,927,159,880 |
-10% |
|
NASDAQ |
+43.89 |
6,055.13 |
+0.73% |
|
Advancers |
1,488 |
51% |
|
Advancers |
1,632 |
58% |
|
S&P 500 |
+8.69 |
2,365.72 |
+0.37% |
|
Decliners |
1,443 |
49% |
|
Decliners |
1,196 |
42% |
|
Russell 2000 |
+5.19 |
1,361.08 |
+0.38% |
|
52 Wk Highs |
35 |
|
|
52 Wk Highs |
51 |
|
|
S&P 600 |
+2.08 |
824.24 |
+0.25% |
|
52 Wk Lows |
78 |
|
|
52 Wk Lows |
107 |
|
|
 |
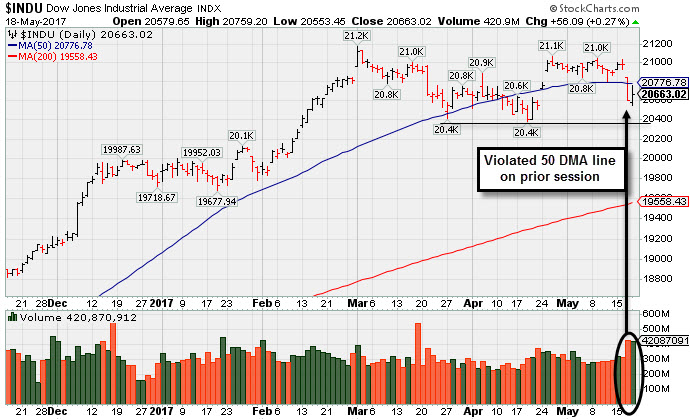
Major Indices Rebounded From Worst 2017 Loss
Kenneth J. Gruneisen - Passed the CAN SLIM® Master's Exam
Stocks finished higher on Thursday. The Dow was up 56 points to 20663. The S&P 500 added 8 points to 2365 and the Nasdaq Composite gained 43 points to 6055. The volume reported was near the prior session total on the NYSE and lighter on the Nasdaq exchange. Advancers led decliners by 4-3 on the Nasdaq exchange while the mix was nearly even on the NYSE. Leadership improved slightly as there were 17 high-ranked companies from the Leaders List that made new 52-week highs and were listed on the BreakOuts Page, versus the total of 8 on the prior session. New 52-week lows totals outnumbered new 52-week highs on the NYSE and on the Nasdaq exchange. PICTURED: The Dow Jones Industrial Average abruptly violated its 50-day moving average (DMA) line on the prior session with a big loss on heavier volume.
The major averages (M criteria) saw their uptrend come under greater pressure on Wednesday, meanwhile, there was clearly less market leadership (number of high-ranked stocks hitting new highs). If market conditions continue to deteriorate, disciplined investors will reduce exposure and raise cash levels in their portfolios by selling stocks showing signs of deterioration on a case-by-case basis. The Featured Stocks Page lists noteworthy high-ranked leaders.
The major averages rebounded on Thursday, recovering from their worst day of 2017 as investors weigh President Trump’s chances to deliver on his pro-growth agenda. On Thursday, House Speaker Paul Ryan insisted that Congress will implement tax reform this year despite the turmoil in Washington. Overseas, Brazil’s IBOVESPA fell more than 9% on the session amid a developing scandal involving the country's newly installed president. On the domestic front, initial jobless claims came in at 232,000, below the expected 240,000.
Nine of 11 sectors in the S&P 500 ended in positive territory. Telecom stocks led the advance with AT&T (T +1.31%) rising. In earnings, Wal-Mart (WMT +3.22%) rose as the retail giant reported better-than-expected quarterly profit. L Brands (LB +2.67%) rose after the company beat revenue estimates and raised its 2017 full-year guidance. Elsewhere in stock news, Athenahealth (ATHN 22.38%) rallied as Elliott Associates disclosed a 9.2% economic exposure while suggesting that shares are undervalued. Cisco Systems (CSCO -7.21%) fell after providing weak current-quarter outlook and announcing 1,100 new job cuts.
Treasuries finished mixed with the benchmark 10-year note up 1/32 to yield 2.23%. In commodities, NYMEX WTI crude added 0.5% to $49.32/barrel. COMEX gold lost 0.9% to $1248.00/ounce. |
 Kenneth J. Gruneisen started out as a licensed stockbroker in August 1987, a couple of months prior to the historic stock market crash that took the Dow Jones Industrial Average down -22.6% in a single day. He has published daily fact-based fundamental and technical analysis on high-ranked stocks online for two decades. Through FACTBASEDINVESTING.COM, Kenneth provides educational articles, news, market commentary, and other information regarding proven investment systems that work in good times and bad.
Comments contained in the body of this report are technical opinions only and are not necessarily those of Gruneisen Growth Corp. The material herein has been obtained from sources believed to be reliable and accurate, however, its accuracy and completeness cannot be guaranteed. Our firm, employees, and customers may effect transactions, including transactions contrary to any recommendation herein, or have positions in the securities mentioned herein or options with respect thereto. Any recommendation contained in this report may not be suitable for all investors and it is not to be deemed an offer or solicitation on our part with respect to the purchase or sale of any securities. |
|
 |
Retail, Biotech, Semiconductor, Financial, and Oil Services Rose
Kenneth J. Gruneisen - Passed the CAN SLIM® Master's Exam
The financial indexes posted small gains on Thursday as the Broker/Dealer Index ($XBD +0.45%) and the Bank Index ($BKX +0.37%) both edged higher. The Retail Index ($RLX +0.77%) also rose. The tech sector was mixed as the Semiconductor Index ($SOX +1.89%) and the Biotechnology Index ($BTK +1.36%) rose and the Networking Index ($NWX -1.09%) fell. Commodity-linked groups were mixed as the Gold & Silver index ($XAU -2.65%) fell and the Integrated Oil Index ($XOI -0.35%) edged lower, meanwhile the Oil Services Index ($OSX +0.98%) rose. Charts courtesy www.stockcharts.com
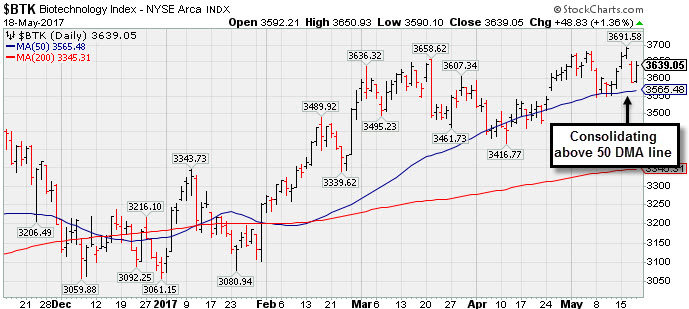 PICTURED: The Biotechnology Index ($BTK +1.36%) is consolidating above its 50-day moving average (DMA) line.
| Oil Services |
$OSX |
148.39 |
+1.45 |
+0.99% |
-19.26% |
| Integrated Oil |
$XOI |
1,147.00 |
-4.06 |
-0.35% |
-9.54% |
| Semiconductor |
$SOX |
1,049.29 |
+19.46 |
+1.89% |
+15.76% |
| Networking |
$NWX |
434.67 |
-4.79 |
-1.09% |
-2.56% |
| Broker/Dealer |
$XBD |
208.64 |
+0.94 |
+0.45% |
+1.64% |
| Retail |
$RLX |
1,500.64 |
+11.43 |
+0.77% |
+11.74% |
| Gold & Silver |
$XAU |
84.25 |
-2.29 |
-2.65% |
+6.83% |
| Bank |
$BKX |
89.24 |
+0.33 |
+0.37% |
-2.78% |
| Biotech |
$BTK |
3,639.05 |
+48.83 |
+1.36% |
+18.34% |
|
|
|
 |
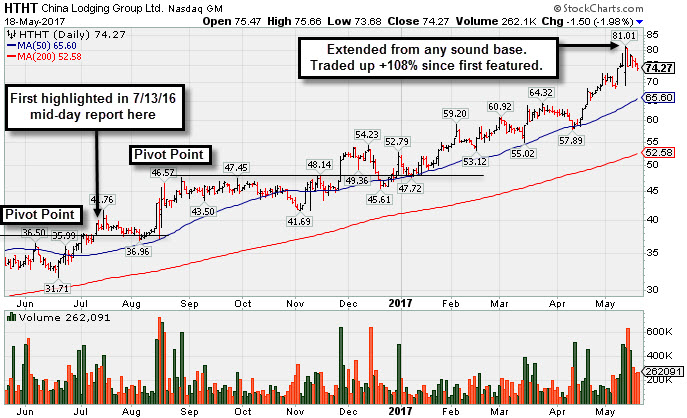
Traded Up 108% in 10 Months Since First Highlighted
Kenneth J. Gruneisen - Passed the CAN SLIM® Master's Exam
China Lodging Group Ads (HTHT -$1.50 or -1.98% to $74.27) is perched near its all-time high, very extended from any sound base. Prior highs in the $64 area and its 50-day moving average (DMA) line define near-term support to watch.
Recently it reported earnings +74% on +4% sales revenues for first quarter ended March 31, 2017, whereas the 2 prior quarterly comparisons (Sep and Dec '16) were below the +25% minimum earnings guideline (C criteria). Its waning sales revenues growth rate was also noted as a fundamental concern. Nonetheless, bullish action has continued after it was last shown in this FSU section on 4/19/17 with an annotated graph under the headline, "Support Shown Promptly After 50-Day Moving Average Violation". HTHT traded up as much as 108% since first featured in yellow in the 7/13/16 mid-day report (read here).
The number of top-rated funds owing its shares rose from 87 in Sep '15 to 160 in Mar '17 a reassuring sign concerning the I criteria. Currently the high-ranked Leisure- Lodging firm has an A Timeliness rating but a D Sponsorship rating. Its small supply of 27 million shares (S criteria) in the public float may contribute to greater price volatility in the event of institutional buying or selling.
|
|
|
Color Codes Explained :
Y - Better candidates highlighted by our
staff of experts.
G - Previously featured
in past reports as yellow but may no longer be buyable under the
guidelines.
***Last / Change / Volume data in this table is the closing quote data***
Symbol/Exchange
Company Name
Industry Group |
PRICE |
CHANGE
(%Change) |
Day High |
Volume
(% DAV)
(% 50 day avg vol) |
52 Wk Hi
% From Hi |
Featured
Date |
Price
Featured |
Pivot Featured |
|
Max Buy |
SBCF
-
NYSE
Seacoast banking Corp
BANKING - Regional - Mid-Atlantic Banks
|
$22.89
|
+0.79
3.57% |
$23.02
|
345,251
421.04% of 50 DAV
50 DAV is 82,000
|
$25.88
-11.55%
|
4/24/2017
|
$25.33
|
PP = $24.38
|
|
MB = $25.60
|
 Most Recent Note - 5/18/2017 1:13:20 PM
G - Managed a "positive reversal" after early losses undercutting the prior low ($21.89 on 3/22/17). A rebound above the 50 DMA line ($23.73) is needed for its outlook to improve.
>>> FEATURED STOCK ARTICLE : Pullback Following Recent Gains With Unimpressive Volume - 4/27/2017 |
View all notes |
Set NEW NOTE alert |
Company Profile |
SEC
News |
Chart |
Request a new note
C
A
S
I |
EW
-
NYSE
Edwards Lifesciences Cp
HEALTH SERVICES - Medical Appliances and Equipment
|
$111.95
|
+0.11
0.10% |
$112.51
|
1,595,479
89.43% of 50 DAV
50 DAV is 1,784,000
|
$121.75
-8.05%
|
5/16/2017
|
$114.12
|
PP = $113.04
|
|
MB = $118.69
|
Most Recent Note - 5/17/2017 5:53:42 PM
Y - Pulled back today with near average volume. Highlighted in yellow in the 5/16/17 mid-day report with a pivot point based on its 4/26/17 high after a cup-with-handle base. See the latest FSU analysis for more details and a new annotated graph.
>>> FEATURED STOCK ARTICLE : Some Overhead Supply Remains For High Ranked Medical Firm - 5/17/2017 |
View all notes |
Set NEW NOTE alert |
Company Profile |
SEC
News |
Chart |
Request a new note
C
A
S
I |
HTHT
-
NASDAQ
China Lodging Group Ads
LEISURE - Lodging
|
$74.27
|
-1.50
-1.98% |
$75.66
|
260,187
125.69% of 50 DAV
50 DAV is 207,000
|
$81.01
-8.32%
|
9/29/2016
|
$46.12
|
PP = $47.82
|
|
MB = $50.21
|
Most Recent Note - 5/18/2017 7:27:05 PM
G - Pulling back from its all-time high after getting very extended from any sound base. Prior highs in the $64 area and its 50 DMA line define near-term support to watch. See the latest FSU analysis for more details and a new annotated graph.
>>> FEATURED STOCK ARTICLE : Traded Up 108% in 10 Months Since First Highlighted - 5/18/2017 |
View all notes |
Set NEW NOTE alert |
Company Profile |
SEC
News |
Chart |
Request a new note
C
A
S
I |
BEAT
-
NASDAQ
BioTelemetry Inc
Medical-Services
|
$27.45
|
-0.55
-1.96% |
$28.10
|
579,939
108.00% of 50 DAV
50 DAV is 537,000
|
$34.00
-19.26%
|
2/14/2017
|
$25.10
|
PP = $24.55
|
|
MB = $25.78
|
Most Recent Note - 5/17/2017 6:07:22 PM
G - Still sputtering below its 50 DMA line ($29.15). The 5/04/17 low $26.50 defines important near-term support to watch. Reported earnings -20% on +15% sales revenues for the Mar '17 quarter versus the year ago period, raising fundamental concerns.
>>> FEATURED STOCK ARTICLE : Extended From Sound Base and Earnings Below +25% Guideline - 5/3/2017 |
View all notes |
Set NEW NOTE alert |
Company Profile |
SEC
News |
Chart |
Request a new note
C
A
S
I |
ULTA
-
NASDAQ
Ulta Beauty Inc
SPECIALTY RETAIL - Specialty Retail, Other
|
$297.82
|
+5.73
1.96% |
$299.70
|
887,805
140.92% of 50 DAV
50 DAV is 630,000
|
$301.40
-1.19%
|
5/5/2017
|
$293.17
|
PP = $289.37
|
|
MB = $303.84
|
Most Recent Note - 5/18/2017 7:25:22 PM
Y - Today's gain was backed by +41% above average, a decent confirming gain while rising above the previously cited pivot point, clinching a technical buy signal. Prior highs near the $289 area define important support above its 50 DMA line ($286).
>>> FEATURED STOCK ARTICLE : Holding Ground After Recent Gains Lacking Great Volume - 5/12/2017 |
View all notes |
Set NEW NOTE alert |
Company Profile |
SEC
News |
Chart |
Request a new note
C
A
S
I |
Symbol/Exchange
Company Name
Industry Group |
PRICE |
CHANGE
(%Change) |
Day High |
Volume
(% DAV)
(% 50 day avg vol) |
52 Wk Hi
% From Hi |
Featured
Date |
Price
Featured |
Pivot Featured |
|
Max Buy |
ESNT
-
NYSE
Essent Group Ltd
Finance-MrtgandRel Svc
|
$36.20
|
-0.35
-0.96% |
$36.96
|
594,734
89.84% of 50 DAV
50 DAV is 662,000
|
$39.50
-8.35%
|
4/4/2017
|
$36.38
|
PP = $36.81
|
|
MB = $38.65
|
Most Recent Note - 5/17/2017 1:44:10 PM
Y - Quietly consolidating near its 50 DMA line ($36.53). Subsequent losses below the prior low ($34.08 on 5/05/17) would raise greater concerns and trigger a worrisome technical sell signal.
>>> FEATURED STOCK ARTICLE : Rebound Above 50-Day Moving Average Helped Outlook - 5/11/2017 |
View all notes |
Set NEW NOTE alert |
Company Profile |
SEC
News |
Chart |
Request a new note
C
A
S
I |
MTSI
-
NASDAQ
Macom Tech Solution Hldg
Elec-Semiconductor Mfg
|
$55.46
|
+1.46
2.70% |
$56.05
|
992,510
150.61% of 50 DAV
50 DAV is 659,000
|
$57.30
-3.21%
|
5/16/2017
|
$52.52
|
PP = $53.89
|
|
MB = $56.58
|
Most Recent Note - 5/17/2017 12:07:24 PM
Y - Pulling back today following a considerable volume-driven gain and technical breakout on the prior session. Finished strong after highlighted in yellow with pivot point cited based on its 12/07/16 high plus 10 cents in the 5/16/17 mid-day report. Fundamentals remain strong through the Mar '17 quarter. Found support at its 200 DMA line and rebounded above the 50 DMA line ($48.66) helping its outlook to improve. It showed resilience since dropped from the Featured Stocks list on 5/03/17. See the latest FSU analysis for more details and an annotated graph.
>>> FEATURED STOCK ARTICLE : Big Breakout Gain With More Than 5 Times Average Volume - 5/16/2017 |
View all notes |
Set NEW NOTE alert |
Company Profile |
SEC
News |
Chart |
Request a new note
C
A
S
I |
VEEV
-
NYSE
Veeva Systems Inc Cl A
Computer Sftwr-Medical
|
$59.54
|
+2.19
3.82% |
$59.69
|
1,670,909
131.26% of 50 DAV
50 DAV is 1,273,000
|
$59.78
-0.39%
|
3/16/2017
|
$49.00
|
PP = $48.05
|
|
MB = $50.45
|
Most Recent Note - 5/17/2017 6:01:39 PM
G - Pulled back from its all-time high today. Very extended from any sound base. Its 50 DMA line ($51.59) defines support above prior highs in the $47-48 area. See the latest FSU analysis for more details and an annotated graph.
>>> FEATURED STOCK ARTICLE : Wedging Into New High Territory, Extended From Sound Base - 5/15/2017 |
View all notes |
Set NEW NOTE alert |
Company Profile |
SEC
News |
Chart |
Request a new note
C
A
S
I |
ANET
-
NYSE
Arista Networks Inc
TELECOMMUNICATIONS - Communication Equipment
|
$143.48
|
+1.12
0.79% |
$143.85
|
803,916
101.50% of 50 DAV
50 DAV is 792,000
|
$148.60
-3.45%
|
4/17/2017
|
$132.75
|
PP = $135.27
|
|
MB = $142.03
|
Most Recent Note - 5/17/2017 6:06:02 PM
G - Pulled back on average volume today, retreating from all-time highs after 6 consecutive gains.Extended from any sound base. Its 50 DMA line ($135) defines near-term support to watch on pullbacks.
>>> FEATURED STOCK ARTICLE : Bullish Technical Action Following Recent Earnings - 5/8/2017 |
View all notes |
Set NEW NOTE alert |
Company Profile |
SEC
News |
Chart |
Request a new note
C
A
S
I |
GRUB
-
NYSE
Grubhub Inc
COMPUTER SOFTWARE and SERVICES - Technical and System Software
|
$44.07
|
+0.71
1.64% |
$44.48
|
2,166,318
91.52% of 50 DAV
50 DAV is 2,367,000
|
$46.84
-5.90%
|
4/28/2017
|
$44.22
|
PP = $44.68
|
|
MB = $46.91
|
Most Recent Note - 5/17/2017 6:09:07 PM
Y - Pulled back below its pivot point with a loss today on higher volume, raising some concerns. A gain backed by at least +40% above average volume and strong close above the pivot point may clinch a technical buy signal.
>>> FEATURED STOCK ARTICLE : Hit New 52-Week High But Ended Near Session Low - 4/28/2017 |
View all notes |
Set NEW NOTE alert |
Company Profile |
SEC
News |
Chart |
Request a new note
C
A
S
I |
Symbol/Exchange
Company Name
Industry Group |
PRICE |
CHANGE
(%Change) |
Day High |
Volume
(% DAV)
(% 50 day avg vol) |
52 Wk Hi
% From Hi |
Featured
Date |
Price
Featured |
Pivot Featured |
|
Max Buy |
IBP
-
NYSE
Installed Building Prod
DIVERSIFIED SERVICES - Business/Management Services
|
$47.10
|
-0.15
-0.32% |
$47.40
|
199,282
135.57% of 50 DAV
50 DAV is 147,000
|
$55.45
-15.06%
|
4/17/2017
|
$51.75
|
PP = $53.10
|
|
MB = $55.76
|
Most Recent Note - 5/18/2017 7:29:00 PM
G - The longer it lingers below its 50-day moving average (DMA) line the worse its outlook gets. Prior highs in the $44 area define the next support level. A rebound above the 50 DMA line ($51.20) is needed for its outlook to improve.
>>> FEATURED STOCK ARTICLE : Due to Report Earnings Prior to Friday's Open - 5/4/2017 |
View all notes |
Set NEW NOTE alert |
Company Profile |
SEC
News |
Chart |
Request a new note
C
A
S
I |
NCOM
-
NASDAQ
National Commerce Corp
BANKING - Regional - Southeast Banks
|
$37.00
|
-0.40
-1.07% |
$37.60
|
19,618
61.31% of 50 DAV
50 DAV is 32,000
|
$40.00
-7.50%
|
4/25/2017
|
$38.95
|
PP = $40.09
|
|
MB = $42.09
|
Most Recent Note - 5/18/2017 7:32:53 PM
G - Color code is changed to green after slumping to a close below its 50 DMA line ($37.37). Prior lows in the $35 area define the next important chart support level to watch. A subsequent rebound above the 50 DMA line gain and rally above the pivot point backed by a minimum of +40% above average volume may trigger a technical buy signal.
>>> FEATURED STOCK ARTICLE : Challenging 52-Week High With Volume-Driven Gains - 4/26/2017 |
View all notes |
Set NEW NOTE alert |
Company Profile |
SEC
News |
Chart |
Request a new note
C
A
S
I |
INGN
-
NASDAQ
Inogen Inc
HEALTH SERVICES - Medical Instruments and Supplies
|
$81.70
|
+0.62
0.76% |
$82.47
|
100,824
58.28% of 50 DAV
50 DAV is 173,000
|
$88.62
-7.80%
|
4/17/2017
|
$76.77
|
PP = $80.04
|
|
MB = $84.04
|
Most Recent Note - 5/18/2017 7:30:22 PM
Y - Consolidating above prior highs in the $79 area defining support along with its 50 DMA line ($78.58). Fundamental remain strong.
>>> FEATURED STOCK ARTICLE : Wedging Higher With Recent Gains Lacking Great Volume - 5/1/2017 |
View all notes |
Set NEW NOTE alert |
Company Profile |
SEC
News |
Chart |
Request a new note
C
A
S
I |
PLAY
-
NASDAQ
Dave & Buster's Ent Inc
Retail-Restaurants
|
$66.70
|
+0.91
1.38% |
$66.99
|
475,764
61.15% of 50 DAV
50 DAV is 778,000
|
$67.38
-1.01%
|
2/23/2017
|
$55.41
|
PP = $58.35
|
|
MB = $61.27
|
Most Recent Note - 5/18/2017 7:35:30 PM
G - Perched near its all-time high, stubbornly holding its ground. Its 50 DMA line ($62.22) defines near-term support to watch on pullbacks. Latest quarter was below the +25% minimum guideline (C criteria), raising fundamental concerns.
>>> FEATURED STOCK ARTICLE : New Record High With Solid Gain on Near Average Volume - 5/2/2017 |
View all notes |
Set NEW NOTE alert |
Company Profile |
SEC
News |
Chart |
Request a new note
C
A
S
I |
OLLI
-
NASDAQ
Ollie's Bargain Outlet
Retail-DiscountandVariety
|
$39.50
|
+0.55
1.41% |
$39.95
|
492,062
77.73% of 50 DAV
50 DAV is 633,000
|
$41.30
-4.36%
|
3/27/2017
|
$32.80
|
PP = $33.55
|
|
MB = $35.23
|
Most Recent Note - 5/18/2017 7:34:11 PM
G - Perched near its all-time high, still very extended from any sound base. Reported earnings +22% on +16% sales revenues for the Jan '17 quarter, below the +25% minimum earnings guideline (C criteria), raising fundamental concerns. Its 50 DMA line ($35.47) defines near-term support to watch.
>>> FEATURED STOCK ARTICLE : Winning Streak Continues for Discount Retailer - 4/24/2017 |
View all notes |
Set NEW NOTE alert |
Company Profile |
SEC
News |
Chart |
Request a new note
C
A
S
I |
Symbol/Exchange
Company Name
Industry Group |
PRICE |
CHANGE
(%Change) |
Day High |
Volume
(% DAV)
(% 50 day avg vol) |
52 Wk Hi
% From Hi |
Featured
Date |
Price
Featured |
Pivot Featured |
|
Max Buy |
MOMO
-
NASDAQ
Momo Inc Ads Cl A
INTERNET - Content
|
$41.41
|
+1.13
2.81% |
$41.95
|
7,785,045
137.76% of 50 DAV
50 DAV is 5,651,000
|
$44.59
-7.13%
|
3/7/2017
|
$29.71
|
PP = $27.83
|
|
MB = $29.22
|
Most Recent Note - 5/17/2017 12:04:28 PM
G - Gapped down today amid widespread market weakness, retreating from a new all-time high following a considerable gain on higher volume. Its 50 DMA line ($36.32) defines important near-term support to watch.
>>> FEATURED STOCK ARTICLE : Hovering Near Record High, Extended From Prior Base - 5/9/2017 |
View all notes |
Set NEW NOTE alert |
Company Profile |
SEC
News |
Chart |
Request a new note
C
A
S
I |
HLI
-
NYSE
Houlihan Lokey Inc Cl A
Finance-Invest Bnk/Bkrs
|
$33.83
|
+0.09
0.27% |
$34.32
|
102,827
43.20% of 50 DAV
50 DAV is 238,000
|
$36.65
-7.69%
|
5/10/2017
|
$35.85
|
PP = $35.05
|
|
MB = $36.80
|
Most Recent Note - 5/17/2017 1:41:18 PM
Y - Pulling back further below its pivot point today raising concerns.Stalled after a "breakaway gap" and considerable gain on 5/10/17 backed by +174% above average volume hitting new all-time highs and triggering a technical buy signal. Its 50 DMA line ($33.49) defines important near-term support.
>>> FEATURED STOCK ARTICLE : Breakaway Gap Followed Strong Earnings News - 5/10/2017 |
View all notes |
Set NEW NOTE alert |
Company Profile |
SEC
News |
Chart |
Request a new note
C
A
S
I |
|
|
|
THESE ARE NOT BUY RECOMMENDATIONS!
Comments contained in the body of this report are technical
opinions only. The material herein has been obtained
from sources believed to be reliable and accurate, however,
its accuracy and completeness cannot be guaranteed.
This site is not an investment advisor, hence it does
not endorse or recommend any securities or other investments.
Any recommendation contained in this report may not
be suitable for all investors and it is not to be deemed
an offer or solicitation on our part with respect to
the purchase or sale of any securities. All trademarks,
service marks and trade names appearing in this report
are the property of their respective owners, and are
likewise used for identification purposes only.
This report is a service available
only to active Paid Premium Members.
You may opt-out of receiving report notifications
at any time. Questions or comments may be submitted
by writing to Premium Membership Services 665 S.E. 10 Street, Suite 201 Deerfield Beach, FL 33441-5634 or by calling 1-800-965-8307
or 954-785-1121.
|
|
|