You are not logged in.
This means you
CAN ONLY VIEW reports that were published prior to Sunday, March 30, 2025.
You
MUST UPGRADE YOUR MEMBERSHIP if you want to see any current reports.
AFTER MARKET UPDATE - WEDNESDAY, MAY 31ST, 2017
Previous After Market Report Next After Market Report >>>
|
|
|
|
DOW |
-20.82 |
21,008.65 |
-0.10% |
|
Volume |
1,449,858,540 |
+88% |
|
Volume |
2,208,820,470 |
+31% |
|
NASDAQ |
-4.67 |
6,198.52 |
-0.08% |
|
Advancers |
1,480 |
50% |
|
Advancers |
1,181 |
52% |
|
S&P 500 |
-1.11 |
2,411.80 |
-0.05% |
|
Decliners |
1,472 |
50% |
|
Decliners |
1,080 |
48% |
|
Russell 2000 |
-0.99 |
1,370.21 |
-0.07% |
|
52 Wk Highs |
171 |
|
|
52 Wk Highs |
141 |
|
|
S&P 600 |
-0.32 |
832.17 |
-0.04% |
|
52 Wk Lows |
98 |
|
|
52 Wk Lows |
111 |
|
|
 |
Nasdaq Composite Index Set the Strongest Pace in May
Kenneth J. Gruneisen - Passed the CAN SLIM® Master's Exam
The Nasdaq Composite ended +2.5% higher for the month of May and the S&P 500 Index rose +1.15%, but the Dow Jones Industrial Average lagged with only a 0.33% gain Stocks finished lower on Wednesday. The Dow was down 20 points to 21008. The S&P 500 slipped a point to 2411 and the Nasdaq Composite fell 4 points to 6198. The volume totals reported were much higher than the prior session totals on the NYSE and on the Nasdaq exchange. Breadth was even on the NYSE and on the Nasdaq exchange. There were 68 high-ranked companies from the Leaders List that made new 52-week highs and were listed on the BreakOuts Page, versus the total of 57 on the prior session. New 52-week highs solidly outnumbered new 52-week lows on the NYSE and on the Nasdaq exchange. PICTURED: The Nasdaq Composite Index touched a new high but reversed and ended with a loss on higher volume.
The major averages (M criteria) are in a confirmed uptrend and there remains a healthy level of market leadership (a large number of high-ranked stocks hitting new highs). New buying efforts should only be made in stocks meeting all fundamental and technical criteria of the fact-based investment system. The Featured Stocks Page lists noteworthy high-ranked leaders.
The major averages declined on the session Wednesday as oil prices retreated and investors digested weaker-than-expected economic data. Pending home sales fell 1.3% in April, below expectations of a 0.5% increase. Separately, Chicago’s purchasing managers index declined to 55.2 in May, from 58.3 last month. In central bank news, the Federal Reserve’s Beige Book release revealed that labor markets continued to tighten and more companies offered higher wages in April through late May.
Seven of 11 sectors in the S&P 500 ended in positive territory. Financials underperformed with big banks leading the losses. JP Morgan Chase (JPM -2.09%) slid after executives said trading revenue is likely to fall in the current quarter from a year ago. In earnings, Michael Kors (KORS -8.52%) fell as comparable-store sales dropped 14.1% in the period. Analog Devices (ADI +1.13%) rose following strong second-quarter results. Elsewhere, Hertz Global (HTZ +8.39%) as the company announced plans to issue $1B in secured bonds to refinance debt. Molina Healthcare (MOH -2.61%) fell after being the subject of negative analyst commentary.
Treasuries advanced with the benchmark 10-year note up 1/32 to yield 2.21%. In commodities, NYMEX WTI crude retreated 2.9% to $48.24/barrel. In FOREX, the Dollar Index fell 0.3%. |
 Kenneth J. Gruneisen started out as a licensed stockbroker in August 1987, a couple of months prior to the historic stock market crash that took the Dow Jones Industrial Average down -22.6% in a single day. He has published daily fact-based fundamental and technical analysis on high-ranked stocks online for two decades. Through FACTBASEDINVESTING.COM, Kenneth provides educational articles, news, market commentary, and other information regarding proven investment systems that work in good times and bad.
Comments contained in the body of this report are technical opinions only and are not necessarily those of Gruneisen Growth Corp. The material herein has been obtained from sources believed to be reliable and accurate, however, its accuracy and completeness cannot be guaranteed. Our firm, employees, and customers may effect transactions, including transactions contrary to any recommendation herein, or have positions in the securities mentioned herein or options with respect thereto. Any recommendation contained in this report may not be suitable for all investors and it is not to be deemed an offer or solicitation on our part with respect to the purchase or sale of any securities. |
|
 |
Biotech Index Led Group Gainers and Bank Index Fell
Kenneth J. Gruneisen - Passed the CAN SLIM® Master's Exam
On Wednesday the Bank Index ($BKX -1.19%) outpaced the Broker/Dealer Index ($XBD -0.37%) to the downside while the Retail Index ($RLX -0.09%) finished flat. The Semiconductor Index ($SOX +0.00%) was unchanged while the Networking Index ($NWX -0.31%) edged lower and the Biotechnology Index ($BTK +0.96%) posted a standout gain. The Integrated Oil Index ($XOI -0.75%) and the Oil Services Index ($OSX -0.26%) ended lower. Charts courtesy www.stockcharts.com
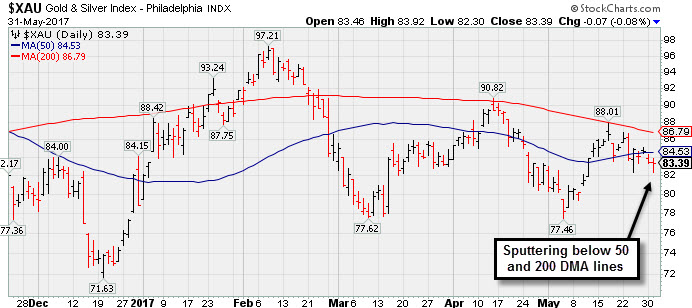 PICTURED: The Gold & Silver index ($XAU -0.08%) ended little changed while sputtering below its 50-day and 200-day moving average (DMA) lines.
| Oil Services |
$OSX |
138.66 |
-0.36 |
-0.26% |
-24.56% |
| Integrated Oil |
$XOI |
1,121.39 |
-8.42 |
-0.75% |
-11.56% |
| Semiconductor |
$SOX |
1,091.42 |
-0.03 |
-0.00% |
+20.40% |
| Networking |
$NWX |
441.06 |
-1.36 |
-0.31% |
-1.13% |
| Broker/Dealer |
$XBD |
210.51 |
-0.79 |
-0.37% |
+2.55% |
| Retail |
$RLX |
1,516.73 |
-1.33 |
-0.09% |
+12.94% |
| Gold & Silver |
$XAU |
83.39 |
-0.06 |
-0.07% |
+5.74% |
| Bank |
$BKX |
88.87 |
-1.07 |
-1.19% |
-3.18% |
| Biotech |
$BTK |
3,541.42 |
+33.78 |
+0.96% |
+15.17% |
|
|
|
 |
Perched at All Time High Following Volume-Driven Gains
Kenneth J. Gruneisen - Passed the CAN SLIM® Master's Exam
Inogen Inc (INGN -$0.25 or -0.28% to $88.64) traded lighter volume today while hovering near its all-time high. No resistance remains due to overhead supply. Disciplined investors avoid chasing extended stocks. Prior highs in the $79 area define support along with its 50-day moving average (DMA) line ($80.60).
Fundamentals remain strong and it has earned the highest possible Earnings Per Share Rating of 99. It reported Mar '17 quarterly earnings +45% on +39% sales revenues. Three of the past four quarterly earnings were above the +25% minimum guideline (C criteria). Its annual earnings (A criteria) history has been very strong since the high ranked Internet Content firm completed a new Public Offering on 9/03/14.
INGN was last shown in this FSU section on 5/01/17 with an annotated graph under the headline, "Wedging Higher With Recent Gains Lacking Great Volume". It was highlighted in yellow with pivot point cited based on its 9/29/16 high plus 10 cents in the 4/28/17 mid-day report (read here).
The number of top-rated funds owning its shares rose from 318 in Jun '16 to 344 in Mar '17, a reassuring sign concerning the I criteria. The current Up/Down Volume Ratio of 1.7 is an unbiased indication its shares have been under accumulation over the past 50 days. It has a fairly small supply of only 20.6 million shares (S criteria) outstanding, which can contribute to greater price volatility in the event of institutional buying or selling.
|
|
|
Color Codes Explained :
Y - Better candidates highlighted by our
staff of experts.
G - Previously featured
in past reports as yellow but may no longer be buyable under the
guidelines.
***Last / Change / Volume data in this table is the closing quote data***
Symbol/Exchange
Company Name
Industry Group |
PRICE |
CHANGE
(%Change) |
Day High |
Volume
(% DAV)
(% 50 day avg vol) |
52 Wk Hi
% From Hi |
Featured
Date |
Price
Featured |
Pivot Featured |
|
Max Buy |
BERY
-
NYSE
Berry Global Group Inc
CONSUMER NON-DURABLES - Packaging and Containers
|
$57.99
|
+0.06
0.10% |
$58.16
|
717,143
57.97% of 50 DAV
50 DAV is 1,237,000
|
$58.65
-1.13%
|
5/26/2017
|
$58.31
|
PP = $57.04
|
|
MB = $59.89
|
Most Recent Note - 5/26/2017 5:57:24 PM
Y - Finished near the session high after highlighted in yellow in the mid-day report with a new pivot point cited based on its 5/10/17 high plus 10 cents. Volume was +32% above average while rising from an advanced "3-weeks tight" base. It rebounded and rallied to new highs after dropped from the Featured Stocks list on 3/24/17. Reported earnings +36% on +12% sales revenues for the Mar '17 quarter, and fundamentals remain strong. See the latest FSU analysis for more details and a new annotated graph.
>>> FEATURED STOCK ARTICLE : Rising From Advanced Base With Above Average Volume - 5/26/2017 |
View all notes |
Set NEW NOTE alert |
Company Profile |
SEC
News |
Chart |
Request a new note
C
A
S
I |
EW
-
NYSE
Edwards Lifesciences Cp
HEALTH SERVICES - Medical Appliances and Equipment
|
$115.07
|
+0.47
0.41% |
$116.59
|
1,139,198
72.19% of 50 DAV
50 DAV is 1,578,000
|
$121.75
-5.49%
|
5/16/2017
|
$114.12
|
PP = $113.04
|
|
MB = $118.69
|
Most Recent Note - 5/30/2017 1:04:53 PM
Y - Holding its ground stubbornly with volume totals cooling since highlighted in yellow in the 5/16/17 mid-day report with a pivot point based on its 4/26/17 high after a cup-with-handle base.
>>> FEATURED STOCK ARTICLE : Some Overhead Supply Remains For High Ranked Medical Firm - 5/17/2017 |
View all notes |
Set NEW NOTE alert |
Company Profile |
SEC
News |
Chart |
Request a new note
C
A
S
I |
STMP
-
NASDAQ
Stamps.com Inc
INTERNET - Internet Software and Services
|
$137.90
|
+2.55
1.88% |
$138.30
|
572,887
77.63% of 50 DAV
50 DAV is 738,000
|
$145.23
-5.05%
|
5/24/2017
|
$133.10
|
PP = $136.10
|
|
MB = $142.91
|
Most Recent Note - 5/30/2017 5:54:07 PM
Y - There was a "negative reversal" today after hitting a new 52-week high. Triggered a technical buy signal with a gain above the pivot point on 5/25/17 backed by +68% above average volume.
>>> FEATURED STOCK ARTICLE : Rallying From Bottom of 13-Week Cup Shaped Base - 5/24/2017 |
View all notes |
Set NEW NOTE alert |
Company Profile |
SEC
News |
Chart |
Request a new note
C
A
S
I |
HTHT
-
NASDAQ
China Lodging Group Ads
LEISURE - Lodging
|
$76.40
|
-1.36
-1.75% |
$78.44
|
137,306
66.98% of 50 DAV
50 DAV is 205,000
|
$81.01
-5.69%
|
9/29/2016
|
$46.12
|
PP = $47.82
|
|
MB = $50.21
|
 Most Recent Note - 5/31/2017 5:56:13 PM
G - Hovering near its all-time high, very extended from any sound base. Its 50 DMA line ($68.45) defines near-term support to watch.
>>> FEATURED STOCK ARTICLE : Traded Up 108% in 10 Months Since First Highlighted - 5/18/2017 |
View all notes |
Set NEW NOTE alert |
Company Profile |
SEC
News |
Chart |
Request a new note
C
A
S
I |
BEAT
-
NASDAQ
BioTelemetry Inc
Medical-Services
|
$28.85
|
+0.10
0.35% |
$28.95
|
469,091
86.39% of 50 DAV
50 DAV is 543,000
|
$34.00
-15.15%
|
2/14/2017
|
$25.10
|
PP = $24.55
|
|
MB = $25.78
|
Most Recent Note - 5/31/2017 5:54:42 PM
G - Met resistance at its 50 DMA line recently. Prior lows in the $26.50 - $27.00 area define the next level of support. Gains above the 50 DMA line ($29.41) are needed for its outlook to improve. Reported earnings -20% on +15% sales revenues for the Mar '17 quarter versus the year ago period, raising fundamental concerns.
>>> FEATURED STOCK ARTICLE : Extended From Sound Base and Earnings Below +25% Guideline - 5/3/2017 |
View all notes |
Set NEW NOTE alert |
Company Profile |
SEC
News |
Chart |
Request a new note
C
A
S
I |
Symbol/Exchange
Company Name
Industry Group |
PRICE |
CHANGE
(%Change) |
Day High |
Volume
(% DAV)
(% 50 day avg vol) |
52 Wk Hi
% From Hi |
Featured
Date |
Price
Featured |
Pivot Featured |
|
Max Buy |
ULTA
-
NASDAQ
Ulta Beauty Inc
SPECIALTY RETAIL - Specialty Retail, Other
|
$304.84
|
+1.84
0.61% |
$304.97
|
595,111
93.13% of 50 DAV
50 DAV is 639,000
|
$310.00
-1.66%
|
5/5/2017
|
$293.17
|
PP = $289.37
|
|
MB = $303.84
|
Most Recent Note - 5/26/2017 1:47:33 PM
Y - Reported Apr '17 quarterly earnings +41% on +22% sales revenues. Gapped up today for a 2nd consecutive volume-driven gain and hit a new all-time high. Volume and volatility often increase near earnings news. Its Relative Strength rank is currently 76, still below the 80+ minimum guideline for buy candidates.
>>> FEATURED STOCK ARTICLE : Holding Ground After Recent Gains Lacking Great Volume - 5/12/2017 |
View all notes |
Set NEW NOTE alert |
Company Profile |
SEC
News |
Chart |
Request a new note
C
A
S
I |
ESNT
-
NYSE
Essent Group Ltd
Finance-MrtgandRel Svc
|
$36.27
|
+0.04
0.11% |
$36.58
|
359,441
56.78% of 50 DAV
50 DAV is 633,000
|
$39.50
-8.18%
|
4/4/2017
|
$36.38
|
PP = $36.81
|
|
MB = $38.65
|
Most Recent Note - 5/30/2017 1:03:37 PM
G - Still consolidating near its 50 DMA line ($36.63). Subsequent losses below the prior low ($34.08 on 5/05/17) would raise greater concerns and trigger a worrisome technical sell signal.
>>> FEATURED STOCK ARTICLE : Rebound Above 50-Day Moving Average Helped Outlook - 5/11/2017 |
View all notes |
Set NEW NOTE alert |
Company Profile |
SEC
News |
Chart |
Request a new note
C
A
S
I |
MTSI
-
NASDAQ
Macom Tech Solution Hldg
Elec-Semiconductor Mfg
|
$60.97
|
+0.04
0.07% |
$61.67
|
1,013,556
125.91% of 50 DAV
50 DAV is 805,000
|
$61.70
-1.18%
|
5/16/2017
|
$52.52
|
PP = $53.89
|
|
MB = $56.58
|
Most Recent Note - 5/31/2017 6:02:13 PM
G - Posted a small gain for a new high close today. Stubbornly held its ground following considerable volume-driven gains, and it is extended from any sound base. Prior highs in the $54-55 area define initial support to watch on pullbacks.
>>> FEATURED STOCK ARTICLE : Big Breakout Gain With More Than 5 Times Average Volume - 5/16/2017 |
View all notes |
Set NEW NOTE alert |
Company Profile |
SEC
News |
Chart |
Request a new note
C
A
S
I |
VEEV
-
NYSE
Veeva Systems Inc Cl A
Computer Sftwr-Medical
|
$63.54
|
-1.36
-2.10% |
$65.94
|
6,248,216
426.21% of 50 DAV
50 DAV is 1,466,000
|
$67.86
-6.37%
|
3/16/2017
|
$49.00
|
PP = $48.05
|
|
MB = $50.45
|
Most Recent Note - 5/31/2017 5:49:19 PM
G - Pulled back from its all-time high with heavier and above average volume behind its 2nd consecutive loss. Its 50 DMA line ($54.32) defines near-term support to watch.
>>> FEATURED STOCK ARTICLE : Wedging Into New High Territory, Extended From Sound Base - 5/15/2017 |
View all notes |
Set NEW NOTE alert |
Company Profile |
SEC
News |
Chart |
Request a new note
C
A
S
I |
ANET
-
NYSE
Arista Networks Inc
TELECOMMUNICATIONS - Communication Equipment
|
$147.38
|
+0.16
0.11% |
$148.04
|
2,598,432
344.16% of 50 DAV
50 DAV is 755,000
|
$148.60
-0.82%
|
4/17/2017
|
$132.75
|
PP = $135.27
|
|
MB = $142.03
|
Most Recent Note - 5/31/2017 5:51:41 PM
G - Posted a small gain with heavy volume today, churning while very extended from any sound base. Its 50 DMA line ($138.56) and prior lows define near-term support to watch.
>>> FEATURED STOCK ARTICLE : Bullish Technical Action Following Recent Earnings - 5/8/2017 |
View all notes |
Set NEW NOTE alert |
Company Profile |
SEC
News |
Chart |
Request a new note
C
A
S
I |
Symbol/Exchange
Company Name
Industry Group |
PRICE |
CHANGE
(%Change) |
Day High |
Volume
(% DAV)
(% 50 day avg vol) |
52 Wk Hi
% From Hi |
Featured
Date |
Price
Featured |
Pivot Featured |
|
Max Buy |
GRUB
-
NYSE
Grubhub Inc
COMPUTER SOFTWARE and SERVICES - Technical and System Software
|
$43.47
|
-0.02
-0.05% |
$43.87
|
1,353,341
56.13% of 50 DAV
50 DAV is 2,411,000
|
$46.84
-7.18%
|
4/28/2017
|
$44.22
|
PP = $44.68
|
|
MB = $46.91
|
Most Recent Note - 5/26/2017 5:58:31 PM
Y - Posted a solid gain today with higher (near average) volume. A confirming gain backed by at least +40% above average volume and strong close above the pivot point may clinch a technical buy signal.
>>> FEATURED STOCK ARTICLE : Stalled After Reaching New Highs and Encountered Mild Pressure - 5/22/2017 |
View all notes |
Set NEW NOTE alert |
Company Profile |
SEC
News |
Chart |
Request a new note
C
A
S
I |
IBP
-
NYSE
Installed Building Prod
DIVERSIFIED SERVICES - Business/Management Services
|
$49.60
|
+0.45
0.92% |
$49.60
|
127,416
94.38% of 50 DAV
50 DAV is 135,000
|
$55.45
-10.55%
|
4/17/2017
|
$51.75
|
PP = $53.10
|
|
MB = $55.76
|
Most Recent Note - 5/31/2017 5:57:47 PM
G - Consolidating above the recent low ($46.65 on 5/09/17) defining near-term support. A rebound above the 50 DMA line ($50.90) is needed for its outlook to improve.
>>> FEATURED STOCK ARTICLE : Due to Report Earnings Prior to Friday's Open - 5/4/2017 |
View all notes |
Set NEW NOTE alert |
Company Profile |
SEC
News |
Chart |
Request a new note
C
A
S
I |
NCOM
-
NASDAQ
National Commerce Corp
BANKING - Regional - Southeast Banks
|
$37.35
|
+0.00
0.00% |
$37.70
|
8,624
30.80% of 50 DAV
50 DAV is 28,000
|
$40.00
-6.63%
|
4/25/2017
|
$38.95
|
PP = $40.09
|
|
MB = $42.09
|
Most Recent Note - 5/30/2017 5:37:15 PM
Y - Quietly consolidating near its 50 DMA line ($37.53). Prior lows in the $35 area define the next important chart support level to watch. See the latest FSU analysis for more details and a new annotated graph.
>>> FEATURED STOCK ARTICLE : Sputtering Near 50-Day Moving Average After Stalling - 5/30/2017 |
View all notes |
Set NEW NOTE alert |
Company Profile |
SEC
News |
Chart |
Request a new note
C
A
S
I |
INGN
-
NASDAQ
Inogen Inc
HEALTH SERVICES - Medical Instruments and Supplies
|
$88.64
|
-0.25
-0.28% |
$89.66
|
148,859
91.89% of 50 DAV
50 DAV is 162,000
|
$89.54
-1.01%
|
4/17/2017
|
$76.77
|
PP = $80.04
|
|
MB = $84.04
|
Most Recent Note - 5/31/2017 5:46:58 PM
G - Holding its ground perched at its all-time high. Prior highs in the $79 area define support along with its 50 DMA line ($80.60). Fundamentals remain strong. See the latest FSU analysis for more details and a new annotated graph.
>>> FEATURED STOCK ARTICLE : Perched at All Time High Following Volume-Driven Gains - 5/31/2017 |
View all notes |
Set NEW NOTE alert |
Company Profile |
SEC
News |
Chart |
Request a new note
C
A
S
I |
PLAY
-
NASDAQ
Dave & Buster's Ent Inc
Retail-Restaurants
|
$66.70
|
+0.72
1.09% |
$66.72
|
545,312
75.32% of 50 DAV
50 DAV is 724,000
|
$68.25
-2.27%
|
2/23/2017
|
$55.41
|
PP = $58.35
|
|
MB = $61.27
|
Most Recent Note - 5/31/2017 6:00:31 PM
G - Still hovering near its all-time high, stubbornly holding its ground. Its 50 DMA line ($63.31) defines near-term support to watch on pullbacks. Jan '17 quarterly earnings were below the +25% minimum guideline (C criteria), raising fundamental concerns.
>>> FEATURED STOCK ARTICLE : New Record High With Solid Gain on Near Average Volume - 5/2/2017 |
View all notes |
Set NEW NOTE alert |
Company Profile |
SEC
News |
Chart |
Request a new note
C
A
S
I |
Symbol/Exchange
Company Name
Industry Group |
PRICE |
CHANGE
(%Change) |
Day High |
Volume
(% DAV)
(% 50 day avg vol) |
52 Wk Hi
% From Hi |
Featured
Date |
Price
Featured |
Pivot Featured |
|
Max Buy |
OLLI
-
NASDAQ
Ollie's Bargain Outlet
Retail-DiscountandVariety
|
$41.15
|
+0.05
0.12% |
$41.43
|
980,852
149.98% of 50 DAV
50 DAV is 654,000
|
$42.60
-3.40%
|
3/27/2017
|
$32.80
|
PP = $33.55
|
|
MB = $35.23
|
Most Recent Note - 5/31/2017 5:59:42 PM
G - Perched near its all-time high, very extended from any sound base. Recent low ($37.60 on 5/16/17) defines near-term support above its 50 DMA line. Reported Apr '17 quarterly earnings +25% on +17% sales revenues, meeting the +25% minimum earnings guideline (C criteria).
>>> FEATURED STOCK ARTICLE : Retailer Rallied +25% in 2 Months Since Featured - 5/19/2017 |
View all notes |
Set NEW NOTE alert |
Company Profile |
SEC
News |
Chart |
Request a new note
C
A
S
I |
MOMO
-
NASDAQ
Momo Inc Ads Cl A
INTERNET - Content
|
$38.04
|
+0.85
2.29% |
$38.47
|
18,007,530
285.97% of 50 DAV
50 DAV is 6,297,000
|
$45.95
-17.21%
|
3/7/2017
|
$29.71
|
PP = $27.83
|
|
MB = $29.22
|
Most Recent Note - 5/31/2017 5:53:04 PM
G - Found prompt support near its 50 DMA line ($37.56) and posted a gain today with higher volume. Prior low ($35.55 on 4/26/17) defines the next important chart support level where a violation would raise more serious concerns.
>>> FEATURED STOCK ARTICLE : Hovering Near Record High, Extended From Prior Base - 5/9/2017 |
View all notes |
Set NEW NOTE alert |
Company Profile |
SEC
News |
Chart |
Request a new note
C
A
S
I |
HLI
-
NYSE
Houlihan Lokey Inc Cl A
Finance-Invest Bnk/Bkrs
|
$33.57
|
+0.22
0.66% |
$33.58
|
167,123
75.62% of 50 DAV
50 DAV is 221,000
|
$36.65
-8.40%
|
5/10/2017
|
$35.85
|
PP = $35.05
|
|
MB = $36.80
|
Most Recent Note - 5/30/2017 1:06:18 PM
Y - Quietly consolidating near its 50 DMA line ($33.66). More damaging losses would raise concerns and trigger a technical sell signal.
>>> FEATURED STOCK ARTICLE : Breakaway Gap Followed Strong Earnings News - 5/10/2017 |
View all notes |
Set NEW NOTE alert |
Company Profile |
SEC
News |
Chart |
Request a new note
C
A
S
I |
|
|
|
THESE ARE NOT BUY RECOMMENDATIONS!
Comments contained in the body of this report are technical
opinions only. The material herein has been obtained
from sources believed to be reliable and accurate, however,
its accuracy and completeness cannot be guaranteed.
This site is not an investment advisor, hence it does
not endorse or recommend any securities or other investments.
Any recommendation contained in this report may not
be suitable for all investors and it is not to be deemed
an offer or solicitation on our part with respect to
the purchase or sale of any securities. All trademarks,
service marks and trade names appearing in this report
are the property of their respective owners, and are
likewise used for identification purposes only.
This report is a service available
only to active Paid Premium Members.
You may opt-out of receiving report notifications
at any time. Questions or comments may be submitted
by writing to Premium Membership Services 665 S.E. 10 Street, Suite 201 Deerfield Beach, FL 33441-5634 or by calling 1-800-965-8307
or 954-785-1121.
|
|
|


