You are not logged in.
This means you
CAN ONLY VIEW reports that were published prior to Thursday, March 20, 2025.
You
MUST UPGRADE YOUR MEMBERSHIP if you want to see any current reports.
AFTER MARKET UPDATE - WEDNESDAY, MAY 24TH, 2017
Previous After Market Report Next After Market Report >>>
|
|
|
|
DOW |
+74.51 |
21,012.42 |
+0.36% |
|
Volume |
947,892,820 |
+4% |
|
Volume |
1,516,765,250 |
-3% |
|
NASDAQ |
+24.31 |
6,163.02 |
+0.40% |
|
Advancers |
1,645 |
57% |
|
Advancers |
1,441 |
52% |
|
S&P 500 |
+5.97 |
2,404.39 |
+0.25% |
|
Decliners |
1,260 |
43% |
|
Decliners |
1,352 |
48% |
|
Russell 2000 |
+1.53 |
1,382.51 |
+0.11% |
|
52 Wk Highs |
125 |
|
|
52 Wk Highs |
129 |
|
|
S&P 600 |
+0.44 |
836.96 |
+0.05% |
|
52 Wk Lows |
35 |
|
|
52 Wk Lows |
66 |
|
|
 |
Benchmark S&P 500 Index Closed at a New Record High
Kenneth J. Gruneisen - Passed the CAN SLIM® Master's Exam
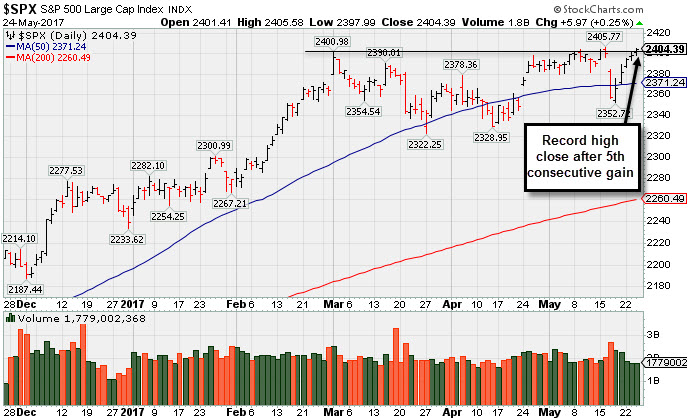
Stocks finished higher on Wednesday. The Dow was up 74 points to 21012. The S&P 500 added 6 points to 2404 and the Nasdaq Composite gained 24 points to 6163. The volume totals reported were mixed, higher than the prior session total on the NYSE and lighter on the Nasdaq exchange. Advancers led decliners by a 4-3 margin on the NYSE and by a very narrow margin on the Nasdaq exchange. There were 48 high-ranked companies from the Leaders List that made new 52-week highs and were listed on the BreakOuts Page, matching the total of 48 on the prior session. New 52-week highs totals solidly outnumbered new 52-week lows on the NYSE and on the Nasdaq exchange. PICTURED: The S&P 500 Index ended at a new record high close after a 5th consecutive gain.
The major averages (M criteria) saw their uptrend come under recent pressure, however there remains a healthy level of market leadership (a large number of high-ranked stocks hitting new highs). New buying efforts should only be made in stocks meeting all fundamental and technical criteria of the fact-based investment system. The Featured Stocks Page lists noteworthy high-ranked leaders.
The S&P 500 climbed to a record high on Wednesday as investors applauded the Federal Reserve’s plan to gradually reduce its massive $4.5 trillion balance sheet. In the system, the central bank will announce cap limits on how much it will allow to roll off each month without reinvesting. On the data front, existing home sales fell 2.3% in April, below analysts’ estimates. Overseas, Chinese equities edged higher despite Moody’s reducing the credit rating for China for the first time since 1989.
Eight of 11 sectors in the S&P 500 ended in positive territory. Technology stocks outperformed with Facebook (FB +1.33%) edging higher. Intuit (INTU +6.72%) gapped up to a record high as the financial software company provided upbeat guidance for the current quarter. In earnings, Lowe’s Companies (LOW -3%) gapped down after the home improvement retailer missed estimates on the top and bottom lines. Tiffany & Co (TIF -8.71%) gapped down as same-store sales posted an unexpected decline this quarter. In Financials, T Rowe Price (TROW -3.35%) fell after being the subject of negative analyst commentary.
Treasuries advanced with the benchmark 10-year note up 8/32 to yield 2.25%. In commodities, NYMEX WTI crude lost 0.3% to $51.33/barrel. In FOREX, the Dollar Index fell 0.2%. |
 Kenneth J. Gruneisen started out as a licensed stockbroker in August 1987, a couple of months prior to the historic stock market crash that took the Dow Jones Industrial Average down -22.6% in a single day. He has published daily fact-based fundamental and technical analysis on high-ranked stocks online for two decades. Through FACTBASEDINVESTING.COM, Kenneth provides educational articles, news, market commentary, and other information regarding proven investment systems that work in good times and bad.
Comments contained in the body of this report are technical opinions only and are not necessarily those of Gruneisen Growth Corp. The material herein has been obtained from sources believed to be reliable and accurate, however, its accuracy and completeness cannot be guaranteed. Our firm, employees, and customers may effect transactions, including transactions contrary to any recommendation herein, or have positions in the securities mentioned herein or options with respect thereto. Any recommendation contained in this report may not be suitable for all investors and it is not to be deemed an offer or solicitation on our part with respect to the purchase or sale of any securities. |
|
 |
Gold & Silver Index and Semiconductor Index Rose
Kenneth J. Gruneisen - Passed the CAN SLIM® Master's Exam
On Wednesday the Bank Index ($BKX -0.31%) and the Broker/Dealer Index ($XBD -0.16%) both edged lower and the Retail Index ($RLX -0.07%) finished flat. The Semiconductor Index ($SOX +0.65%) led the tech sector, meanwhile the Networking Index ($NWX -0.01%) and the Biotechnology Index ($BTK -0.09%) both finished flat . The Gold & Silver index ($XAU +1.20%) rose, meanwhile the Oil Services Index ($OSX -1.28%) outpaced the Integrated Oil Index ($XOI -0.21%) to the downside. Charts courtesy www.stockcharts.com
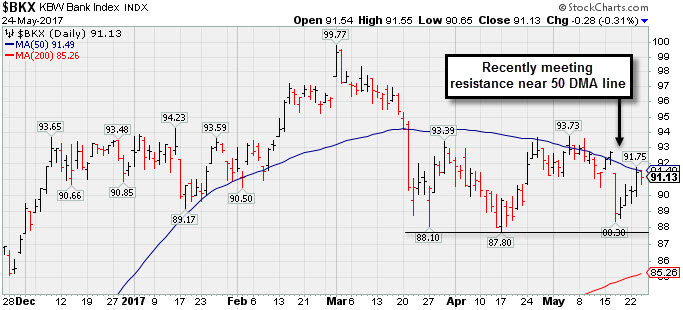 PICTURED: The Bank Index ($BKX -0.31%) recently has met resistance at its 50-day moving average (DMA) line. Improvement would help, but subsequent losses below the prior lows would badly hurt the broader market outlook, because the financial groups have proven to be reliable leading indicators.
| Oil Services |
$OSX |
149.75 |
-1.94 |
-1.28% |
-18.52% |
| Integrated Oil |
$XOI |
1,160.00 |
-2.42 |
-0.21% |
-8.52% |
| Semiconductor |
$SOX |
1,074.85 |
+6.91 |
+0.65% |
+18.58% |
| Networking |
$NWX |
440.03 |
-0.03 |
-0.01% |
-1.36% |
| Broker/Dealer |
$XBD |
211.52 |
-0.34 |
-0.16% |
+3.04% |
| Retail |
$RLX |
1,497.58 |
-1.09 |
-0.07% |
+11.51% |
| Gold & Silver |
$XAU |
84.86 |
+1.01 |
+1.20% |
+7.61% |
| Bank |
$BKX |
91.13 |
-0.28 |
-0.31% |
-0.72% |
| Biotech |
$BTK |
3,625.57 |
+3.17 |
+0.09% |
+17.90% |
|
|
|
 |
Rallying From Bottom of 13-Week Cup Shaped Base
Kenneth J. Gruneisen - Passed the CAN SLIM® Master's Exam
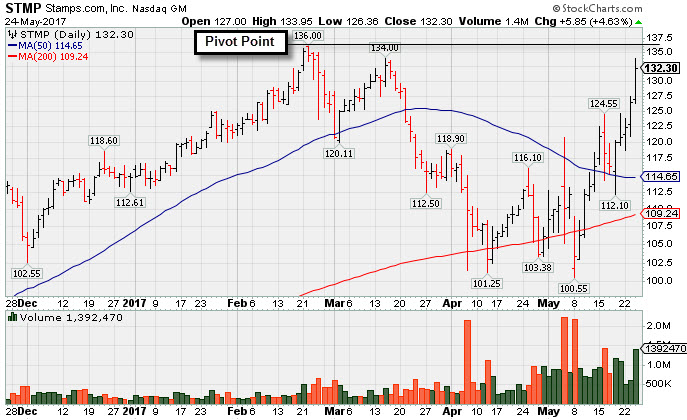
Stamps.Com Inc (STMP +$5.85 or +4.63% to $132.30) was highlighted in yellow in the earlier mid-day report while rallying near prior highs. A new pivot point was cited based on its 2/22/17 high plus 10 cents. It is rallying from the bottom of a 13-week cup shaped base. Subsequent volume-driven gains for new highs may trigger a technical buy signal. Fundamentals have remained strong through the Mar '17 quarter. It found support near its 200-day moving average (DMA) line after dropped from the Featured Stocks list on 3/29/17.
STMP was last shown in this FSU section with an annotated graph on 3/24/17 under the headline, "Technical Deterioration Noted After 50-Day Moving Average Violation". It reported earnings +62% on +28% sales revenues for the Mar '17 quarter, continuing its strong growth track record. It has earned an Earnings Per Share Rating of 99, putting it in the top 1% of all publicly traded stocks based on its earnings history over the past 5 years. Currently it has a Timeliness Rating of A and a Sponsorship rating of C.
The Retail - Internet group has a 95 Relative Strength Rating.The number of top-rated funds owning its shares rose from 354 in Dec '16 to 370 in Mar '17, a reassuring sign in recent months concerning the I criteria. Its small supply of only 16.9 million shares outstanding (S criteria) can contribute to greater price volatility in the event of institutional buying or selling. |
|
|
Color Codes Explained :
Y - Better candidates highlighted by our
staff of experts.
G - Previously featured
in past reports as yellow but may no longer be buyable under the
guidelines.
***Last / Change / Volume data in this table is the closing quote data***
Symbol/Exchange
Company Name
Industry Group |
PRICE |
CHANGE
(%Change) |
Day High |
Volume
(% DAV)
(% 50 day avg vol) |
52 Wk Hi
% From Hi |
Featured
Date |
Price
Featured |
Pivot Featured |
|
Max Buy |
SBCF
-
NASDAQ
Seacoast Banking Corp Fl
BANKING - Regional - Mid-Atlantic Banks
|
$22.92
|
-0.31
-1.33% |
$23.28
|
190,231
57.30% of 50 DAV
50 DAV is 332,000
|
$25.88
-11.44%
|
4/24/2017
|
$25.33
|
PP = $24.38
|
|
MB = $25.60
|
 Most Recent Note - 5/24/2017 6:29:10 PM
G - A rebound above the 50 DMA line ($23.69) is needed for its outlook to improve. Subsequent losses below the prior low ($21.65 on 5/18/17) would raise more serious concerns.
>>> FEATURED STOCK ARTICLE : Pullback Following Recent Gains With Unimpressive Volume - 4/27/2017 |
View all notes |
Set NEW NOTE alert |
Company Profile |
SEC
News |
Chart |
Request a new note
C
A
S
I |
EW
-
NYSE
Edwards Lifesciences Cp
HEALTH SERVICES - Medical Appliances and Equipment
|
$114.19
|
+0.65
0.57% |
$114.30
|
887,139
53.44% of 50 DAV
50 DAV is 1,660,000
|
$121.75
-6.21%
|
5/16/2017
|
$114.12
|
PP = $113.04
|
|
MB = $118.69
|
Most Recent Note - 5/22/2017 5:48:40 PM
Y - Posted a 3rd consecutive small gain with below average volume. Highlighted in yellow in the 5/16/17 mid-day report with a pivot point based on its 4/26/17 high after a cup-with-handle base.
>>> FEATURED STOCK ARTICLE : Some Overhead Supply Remains For High Ranked Medical Firm - 5/17/2017 |
View all notes |
Set NEW NOTE alert |
Company Profile |
SEC
News |
Chart |
Request a new note
C
A
S
I |
STMP
-
NASDAQ
Stamps.com Inc
INTERNET - Internet Software and Services
|
$132.30
|
+5.85
4.63% |
$133.95
|
1,392,364
203.26% of 50 DAV
50 DAV is 685,000
|
$136.00
-2.72%
|
5/24/2017
|
$133.10
|
PP = $136.10
|
|
MB = $142.91
|
Most Recent Note - 5/24/2017 6:26:36 PM
Y - Finished strong today after highlighted in yellow while rallying toward prior highs. A new pivot point was cited based on its 2/22/17 high plus 10 cents. Subsequent volume-driven gains for new highs may trigger a technical buy signal. Fundamentals have remained strong through the Mar '17 quarter. Found support near its 200 DMA line after dropped from the Featured Stocks list on 3/29/17. See the latest FSU analysis for more details and a new annotated graph.
>>> FEATURED STOCK ARTICLE : Rallying From Bottom of 13-Week Cup Shaped Base - 5/24/2017 |
View all notes |
Set NEW NOTE alert |
Company Profile |
SEC
News |
Chart |
Request a new note
C
A
S
I |
HTHT
-
NASDAQ
China Lodging Group Ads
LEISURE - Lodging
|
$76.35
|
+0.51
0.67% |
$77.16
|
111,895
51.80% of 50 DAV
50 DAV is 216,000
|
$81.01
-5.75%
|
9/29/2016
|
$46.12
|
PP = $47.82
|
|
MB = $50.21
|
Most Recent Note - 5/24/2017 6:30:59 PM
G - It remains very extended from any sound base. Its 50 DMA line ($67) defines near-term support to watch above prior highs in the $64 area.
>>> FEATURED STOCK ARTICLE : Traded Up 108% in 10 Months Since First Highlighted - 5/18/2017 |
View all notes |
Set NEW NOTE alert |
Company Profile |
SEC
News |
Chart |
Request a new note
C
A
S
I |
DY
-
NYSE
Dycom Inds Inc
MATERIALS and CONSTRUCTION - Heavy Construction
|
$88.97
|
-19.08
-17.66% |
$94.26
|
6,799,774
1,243.10% of 50 DAV
50 DAV is 547,000
|
$110.64
-19.59%
|
5/23/2017
|
$109.25
|
PP = $110.07
|
|
MB = $115.57
|
Most Recent Note - 5/24/2017 10:05:30 AM
G - Reported earnings +20% on +18% sales revenues for the Apr '17 quarter, below the +25% minimum guideline (C criteria). Volume and volatility often increase near earnings news. Gapped down today violating its 50 DMA line, triggering a technical sell signal, and its color code is changed to green. See the latest FSU analysis for more details and an annotated graph.
>>> FEATURED STOCK ARTICLE : In Tight Range Near All-Time High With Earnings News Due - 5/23/2017 |
View all notes |
Set NEW NOTE alert |
Company Profile |
SEC
News |
Chart |
Request a new note
C
A
S
I |
Symbol/Exchange
Company Name
Industry Group |
PRICE |
CHANGE
(%Change) |
Day High |
Volume
(% DAV)
(% 50 day avg vol) |
52 Wk Hi
% From Hi |
Featured
Date |
Price
Featured |
Pivot Featured |
|
Max Buy |
BEAT
-
NASDAQ
BioTelemetry Inc
Medical-Services
|
$27.95
|
-0.90
-3.12% |
$28.65
|
597,429
111.46% of 50 DAV
50 DAV is 536,000
|
$34.00
-17.79%
|
2/14/2017
|
$25.10
|
PP = $24.55
|
|
MB = $25.78
|
Most Recent Note - 5/24/2017 10:49:26 AM
G - Met resistance at its 50 DMA line recently and today it is slumping toward prior lows in the $26.50 - $27.00 area defining the next level of support. Gains above the 50 DMA line are needed for its outlook to improve. Reported earnings -20% on +15% sales revenues for the Mar '17 quarter versus the year ago period, raising fundamental concerns.
>>> FEATURED STOCK ARTICLE : Extended From Sound Base and Earnings Below +25% Guideline - 5/3/2017 |
View all notes |
Set NEW NOTE alert |
Company Profile |
SEC
News |
Chart |
Request a new note
C
A
S
I |
ULTA
-
NYSE
Ulta Beauty Inc
SPECIALTY RETAIL - Specialty Retail, Other
|
$280.51
|
-10.04
-3.46% |
$290.98
|
2,023,560
382.38% of 50 DAV
50 DAV is 529,200
|
$301.40
-6.93%
|
5/5/2017
|
$293.17
|
PP = $289.37
|
|
MB = $303.84
|
Most Recent Note - 5/24/2017 12:49:59 PM
G - Color code was changed to green while slumping below prior highs and violating its 50 DMA line ($286.65), action indicative of distributional pressure. Its Relative Strength rank slumped to 77, below the 80+ minimum guideline for buy candidates. Due to report Apr '17 quarterly results tomorrow. Volume and volatility often increase near earnings news.
>>> FEATURED STOCK ARTICLE : Holding Ground After Recent Gains Lacking Great Volume - 5/12/2017 |
View all notes |
Set NEW NOTE alert |
Company Profile |
SEC
News |
Chart |
Request a new note
C
A
S
I |
ESNT
-
NYSE
Essent Group Ltd
Finance-MrtgandRel Svc
|
$36.57
|
+0.01
0.03% |
$36.82
|
241,892
36.65% of 50 DAV
50 DAV is 660,000
|
$39.50
-7.42%
|
4/4/2017
|
$36.38
|
PP = $36.81
|
|
MB = $38.65
|
Most Recent Note - 5/22/2017 5:47:20 PM
G - Color code is changed to green while consolidating below its 50 DMA line ($36.59). Subsequent losses below the prior low ($34.08 on 5/05/17) would raise greater concerns and trigger a worrisome technical sell signal. A rebound above the 50 DMA line is needed fro its outlook to improve.
>>> FEATURED STOCK ARTICLE : Rebound Above 50-Day Moving Average Helped Outlook - 5/11/2017 |
View all notes |
Set NEW NOTE alert |
Company Profile |
SEC
News |
Chart |
Request a new note
C
A
S
I |
MTSI
-
NASDAQ
Macom Tech Solution Hldg
Elec-Semiconductor Mfg
|
$60.08
|
+0.73
1.23% |
$61.16
|
1,065,126
142.97% of 50 DAV
50 DAV is 745,000
|
$61.45
-2.23%
|
5/16/2017
|
$52.52
|
PP = $53.89
|
|
MB = $56.58
|
Most Recent Note - 5/24/2017 11:05:13 AM
G - Perched near all-time highs following considerable volume-driven gains, extended from any sound base. Prior highs in the $54-55 area define initial support to watch on pullbacks. Fundamentals remain strong through the Mar '17 quarter.
>>> FEATURED STOCK ARTICLE : Big Breakout Gain With More Than 5 Times Average Volume - 5/16/2017 |
View all notes |
Set NEW NOTE alert |
Company Profile |
SEC
News |
Chart |
Request a new note
C
A
S
I |
VEEV
-
NYSE
Veeva Systems Inc Cl A
Computer Sftwr-Medical
|
$61.07
|
+0.58
0.96% |
$61.42
|
2,254,992
171.09% of 50 DAV
50 DAV is 1,318,000
|
$62.64
-2.51%
|
3/16/2017
|
$49.00
|
PP = $48.05
|
|
MB = $50.45
|
Most Recent Note - 5/22/2017 5:50:28 PM
G - Very extended from any sound base and hitting yet another new all-time high with above average volume behind today's 3rd consecutive gain. Its 50 DMA line ($52.54) defines support above prior highs in the $47-48 area.
>>> FEATURED STOCK ARTICLE : Wedging Into New High Territory, Extended From Sound Base - 5/15/2017 |
View all notes |
Set NEW NOTE alert |
Company Profile |
SEC
News |
Chart |
Request a new note
C
A
S
I |
Symbol/Exchange
Company Name
Industry Group |
PRICE |
CHANGE
(%Change) |
Day High |
Volume
(% DAV)
(% 50 day avg vol) |
52 Wk Hi
% From Hi |
Featured
Date |
Price
Featured |
Pivot Featured |
|
Max Buy |
ANET
-
NYSE
Arista Networks Inc
TELECOMMUNICATIONS - Communication Equipment
|
$144.28
|
+1.08
0.75% |
$144.33
|
402,230
51.77% of 50 DAV
50 DAV is 777,000
|
$148.60
-2.91%
|
4/17/2017
|
$132.75
|
PP = $135.27
|
|
MB = $142.03
|
Most Recent Note - 5/22/2017 5:45:30 PM
G - It remains extended from any sound base, consolidating above its 50 DMA line ($136.40) which defines near-term support to watch.
>>> FEATURED STOCK ARTICLE : Bullish Technical Action Following Recent Earnings - 5/8/2017 |
View all notes |
Set NEW NOTE alert |
Company Profile |
SEC
News |
Chart |
Request a new note
C
A
S
I |
GRUB
-
NYSE
Grubhub Inc
COMPUTER SOFTWARE and SERVICES - Technical and System Software
|
$42.83
|
+0.10
0.23% |
$43.19
|
2,034,386
86.20% of 50 DAV
50 DAV is 2,360,000
|
$46.84
-8.55%
|
4/28/2017
|
$44.22
|
PP = $44.68
|
|
MB = $46.91
|
Most Recent Note - 5/22/2017 5:41:55 PM
Y - Recently stalled after hitting a new high and encountered mild distributional pressure. A confirming gain backed by at least +40% above average volume and strong close above the pivot point may clinch a technical buy signal. See the latest FSU analysis for more details and a new annotated graph.
>>> FEATURED STOCK ARTICLE : Stalled After Reaching New Highs and Encountered Mild Pressure - 5/22/2017 |
View all notes |
Set NEW NOTE alert |
Company Profile |
SEC
News |
Chart |
Request a new note
C
A
S
I |
IBP
-
NYSE
Installed Building Prod
DIVERSIFIED SERVICES - Business/Management Services
|
$48.75
|
+0.25
0.52% |
$48.90
|
79,556
54.12% of 50 DAV
50 DAV is 147,000
|
$55.45
-12.08%
|
4/17/2017
|
$51.75
|
PP = $53.10
|
|
MB = $55.76
|
Most Recent Note - 5/24/2017 6:31:54 PM
G - Quietly consolidating near the recent low ($46.65 on 5/09/17). Prior highs in the $44 area define the next support level. A rebound above the 50 DMA line ($51.12) is needed for its outlook to improve.
>>> FEATURED STOCK ARTICLE : Due to Report Earnings Prior to Friday's Open - 5/4/2017 |
View all notes |
Set NEW NOTE alert |
Company Profile |
SEC
News |
Chart |
Request a new note
C
A
S
I |
NCOM
-
NASDAQ
National Commerce Corp
BANKING - Regional - Southeast Banks
|
$37.80
|
-0.10
-0.26% |
$37.95
|
13,368
44.56% of 50 DAV
50 DAV is 30,000
|
$40.00
-5.50%
|
4/25/2017
|
$38.95
|
PP = $40.09
|
|
MB = $42.09
|
Most Recent Note - 5/24/2017 10:58:51 AM
Y - Found support while consolidating near its 50 DMA line ($37.47) and its color code is changed to yellow. Prior lows in the $35 area define the next important chart support level to watch. Subsequent gains above the pivot point backed by a minimum of +40% above average volume may trigger a technical buy signal.
>>> FEATURED STOCK ARTICLE : Challenging 52-Week High With Volume-Driven Gains - 4/26/2017 |
View all notes |
Set NEW NOTE alert |
Company Profile |
SEC
News |
Chart |
Request a new note
C
A
S
I |
INGN
-
NASDAQ
Inogen Inc
HEALTH SERVICES - Medical Instruments and Supplies
|
$86.76
|
+1.49
1.75% |
$87.44
|
263,284
157.66% of 50 DAV
50 DAV is 167,000
|
$88.62
-2.09%
|
4/17/2017
|
$76.77
|
PP = $80.04
|
|
MB = $84.04
|
Most Recent Note - 5/24/2017 12:42:50 PM
G - Color code was changed to green after rallying above its "max buy" level. Prior highs in the $79 area define support along with its 50 DMA line ($79.56). Fundamentals remain strong.
>>> FEATURED STOCK ARTICLE : Wedging Higher With Recent Gains Lacking Great Volume - 5/1/2017 |
View all notes |
Set NEW NOTE alert |
Company Profile |
SEC
News |
Chart |
Request a new note
C
A
S
I |
Symbol/Exchange
Company Name
Industry Group |
PRICE |
CHANGE
(%Change) |
Day High |
Volume
(% DAV)
(% 50 day avg vol) |
52 Wk Hi
% From Hi |
Featured
Date |
Price
Featured |
Pivot Featured |
|
Max Buy |
PLAY
-
NASDAQ
Dave & Buster's Ent Inc
Retail-Restaurants
|
$66.82
|
+1.73
2.66% |
$67.13
|
494,133
66.24% of 50 DAV
50 DAV is 746,000
|
$67.83
-1.49%
|
2/23/2017
|
$55.41
|
PP = $58.35
|
|
MB = $61.27
|
Most Recent Note - 5/24/2017 11:03:18 AM
G - Hovering near its all-time high, stubbornly holding its ground. Its 50 DMA line ($62.79) defines near-term support to watch on pullbacks. Jan '17 quarterly earnings were below the +25% minimum guideline (C criteria), raising fundamental concerns.
>>> FEATURED STOCK ARTICLE : New Record High With Solid Gain on Near Average Volume - 5/2/2017 |
View all notes |
Set NEW NOTE alert |
Company Profile |
SEC
News |
Chart |
Request a new note
C
A
S
I |
OLLI
-
NASDAQ
Ollie's Bargain Outlet
Retail-DiscountandVariety
|
$40.90
|
-0.20
-0.49% |
$41.25
|
500,849
78.01% of 50 DAV
50 DAV is 642,000
|
$41.35
-1.09%
|
3/27/2017
|
$32.80
|
PP = $33.55
|
|
MB = $35.23
|
Most Recent Note - 5/24/2017 11:02:01 AM
G - Perched at its all-time high, very extended from any sound base. Recent low ($37.60 on 5/16/17) defines near-term support above its 50 DMA line. Due to report Apr '17 quarterly results on 5/31/17.
>>> FEATURED STOCK ARTICLE : Retailer Rallied +25% in 2 Months Since Featured - 5/19/2017 |
View all notes |
Set NEW NOTE alert |
Company Profile |
SEC
News |
Chart |
Request a new note
C
A
S
I |
MOMO
-
NASDAQ
Momo Inc Ads Cl A
INTERNET - Content
|
$38.64
|
-2.43
-5.92% |
$41.78
|
13,325,085
228.76% of 50 DAV
50 DAV is 5,825,000
|
$45.95
-15.91%
|
3/7/2017
|
$29.71
|
PP = $27.83
|
|
MB = $29.22
|
Most Recent Note - 5/24/2017 12:44:14 PM
G - Extended from any sound base, and its 50 DMA line ($37.27) defines important near-term support to watch. Following a "negative reversal" on 5/22/17 at its all-time high it endured more distributional pressure.
>>> FEATURED STOCK ARTICLE : Hovering Near Record High, Extended From Prior Base - 5/9/2017 |
View all notes |
Set NEW NOTE alert |
Company Profile |
SEC
News |
Chart |
Request a new note
C
A
S
I |
HLI
-
NYSE
Houlihan Lokey Inc Cl A
Finance-Invest Bnk/Bkrs
|
$33.54
|
-0.21
-0.62% |
$33.78
|
190,819
82.61% of 50 DAV
50 DAV is 231,000
|
$36.65
-8.49%
|
5/10/2017
|
$35.85
|
PP = $35.05
|
|
MB = $36.80
|
Most Recent Note - 5/22/2017 5:43:50 PM
Y - Quietly consolidating above its 50 DMA line ($33.58) defining important near-term support. A subsequent violation would raise concerns and trigger a technical sell signal.
>>> FEATURED STOCK ARTICLE : Breakaway Gap Followed Strong Earnings News - 5/10/2017 |
View all notes |
Set NEW NOTE alert |
Company Profile |
SEC
News |
Chart |
Request a new note
C
A
S
I |
|
|
|
THESE ARE NOT BUY RECOMMENDATIONS!
Comments contained in the body of this report are technical
opinions only. The material herein has been obtained
from sources believed to be reliable and accurate, however,
its accuracy and completeness cannot be guaranteed.
This site is not an investment advisor, hence it does
not endorse or recommend any securities or other investments.
Any recommendation contained in this report may not
be suitable for all investors and it is not to be deemed
an offer or solicitation on our part with respect to
the purchase or sale of any securities. All trademarks,
service marks and trade names appearing in this report
are the property of their respective owners, and are
likewise used for identification purposes only.
This report is a service available
only to active Paid Premium Members.
You may opt-out of receiving report notifications
at any time. Questions or comments may be submitted
by writing to Premium Membership Services 665 S.E. 10 Street, Suite 201 Deerfield Beach, FL 33441-5634 or by calling 1-800-965-8307
or 954-785-1121.
|
|
|