You are not logged in.
This means you
CAN ONLY VIEW reports that were published prior to Wednesday, April 9, 2025.
You
MUST UPGRADE YOUR MEMBERSHIP if you want to see any current reports.
AFTER MARKET UPDATE - WEDNESDAY, MAY 17TH, 2017
Previous After Market Report Next After Market Report >>>
|
|
|
|
DOW |
-372.82 |
20,606.93 |
-1.78% |
|
Volume |
1,164,411,440 |
+23% |
|
Volume |
2,137,417,060 |
+18% |
|
NASDAQ |
-158.63 |
6,011.24 |
-2.57% |
|
Advancers |
604 |
20% |
|
Advancers |
443 |
15% |
|
S&P 500 |
-43.64 |
2,357.03 |
-1.82% |
|
Decliners |
2,367 |
80% |
|
Decliners |
2,453 |
85% |
|
Russell 2000 |
-38.79 |
1,355.89 |
-2.78% |
|
52 Wk Highs |
45 |
|
|
52 Wk Highs |
34 |
|
|
S&P 600 |
-21.72 |
822.16 |
-2.57% |
|
52 Wk Lows |
84 |
|
|
52 Wk Lows |
91 |
|
|
 |
Major Indices Suffered Damaging Losses
Kenneth J. Gruneisen - Passed the CAN SLIM® Master's Exam
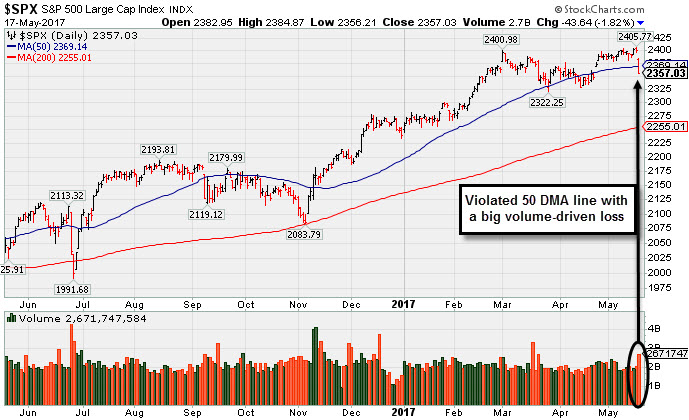
Stocks retreated on Wednesday. The Dow tumbled 372 points to 20607, and the S&P 500 lost 43 points to 2357, both violating their respective 50-day moving average lines. The Nasdaq Composite fell 158 points to 6011. The volume totals reported were clearly higher than the prior session totals on the NYSE and on the Nasdaq exchange, a sign of increasing institutional selling pressure. Breadth was negative as decliners led advancers by more than 5-1 on the Nasdaq exchange and nearly 4-1 on the NYSE. Leadership abruptly contracted as there were only 8 high-ranked companies from the Leaders List that made new 52-week highs and were listed on the BreakOuts Page, versus the total of 76 on the prior session. New 52-week lows totals swelled and solidly outnumbered new 52-week highs on the NYSE and on the Nasdaq exchange. PICTURED: The S&P 500 Index abruptly violated its 50-day moving average (DMA) line with a big loss on heavier volume.
The major averages (M criteria) saw their uptrend come under greater pressure on Wednesday, meanwhile, there was clearly less market leadership (number of high-ranked stocks hitting new highs). If market conditions continue to deteriorate, disciplined investors will reduce exposure and raise cash levels in their portfolios by selling stocks showing signs of deterioration on a case-by-case basis. The Featured Stocks Page lists noteworthy high-ranked leaders.
Global equities sold-off on the session Wednesday while perceived "safe haven" assets rallied higher as turmoil in Washington has investors questioning the Trump administration’s ability to deliver on its policy agenda. On Tuesday, a report surfaced that President Trump asked former FBI Director James Comey to end an investigation of ex-National Security Advisor Michael Flynn, prompting some congressional members to call for further investigation.
Treasuries finished firmly higher with the benchmark 10-year note up 30/32 to yield 2.22%. The 30-year bond jumped one point and 23/32 to yield 2.91%. In FOREX, the U.S. dollar declined for a sixth-straight session, including a 1.9% drop against the Japanese yen. Conversely, gold gained 1.9% on the COMEX for its fifth-straight daily advance.
Nine of 11 sectors in the S&P 500 ended in negative territory with Financials leading the losses. Big banks experienced a headwind with Bank of America (BAC -5.92%) and Goldman Sachs (GS -5.29%) sliding. The traditionally defensive Utilities and Real Estate sectors finished as the only two sectors in the green. In stock news, Target (TGT +0.94%) edged higher as the retailer beat estimates on the top and bottom lines.
Trading volume on the S&P 500 was 41% above its 30-day moving average. The CBOE Volatility Index (VIX) spiked 40.2% to 14.93. |
 Kenneth J. Gruneisen started out as a licensed stockbroker in August 1987, a couple of months prior to the historic stock market crash that took the Dow Jones Industrial Average down -22.6% in a single day. He has published daily fact-based fundamental and technical analysis on high-ranked stocks online for two decades. Through FACTBASEDINVESTING.COM, Kenneth provides educational articles, news, market commentary, and other information regarding proven investment systems that work in good times and bad.
Comments contained in the body of this report are technical opinions only and are not necessarily those of Gruneisen Growth Corp. The material herein has been obtained from sources believed to be reliable and accurate, however, its accuracy and completeness cannot be guaranteed. Our firm, employees, and customers may effect transactions, including transactions contrary to any recommendation herein, or have positions in the securities mentioned herein or options with respect thereto. Any recommendation contained in this report may not be suitable for all investors and it is not to be deemed an offer or solicitation on our part with respect to the purchase or sale of any securities. |
|
 |
Financial, Tech, Retail, and Energy-Linked Groups Fell
Kenneth J. Gruneisen - Passed the CAN SLIM® Master's Exam
The financial indexes suffered large losses and weighed on the major averages on Wednesday as the Broker/Dealer Index ($XBD -4.24%) and the Bank Index ($BKX -4.08%) both ended the session more than -4% lower. The Retail Index ($RLX -1.64%) fell. The tech sector also had a negative bias as the Semiconductor Index ($SOX -4.37%) set the pace to the downside, followed by the Biotechnology Index ($BTK -2.70%) and the Networking Index ($NWX -2.26%). Commodity-linked groups were mixed as the Gold & Silver index ($XAU +0.88%) was slightly higher, but the Integrated Oil Index ($XOI -1.16%) and the Oil Services Index ($OSX -2.01%) both ended lower. Charts courtesy www.stockcharts.com
 PICTURED: The Gold & Silver index ($XAU +0.88%) rallied amid widespread weakness on Wednesday. It challenged its 200-day moving average (DMA) line which recently acted as resistance.
| Oil Services |
$OSX |
146.94 |
-3.02 |
-2.01% |
-20.05% |
| Integrated Oil |
$XOI |
1,151.06 |
-13.53 |
-1.16% |
-9.22% |
| Semiconductor |
$SOX |
1,029.83 |
-47.02 |
-4.37% |
+13.61% |
| Networking |
$NWX |
439.46 |
-10.18 |
-2.26% |
-1.49% |
| Broker/Dealer |
$XBD |
207.70 |
-9.21 |
-4.24% |
+1.18% |
| Retail |
$RLX |
1,489.21 |
-24.87 |
-1.64% |
+10.89% |
| Gold & Silver |
$XAU |
86.54 |
+0.76 |
+0.89% |
+9.74% |
| Bank |
$BKX |
88.91 |
-3.78 |
-4.08% |
-3.14% |
| Biotech |
$BTK |
3,590.22 |
-99.78 |
-2.70% |
+16.75% |
|
|
|
 |
Some Overhead Supply Remains For High Ranked Medical Firm
Kenneth J. Gruneisen - Passed the CAN SLIM® Master's Exam
Edwards Lifesciences Cp (EW -$1.81 or -1.59% to $111.84) pulled back today with lighter than average volume. It was highlighted in yellow in the 5/16/17 mid-day report with pivot point cited based on its high after a cup-with-handle base (read here). A gain backed by +76% above average volume triggered a technical buy signal on Tuesday, but it ended near the bottom of its intra-day range, a sign that it was encountering some distributional pressure. Additional confirming gains with above average volume would be a reassuring sign. Meanwhile, it is -8.1% off its all-time high and still faces some resistance due to overhead supply up tho the $121 level.
EW reported earnings +32% on +27% sales revenues for the Mar '17 quarter. Three of the past 4 quarterly comparisons had earnings above the +25% minimum guideline (C criteria) and its annual earnings growth (A criteria) is a good match with the fact-based investment system's fundamental guidelines.
The Medical - Products firm has seen the number of top-rated funds owning its shares rise from 1496 in Jun '16 to 1,558 in Mar '17, a sign of institutional buying demand (I criteria). Its current Up/Down Volume Ratio of 2.3 is an unbiased indication its shares have been under accumulation over the past 50 days. It has an A Timeliness Rating and a B Sponsorship rating. |
|
|
Color Codes Explained :
Y - Better candidates highlighted by our
staff of experts.
G - Previously featured
in past reports as yellow but may no longer be buyable under the
guidelines.
***Last / Change / Volume data in this table is the closing quote data***
Symbol/Exchange
Company Name
Industry Group |
PRICE |
CHANGE
(%Change) |
Day High |
Volume
(% DAV)
(% 50 day avg vol) |
52 Wk Hi
% From Hi |
Featured
Date |
Price
Featured |
Pivot Featured |
|
Max Buy |
SBCF
-
NASDAQ
Seacoast Banking Corp Fl
BANKING - Regional - Mid-Atlantic Banks
|
$22.10
|
-1.40
-5.96% |
$23.08
|
530,800
161.83% of 50 DAV
50 DAV is 328,000
|
$25.88
-14.61%
|
4/24/2017
|
$25.33
|
PP = $24.38
|
|
MB = $25.60
|
 Most Recent Note - 5/17/2017 1:34:58 PM
G - Gapped down today amid widespread market weakness. Prior low ($21.89 on 3/22/17) defines important support where a violation would raise more serious concerns and trigger a worrisome technical sell signal. A rebound above the 50 DMA line ($23.75) is needed for its outlook to improve.
>>> FEATURED STOCK ARTICLE : Pullback Following Recent Gains With Unimpressive Volume - 4/27/2017 |
View all notes |
Set NEW NOTE alert |
Company Profile |
SEC
News |
Chart |
Request a new note
C
A
S
I |
CSFL
-
NASDAQ
Centerstate Banks Inc
Banks-Southeast
|
$24.38
|
-0.80
-3.18% |
$24.83
|
520,560
159.19% of 50 DAV
50 DAV is 327,000
|
$26.94
-9.49%
|
3/13/2017
|
$25.54
|
PP = $26.40
|
|
MB = $27.72
|
Most Recent Note - 5/17/2017 6:13:43 PM
Met resistance at its 50 DMA line ($25.23) and slumped today with higher volume. Damaging losses below its recent low ($23.64 on 4/17/17) would raise more serious concerns. Fundamental concerns were raised as it recently reported earnings +10% on +13% sales revenues for the Mar '17 quarter, below the +25% minimum earnings guideline.It will be dropped from the Featured Stocks list tonight.
>>> FEATURED STOCK ARTICLE : Positive Reversal After Intra-day Low Undercut Prior Lows - 4/17/2017 |
View all notes |
Set NEW NOTE alert |
Company Profile |
SEC
News |
Chart |
Request a new note
C
A
S
I |
EW
-
NYSE
Edwards Lifesciences Cp
HEALTH SERVICES - Medical Appliances and Equipment
|
$111.84
|
-1.81
-1.59% |
$114.40
|
1,661,678
91.96% of 50 DAV
50 DAV is 1,807,000
|
$121.75
-8.14%
|
5/16/2017
|
$114.12
|
PP = $113.04
|
|
MB = $118.69
|
Most Recent Note - 5/17/2017 5:53:42 PM
Y - Pulled back today with near average volume. Highlighted in yellow in the 5/16/17 mid-day report with a pivot point based on its 4/26/17 high after a cup-with-handle base. See the latest FSU analysis for more details and a new annotated graph.
>>> FEATURED STOCK ARTICLE : Some Overhead Supply Remains For High Ranked Medical Firm - 5/17/2017 |
View all notes |
Set NEW NOTE alert |
Company Profile |
SEC
News |
Chart |
Request a new note
C
A
S
I |
HTHT
-
NASDAQ
China Lodging Group Ads
LEISURE - Lodging
|
$75.77
|
-0.98
-1.28% |
$77.24
|
253,546
124.90% of 50 DAV
50 DAV is 203,000
|
$81.01
-6.47%
|
9/29/2016
|
$46.12
|
PP = $47.82
|
|
MB = $50.21
|
Most Recent Note - 5/16/2017 1:27:27 PM
G - Still perched near its all-time high, very extended from any sound base. Prior highs in the $64 area and its 50 DMA line define near term support to watch. Reported earnings +74% on +4% sales revenues for first quarter ended March 31, 2017.
>>> FEATURED STOCK ARTICLE : Support Shown Promptly After 50-Day Moving Average Violation - 4/19/2017 |
View all notes |
Set NEW NOTE alert |
Company Profile |
SEC
News |
Chart |
Request a new note
C
A
S
I |
BEAT
-
NASDAQ
BioTelemetry Inc
Medical-Services
|
$28.00
|
-0.85
-2.95% |
$28.75
|
542,727
102.40% of 50 DAV
50 DAV is 530,000
|
$34.00
-17.65%
|
2/14/2017
|
$25.10
|
PP = $24.55
|
|
MB = $25.78
|
Most Recent Note - 5/17/2017 6:07:22 PM
G - Still sputtering below its 50 DMA line ($29.15). The 5/04/17 low $26.50 defines important near-term support to watch. Reported earnings -20% on +15% sales revenues for the Mar '17 quarter versus the year ago period, raising fundamental concerns.
>>> FEATURED STOCK ARTICLE : Extended From Sound Base and Earnings Below +25% Guideline - 5/3/2017 |
View all notes |
Set NEW NOTE alert |
Company Profile |
SEC
News |
Chart |
Request a new note
C
A
S
I |
Symbol/Exchange
Company Name
Industry Group |
PRICE |
CHANGE
(%Change) |
Day High |
Volume
(% DAV)
(% 50 day avg vol) |
52 Wk Hi
% From Hi |
Featured
Date |
Price
Featured |
Pivot Featured |
|
Max Buy |
ULTA
-
NASDAQ
Ulta Beauty Inc
SPECIALTY RETAIL - Specialty Retail, Other
|
$292.09
|
-1.24
-0.42% |
$293.20
|
751,565
115.98% of 50 DAV
50 DAV is 648,000
|
$301.40
-3.09%
|
5/5/2017
|
$293.17
|
PP = $289.37
|
|
MB = $303.84
|
Most Recent Note - 5/12/2017 6:19:07 PM
Y - Volume totals have been cooling while stubbornly holding its ground near all-time highs. Recent gains lacked great volume while rising above the new pivot point cited based on its 3/17/17 high plus 10 cents. Prior highs near the $289 area define important support above its 50 DMA line ($284.51). See the latest FSU analysis for more details and a new annotated graph.
>>> FEATURED STOCK ARTICLE : Holding Ground After Recent Gains Lacking Great Volume - 5/12/2017 |
View all notes |
Set NEW NOTE alert |
Company Profile |
SEC
News |
Chart |
Request a new note
C
A
S
I |
ESNT
-
NYSE
Essent Group Ltd
Finance-MrtgandRel Svc
|
$36.55
|
-0.66
-1.77% |
$36.98
|
536,566
80.32% of 50 DAV
50 DAV is 668,000
|
$39.50
-7.47%
|
4/4/2017
|
$36.38
|
PP = $36.81
|
|
MB = $38.65
|
Most Recent Note - 5/17/2017 1:44:10 PM
Y - Quietly consolidating near its 50 DMA line ($36.53). Subsequent losses below the prior low ($34.08 on 5/05/17) would raise greater concerns and trigger a worrisome technical sell signal.
>>> FEATURED STOCK ARTICLE : Rebound Above 50-Day Moving Average Helped Outlook - 5/11/2017 |
View all notes |
Set NEW NOTE alert |
Company Profile |
SEC
News |
Chart |
Request a new note
C
A
S
I |
MTSI
-
NASDAQ
Macom Tech Solution Hldg
Elec-Semiconductor Mfg
|
$54.00
|
-3.00
-5.26% |
$57.10
|
2,317,312
375.58% of 50 DAV
50 DAV is 617,000
|
$57.30
-5.76%
|
5/16/2017
|
$52.52
|
PP = $53.89
|
|
MB = $56.58
|
Most Recent Note - 5/17/2017 12:07:24 PM
Y - Pulling back today following a considerable volume-driven gain and technical breakout on the prior session. Finished strong after highlighted in yellow with pivot point cited based on its 12/07/16 high plus 10 cents in the 5/16/17 mid-day report. Fundamentals remain strong through the Mar '17 quarter. Found support at its 200 DMA line and rebounded above the 50 DMA line ($48.66) helping its outlook to improve. It showed resilience since dropped from the Featured Stocks list on 5/03/17. See the latest FSU analysis for more details and an annotated graph.
>>> FEATURED STOCK ARTICLE : Big Breakout Gain With More Than 5 Times Average Volume - 5/16/2017 |
View all notes |
Set NEW NOTE alert |
Company Profile |
SEC
News |
Chart |
Request a new note
C
A
S
I |
VEEV
-
NYSE
Veeva Systems Inc Cl A
Computer Sftwr-Medical
|
$57.35
|
-1.74
-2.94% |
$58.55
|
2,153,019
172.79% of 50 DAV
50 DAV is 1,246,000
|
$59.78
-4.06%
|
3/16/2017
|
$49.00
|
PP = $48.05
|
|
MB = $50.45
|
Most Recent Note - 5/17/2017 6:01:39 PM
G - Pulled back from its all-time high today. Very extended from any sound base. Its 50 DMA line ($51.59) defines support above prior highs in the $47-48 area. See the latest FSU analysis for more details and an annotated graph.
>>> FEATURED STOCK ARTICLE : Wedging Into New High Territory, Extended From Sound Base - 5/15/2017 |
View all notes |
Set NEW NOTE alert |
Company Profile |
SEC
News |
Chart |
Request a new note
C
A
S
I |
ANET
-
NYSE
Arista Networks Inc
TELECOMMUNICATIONS - Communication Equipment
|
$142.36
|
-5.09
-3.45% |
$146.87
|
897,039
113.26% of 50 DAV
50 DAV is 792,000
|
$148.60
-4.20%
|
4/17/2017
|
$132.75
|
PP = $135.27
|
|
MB = $142.03
|
Most Recent Note - 5/17/2017 6:06:02 PM
G - Pulled back on average volume today, retreating from all-time highs after 6 consecutive gains.Extended from any sound base. Its 50 DMA line ($135) defines near-term support to watch on pullbacks.
>>> FEATURED STOCK ARTICLE : Bullish Technical Action Following Recent Earnings - 5/8/2017 |
View all notes |
Set NEW NOTE alert |
Company Profile |
SEC
News |
Chart |
Request a new note
C
A
S
I |
Symbol/Exchange
Company Name
Industry Group |
PRICE |
CHANGE
(%Change) |
Day High |
Volume
(% DAV)
(% 50 day avg vol) |
52 Wk Hi
% From Hi |
Featured
Date |
Price
Featured |
Pivot Featured |
|
Max Buy |
GRUB
-
NYSE
Grubhub Inc
COMPUTER SOFTWARE and SERVICES - Technical and System Software
|
$43.36
|
-1.29
-2.89% |
$44.40
|
2,659,546
112.69% of 50 DAV
50 DAV is 2,360,000
|
$46.84
-7.42%
|
4/28/2017
|
$44.22
|
PP = $44.68
|
|
MB = $46.91
|
Most Recent Note - 5/17/2017 6:09:07 PM
Y - Pulled back below its pivot point with a loss today on higher volume, raising some concerns. A gain backed by at least +40% above average volume and strong close above the pivot point may clinch a technical buy signal.
>>> FEATURED STOCK ARTICLE : Hit New 52-Week High But Ended Near Session Low - 4/28/2017 |
View all notes |
Set NEW NOTE alert |
Company Profile |
SEC
News |
Chart |
Request a new note
C
A
S
I |
IBP
-
NYSE
Installed Building Prod
DIVERSIFIED SERVICES - Business/Management Services
|
$47.25
|
-1.20
-2.48% |
$48.35
|
189,887
130.96% of 50 DAV
50 DAV is 145,000
|
$55.45
-14.79%
|
4/17/2017
|
$51.75
|
PP = $53.10
|
|
MB = $55.76
|
Most Recent Note - 5/12/2017 2:28:15 PM
G - Failing to rebound after recently violating its 50-day moving average (DMA) line. Prior highs in the $44 area define the next support level. A rebound above the 50 DMA line ($51.32) is needed for its outlook to improve.
>>> FEATURED STOCK ARTICLE : Due to Report Earnings Prior to Friday's Open - 5/4/2017 |
View all notes |
Set NEW NOTE alert |
Company Profile |
SEC
News |
Chart |
Request a new note
C
A
S
I |
NCOM
-
NASDAQ
National Commerce Corp
BANKING - Regional - Southeast Banks
|
$37.40
|
-1.10
-2.86% |
$38.45
|
29,118
90.99% of 50 DAV
50 DAV is 32,000
|
$40.00
-6.50%
|
4/25/2017
|
$38.95
|
PP = $40.09
|
|
MB = $42.09
|
Most Recent Note - 5/12/2017 2:22:05 PM
Y - Pulling back near its 50 DMA line ($37.33) defining near-term support. Volume totals have been cooling while consolidating within close striking distance of its 52-week high. A gain above the pivot point backed by a minimum of +40% above average volume may trigger a technical buy signal.
>>> FEATURED STOCK ARTICLE : Challenging 52-Week High With Volume-Driven Gains - 4/26/2017 |
View all notes |
Set NEW NOTE alert |
Company Profile |
SEC
News |
Chart |
Request a new note
C
A
S
I |
INGN
-
NASDAQ
Inogen Inc
HEALTH SERVICES - Medical Instruments and Supplies
|
$81.08
|
-1.18
-1.43% |
$81.97
|
129,551
74.88% of 50 DAV
50 DAV is 173,000
|
$88.62
-8.50%
|
4/17/2017
|
$76.77
|
PP = $80.04
|
|
MB = $84.04
|
Most Recent Note - 5/15/2017 7:50:41 PM
Y - Consolidating near all-time highs following a volume-driven gain on 5/10/17. Prior highs in the $79 area define support along with its 50 DMA line ($77.94).
>>> FEATURED STOCK ARTICLE : Wedging Higher With Recent Gains Lacking Great Volume - 5/1/2017 |
View all notes |
Set NEW NOTE alert |
Company Profile |
SEC
News |
Chart |
Request a new note
C
A
S
I |
PLAY
-
NASDAQ
Dave & Buster's Ent Inc
Retail-Restaurants
|
$65.79
|
-1.46
-2.17% |
$66.94
|
849,163
110.42% of 50 DAV
50 DAV is 769,000
|
$67.38
-2.36%
|
2/23/2017
|
$55.41
|
PP = $58.35
|
|
MB = $61.27
|
Most Recent Note - 5/12/2017 2:30:32 PM
G - Volume totals have been cooling while stubbornly holding its ground near its all-time high. Its 50 DMA line ($61.44) defines near-term support to watch on pullbacks. Latest quarter was below the +25% minimum guideline (C criteria), raising fundamental concerns.
>>> FEATURED STOCK ARTICLE : New Record High With Solid Gain on Near Average Volume - 5/2/2017 |
View all notes |
Set NEW NOTE alert |
Company Profile |
SEC
News |
Chart |
Request a new note
C
A
S
I |
Symbol/Exchange
Company Name
Industry Group |
PRICE |
CHANGE
(%Change) |
Day High |
Volume
(% DAV)
(% 50 day avg vol) |
52 Wk Hi
% From Hi |
Featured
Date |
Price
Featured |
Pivot Featured |
|
Max Buy |
OLLI
-
NASDAQ
Ollie's Bargain Outlet
Retail-DiscountandVariety
|
$38.95
|
+0.30
0.78% |
$39.55
|
703,197
111.80% of 50 DAV
50 DAV is 629,000
|
$41.30
-5.69%
|
3/27/2017
|
$32.80
|
PP = $33.55
|
|
MB = $35.23
|
Most Recent Note - 5/12/2017 2:29:35 PM
G - Sputtering since a "negative reversal" on 5/08/17 after touching a new all-time high. Very extended from any sound base. Reported earnings +22% on +16% sales revenues for the Jan '17 quarter, below the +25% minimum earnings guideline (C criteria), raising fundamental concerns. Its 50 DMA line ($34.86) and prior highs in the $33 area define near-term support to watch.
>>> FEATURED STOCK ARTICLE : Winning Streak Continues for Discount Retailer - 4/24/2017 |
View all notes |
Set NEW NOTE alert |
Company Profile |
SEC
News |
Chart |
Request a new note
C
A
S
I |
MOMO
-
NASDAQ
Momo Inc Ads Cl A
INTERNET - Content
|
$40.28
|
-3.54
-8.08% |
$42.63
|
12,006,400
205.03% of 50 DAV
50 DAV is 5,856,000
|
$44.59
-9.67%
|
3/7/2017
|
$29.71
|
PP = $27.83
|
|
MB = $29.22
|
Most Recent Note - 5/17/2017 12:04:28 PM
G - Gapped down today amid widespread market weakness, retreating from a new all-time high following a considerable gain on higher volume. Its 50 DMA line ($36.32) defines important near-term support to watch.
>>> FEATURED STOCK ARTICLE : Hovering Near Record High, Extended From Prior Base - 5/9/2017 |
View all notes |
Set NEW NOTE alert |
Company Profile |
SEC
News |
Chart |
Request a new note
C
A
S
I |
HLI
-
NYSE
Houlihan Lokey Inc Cl A
Finance-Invest Bnk/Bkrs
|
$33.74
|
-1.49
-4.23% |
$34.96
|
184,227
77.08% of 50 DAV
50 DAV is 239,000
|
$36.65
-7.94%
|
5/10/2017
|
$35.85
|
PP = $35.05
|
|
MB = $36.80
|
Most Recent Note - 5/17/2017 1:41:18 PM
Y - Pulling back further below its pivot point today raising concerns.Stalled after a "breakaway gap" and considerable gain on 5/10/17 backed by +174% above average volume hitting new all-time highs and triggering a technical buy signal. Its 50 DMA line ($33.49) defines important near-term support.
>>> FEATURED STOCK ARTICLE : Breakaway Gap Followed Strong Earnings News - 5/10/2017 |
View all notes |
Set NEW NOTE alert |
Company Profile |
SEC
News |
Chart |
Request a new note
C
A
S
I |
|
|
|
THESE ARE NOT BUY RECOMMENDATIONS!
Comments contained in the body of this report are technical
opinions only. The material herein has been obtained
from sources believed to be reliable and accurate, however,
its accuracy and completeness cannot be guaranteed.
This site is not an investment advisor, hence it does
not endorse or recommend any securities or other investments.
Any recommendation contained in this report may not
be suitable for all investors and it is not to be deemed
an offer or solicitation on our part with respect to
the purchase or sale of any securities. All trademarks,
service marks and trade names appearing in this report
are the property of their respective owners, and are
likewise used for identification purposes only.
This report is a service available
only to active Paid Premium Members.
You may opt-out of receiving report notifications
at any time. Questions or comments may be submitted
by writing to Premium Membership Services 665 S.E. 10 Street, Suite 201 Deerfield Beach, FL 33441-5634 or by calling 1-800-965-8307
or 954-785-1121.
|
|
|