You are not logged in.
This means you
CAN ONLY VIEW reports that were published prior to Sunday, March 30, 2025.
You
MUST UPGRADE YOUR MEMBERSHIP if you want to see any current reports.
AFTER MARKET UPDATE - FRIDAY, MAY 26TH, 2017
Previous After Market Report Next After Market Report >>>
|
|
|
|
DOW |
-2.67 |
21,080.28 |
-0.01% |
|
Volume |
682,818,590 |
-28% |
|
Volume |
1,573,100,040 |
-2% |
|
NASDAQ |
+4.93 |
6,210.19 |
+0.08% |
|
Advancers |
1,549 |
53% |
|
Advancers |
1,244 |
48% |
|
S&P 500 |
+0.75 |
2,415.82 |
+0.03% |
|
Decliners |
1,359 |
47% |
|
Decliners |
1,361 |
52% |
|
Russell 2000 |
-1.14 |
1,382.24 |
-0.08% |
|
52 Wk Highs |
151 |
|
|
52 Wk Highs |
132 |
|
|
S&P 600 |
-0.19 |
837.50 |
-0.02% |
|
52 Wk Lows |
39 |
|
|
52 Wk Lows |
61 |
|
|
 |
Nasdaq Composite Led as Major Indices Posted Weekly Gains
Kenneth J. Gruneisen - Passed the CAN SLIM® Master's Exam
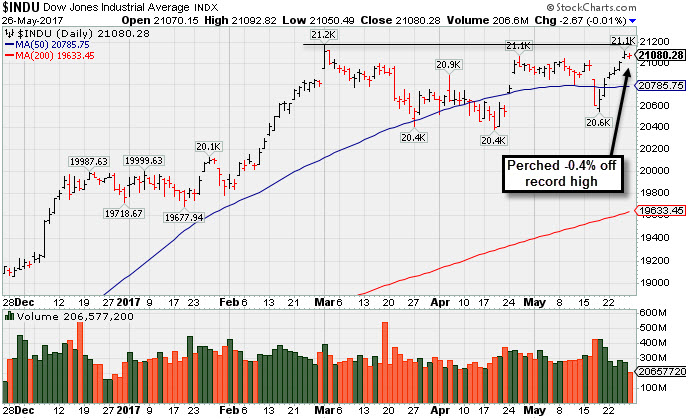
For the week, the Dow was up 1.3%, the S&P 500 rose 1.4% and the Nasdaq Composite increased 2.1%.Stocks were little changed on Friday's session. The Dow fell 3 points to 21,080. The S&P 500 was up a point to a record 2415. The Nasdaq Composite rose 5 points to an all-time high at 6210. The volume totals reported were lighter than the prior session totals on the NYSE and on the Nasdaq exchange. Advancers led decliners by a narrow margin on the NYSE while decliners slightly led advancers on the Nasdaq exchange. There were 60 high-ranked companies from the Leaders List that made new 52-week highs and were listed on the BreakOuts Page, versus the total of 91 on the prior session. New 52-week highs totals solidly outnumbered new 52-week lows on the NYSE and on the Nasdaq exchange. PICTURED: The Dow Jones Industrial Average is perched -0.4% off its record high, quietly pausing after 6 consecutive gains.
The major averages (M criteria) are in a confirmed uptrend and there remains a healthy level of market leadership (a large number of high-ranked stocks hitting new highs). New buying efforts should only be made in stocks meeting all fundamental and technical criteria of the fact-based investment system. The Featured Stocks Page lists noteworthy high-ranked leaders.
The major averages traded in a narrow range heading into the long Memorial Holiday weekend as investors assessed updates on the U.S. economy. Before the open, first-quarter GDP was up to a 1.2% annualized rate from a preliminary 0.7% reading. A gauge of manufacturing activity showed durable goods orders fell in 0.7% in April compared to a 2.3% increase in March. The University of Michigan adjusted down to 97.1 from 97.7.
Six of 11 S&P 500 sectors advanced led by Consumer stocks. Costco (COST +1.79%) rose after posting positive earnings results. Beauty products retailer Ulta Salon (ULTA +3.2%) gapped up for a new high but ended near the session low as its profits topped consensus estimates. Real Estate and Heath Care the worst performing groups on the session. Mall operator General Growth Properties (GGP -4.39%) fell and Johnson & Johnson (JNJ -0.48%) slipped.
Treasuries were up modestly Friday. Benchmark 10-year notes rose 2/32 to yield 2.25% and the 30-year bond added 5/32 to 2.91%. In commodities, NYMEX WTI crude added 1.8% to $49.78/barrel. COMEX gold increased 0.9% to $1267.10/ounce. |
 Kenneth J. Gruneisen started out as a licensed stockbroker in August 1987, a couple of months prior to the historic stock market crash that took the Dow Jones Industrial Average down -22.6% in a single day. He has published daily fact-based fundamental and technical analysis on high-ranked stocks online for two decades. Through FACTBASEDINVESTING.COM, Kenneth provides educational articles, news, market commentary, and other information regarding proven investment systems that work in good times and bad.
Comments contained in the body of this report are technical opinions only and are not necessarily those of Gruneisen Growth Corp. The material herein has been obtained from sources believed to be reliable and accurate, however, its accuracy and completeness cannot be guaranteed. Our firm, employees, and customers may effect transactions, including transactions contrary to any recommendation herein, or have positions in the securities mentioned herein or options with respect thereto. Any recommendation contained in this report may not be suitable for all investors and it is not to be deemed an offer or solicitation on our part with respect to the purchase or sale of any securities. |
|
 |
Biotech Index Fell; Semiconductor and Networking Indexes Edged Higher
Kenneth J. Gruneisen - Passed the CAN SLIM® Master's Exam
On Friday the Retail Index ($RLX +0.00%) and the Broker/Dealer Index ($XBD +0.04%) both finished flat and the Bank Index ($BKX -0.26%) edged lower. The Semiconductor Index ($SOX +0.38%) and the Networking Index ($NWX +0.46%) both ended modestly higher, but the Biotechnology Index ($BTK -1.12%) finished in the red. The Gold & Silver index ($XAU +0.69%) posted a modest gain as it outpaced the Integrated Oil Index ($XOI +0.02%) and the Oil Services Index ($OSX +0.29%). Charts courtesy www.stockcharts.com
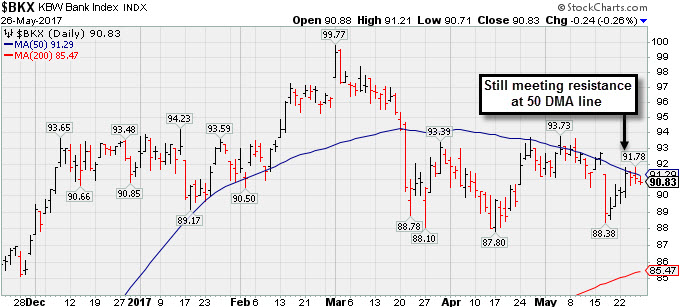 PICTURED: The Bank Index ($BKX -0.26%) is still meeting resistance at its 50-day moving average (DMA) line. Improvement would help, but subsequent losses below the prior lows would badly hurt the broader market outlook, because the financial groups have proven to be reliable leading indicators.
| Oil Services |
$OSX |
142.11 |
+0.41 |
+0.29% |
-22.68% |
| Integrated Oil |
$XOI |
1,141.97 |
+0.25 |
+0.02% |
-9.94% |
| Semiconductor |
$SOX |
1,084.85 |
+4.10 |
+0.38% |
+19.68% |
| Networking |
$NWX |
443.90 |
+2.04 |
+0.46% |
-0.49% |
| Broker/Dealer |
$XBD |
213.39 |
+0.09 |
+0.04% |
+3.95% |
| Retail |
$RLX |
1,521.51 |
-0.05 |
-0.00% |
+13.29% |
| Gold & Silver |
$XAU |
84.65 |
+0.58 |
+0.69% |
+7.34% |
| Bank |
$BKX |
90.83 |
-0.24 |
-0.26% |
-1.05% |
| Biotech |
$BTK |
3,568.18 |
-40.59 |
-1.12% |
+16.04% |
|
|
|
 |
Rising From Advanced Base With Above Average Volume
Kenneth J. Gruneisen - Passed the CAN SLIM® Master's Exam
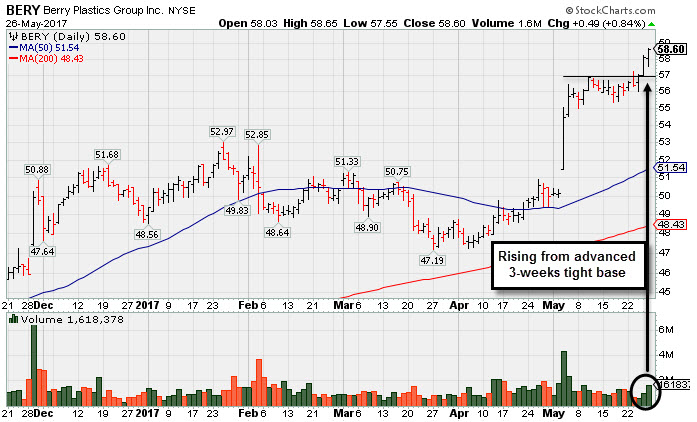
Berry Plastics Group Inc (BERY +$0.49 or +0.84% to $58.60) was highlighted in yellow with new pivot point cited based on its 5/10/17 high plus 10 cents in the earlier mid-day report (read here). It had +32% above average volume behind its gain for a new high while rising from an advanced "3-weeks tight" base. However, a proper technical breakout should have a minimum of +40% above average volume
It has rebounded and rallied to new highs after dropped from the Featured Stocks list on 3/24/17. It reported earnings +36% on +12% sales revenues for the Mar '17 quarter, and fundamentals remain strong. Recently it reported earnings +43% on -7% sales revenues for the Dec '16 quarter. The lower sales revenues are noted as a cause for concern, especially after the 4 prior quarterly comparisons showed strong sales revenues increases in the +32-35% range.
BERY was last shown in this FSU section on 3/20/17 with an annotated graph under the headline, "Sputtering Below its 50-Day Moving Average ". The high-ranked Containers/Packaging firm was highlighted in yellow with pivot point cited based on its 10/25/16 high plus 10 cents in the 11/30/16 mid-day report (read here). There was a "breakaway gap" on 11/29/16 powering to new 52-week highs with considerable volume-driven gains.
Its annual earnings (A criteria) history has been strong. The number of top-rated funds owning its shares rose from 473 in Dec '15 to 638 in Mar '17, a reassuring sign concerning the I criteria. Its Up/Down Volume Ratio of 1.7 is an unbiased indication its shares have been under accumulation over the past 50 days. It currently has a Timeliness Rating of A and a Sponsorship rating of C.
|
|
|
Color Codes Explained :
Y - Better candidates highlighted by our
staff of experts.
G - Previously featured
in past reports as yellow but may no longer be buyable under the
guidelines.
***Last / Change / Volume data in this table is the closing quote data***
Symbol/Exchange
Company Name
Industry Group |
PRICE |
CHANGE
(%Change) |
Day High |
Volume
(% DAV)
(% 50 day avg vol) |
52 Wk Hi
% From Hi |
Featured
Date |
Price
Featured |
Pivot Featured |
|
Max Buy |
BERY
-
NYSE
Berry Global Group Inc
CONSUMER NON-DURABLES - Packaging and Containers
|
$58.60
|
+0.49
0.84% |
$58.65
|
1,618,378
132.33% of 50 DAV
50 DAV is 1,223,000
|
$58.22
0.65%
|
5/26/2017
|
$58.31
|
PP = $57.04
|
|
MB = $59.89
|
 Most Recent Note - 5/26/2017 5:57:24 PM
Y - Finished near the session high after highlighted in yellow in the mid-day report with a new pivot point cited based on its 5/10/17 high plus 10 cents. Volume was +32% above average while rising from an advanced "3-weeks tight" base. It rebounded and rallied to new highs after dropped from the Featured Stocks list on 3/24/17. Reported earnings +36% on +12% sales revenues for the Mar '17 quarter, and fundamentals remain strong. See the latest FSU analysis for more details and a new annotated graph.
>>> FEATURED STOCK ARTICLE : Rising From Advanced Base With Above Average Volume - 5/26/2017 |
View all notes |
Set NEW NOTE alert |
Company Profile |
SEC
News |
Chart |
Request a new note
C
A
S
I |
EW
-
NYSE
Edwards Lifesciences Cp
HEALTH SERVICES - Medical Appliances and Equipment
|
$114.25
|
+0.08
0.07% |
$115.46
|
887,872
54.71% of 50 DAV
50 DAV is 1,623,000
|
$121.75
-6.16%
|
5/16/2017
|
$114.12
|
PP = $113.04
|
|
MB = $118.69
|
Most Recent Note - 5/22/2017 5:48:40 PM
Y - Posted a 3rd consecutive small gain with below average volume. Highlighted in yellow in the 5/16/17 mid-day report with a pivot point based on its 4/26/17 high after a cup-with-handle base.
>>> FEATURED STOCK ARTICLE : Some Overhead Supply Remains For High Ranked Medical Firm - 5/17/2017 |
View all notes |
Set NEW NOTE alert |
Company Profile |
SEC
News |
Chart |
Request a new note
C
A
S
I |
STMP
-
NASDAQ
Stamps.com Inc
INTERNET - Internet Software and Services
|
$141.50
|
+3.65
2.65% |
$141.75
|
572,810
79.12% of 50 DAV
50 DAV is 724,000
|
$140.84
0.47%
|
5/24/2017
|
$133.10
|
PP = $136.10
|
|
MB = $142.91
|
Most Recent Note - 5/26/2017 6:00:03 PM
Y - Rallied further today with lighter volume. Triggered a technical buy signal with a gain above the pivot point backed by +68% above average volume on the prior session. A new pivot point was cited based on its 2/22/17 high plus 10 cents in the 5/24/17 mid-day report. See the latest FSU analysis for more details and an annotated graph.
>>> FEATURED STOCK ARTICLE : Rallying From Bottom of 13-Week Cup Shaped Base - 5/24/2017 |
View all notes |
Set NEW NOTE alert |
Company Profile |
SEC
News |
Chart |
Request a new note
C
A
S
I |
HTHT
-
NASDAQ
China Lodging Group Ads
LEISURE - Lodging
|
$79.24
|
+1.97
2.55% |
$79.73
|
103,452
49.50% of 50 DAV
50 DAV is 209,000
|
$81.01
-2.18%
|
9/29/2016
|
$46.12
|
PP = $47.82
|
|
MB = $50.21
|
Most Recent Note - 5/24/2017 6:30:59 PM
G - It remains very extended from any sound base. Its 50 DMA line ($67) defines near-term support to watch above prior highs in the $64 area.
>>> FEATURED STOCK ARTICLE : Traded Up 108% in 10 Months Since First Highlighted - 5/18/2017 |
View all notes |
Set NEW NOTE alert |
Company Profile |
SEC
News |
Chart |
Request a new note
C
A
S
I |
BEAT
-
NASDAQ
BioTelemetry Inc
Medical-Services
|
$28.75
|
+0.45
1.59% |
$29.00
|
358,748
65.83% of 50 DAV
50 DAV is 545,000
|
$34.00
-15.44%
|
2/14/2017
|
$25.10
|
PP = $24.55
|
|
MB = $25.78
|
Most Recent Note - 5/24/2017 10:49:26 AM
G - Met resistance at its 50 DMA line recently and today it is slumping toward prior lows in the $26.50 - $27.00 area defining the next level of support. Gains above the 50 DMA line are needed for its outlook to improve. Reported earnings -20% on +15% sales revenues for the Mar '17 quarter versus the year ago period, raising fundamental concerns.
>>> FEATURED STOCK ARTICLE : Extended From Sound Base and Earnings Below +25% Guideline - 5/3/2017 |
View all notes |
Set NEW NOTE alert |
Company Profile |
SEC
News |
Chart |
Request a new note
C
A
S
I |
Symbol/Exchange
Company Name
Industry Group |
PRICE |
CHANGE
(%Change) |
Day High |
Volume
(% DAV)
(% 50 day avg vol) |
52 Wk Hi
% From Hi |
Featured
Date |
Price
Featured |
Pivot Featured |
|
Max Buy |
ULTA
-
NYSE
Ulta Beauty Inc
SPECIALTY RETAIL - Specialty Retail, Other
|
$302.40
|
+9.36
3.19% |
$310.00
|
2,856,297
484.86% of 50 DAV
50 DAV is 589,100
|
$301.40
0.33%
|
5/5/2017
|
$293.17
|
PP = $289.37
|
|
MB = $303.84
|
Most Recent Note - 5/26/2017 1:47:33 PM
Y - Reported Apr '17 quarterly earnings +41% on +22% sales revenues. Gapped up today for a 2nd consecutive volume-driven gain and hit a new all-time high. Volume and volatility often increase near earnings news. Its Relative Strength rank is currently 76, still below the 80+ minimum guideline for buy candidates.
>>> FEATURED STOCK ARTICLE : Holding Ground After Recent Gains Lacking Great Volume - 5/12/2017 |
View all notes |
Set NEW NOTE alert |
Company Profile |
SEC
News |
Chart |
Request a new note
C
A
S
I |
ESNT
-
NYSE
Essent Group Ltd
Finance-MrtgandRel Svc
|
$36.89
|
+0.41
1.12% |
$36.91
|
304,093
46.78% of 50 DAV
50 DAV is 650,000
|
$39.50
-6.61%
|
4/4/2017
|
$36.38
|
PP = $36.81
|
|
MB = $38.65
|
Most Recent Note - 5/22/2017 5:47:20 PM
G - Color code is changed to green while consolidating below its 50 DMA line ($36.59). Subsequent losses below the prior low ($34.08 on 5/05/17) would raise greater concerns and trigger a worrisome technical sell signal. A rebound above the 50 DMA line is needed fro its outlook to improve.
>>> FEATURED STOCK ARTICLE : Rebound Above 50-Day Moving Average Helped Outlook - 5/11/2017 |
View all notes |
Set NEW NOTE alert |
Company Profile |
SEC
News |
Chart |
Request a new note
C
A
S
I |
MTSI
-
NASDAQ
Macom Tech Solution Hldg
Elec-Semiconductor Mfg
|
$60.45
|
+0.56
0.94% |
$60.47
|
877,838
112.26% of 50 DAV
50 DAV is 782,000
|
$61.67
-1.98%
|
5/16/2017
|
$52.52
|
PP = $53.89
|
|
MB = $56.58
|
Most Recent Note - 5/25/2017 12:23:31 PM
G - Touched a new all-time high today. Stubbornly held its ground following considerable volume-driven gains, and it is extended from any sound base. Prior highs in the $54-55 area define initial support to watch on pullbacks. Fundamentals remain strong through the Mar '17 quarter.
>>> FEATURED STOCK ARTICLE : Big Breakout Gain With More Than 5 Times Average Volume - 5/16/2017 |
View all notes |
Set NEW NOTE alert |
Company Profile |
SEC
News |
Chart |
Request a new note
C
A
S
I |
VEEV
-
NYSE
Veeva Systems Inc Cl A
Computer Sftwr-Medical
|
$66.82
|
+5.08
8.23% |
$67.86
|
6,546,568
482.07% of 50 DAV
50 DAV is 1,358,000
|
$62.64
6.67%
|
3/16/2017
|
$49.00
|
PP = $48.05
|
|
MB = $50.45
|
Most Recent Note - 5/26/2017 1:48:06 PM
G - Gapped up today hitting another new all-time high with above average volume behind today's 3rd consecutive gain. Reported earnings +47% on +32% sales revenues for the Apr '17 quarter, continuing its strong earnings track record. Its 50 DMA line ($53.74) defines near-term support to watch on pullbacks.
>>> FEATURED STOCK ARTICLE : Wedging Into New High Territory, Extended From Sound Base - 5/15/2017 |
View all notes |
Set NEW NOTE alert |
Company Profile |
SEC
News |
Chart |
Request a new note
C
A
S
I |
ANET
-
NYSE
Arista Networks Inc
TELECOMMUNICATIONS - Communication Equipment
|
$146.45
|
-1.61
-1.09% |
$148.40
|
619,146
80.62% of 50 DAV
50 DAV is 768,000
|
$148.60
-1.45%
|
4/17/2017
|
$132.75
|
PP = $135.27
|
|
MB = $142.03
|
Most Recent Note - 5/25/2017 6:07:56 PM
G - Posted a volume-driven gain today for a new record high close. Very extended from any sound base. Its 50 DMA line ($137.45) and prior lows define near-term support to watch.
>>> FEATURED STOCK ARTICLE : Bullish Technical Action Following Recent Earnings - 5/8/2017 |
View all notes |
Set NEW NOTE alert |
Company Profile |
SEC
News |
Chart |
Request a new note
C
A
S
I |
Symbol/Exchange
Company Name
Industry Group |
PRICE |
CHANGE
(%Change) |
Day High |
Volume
(% DAV)
(% 50 day avg vol) |
52 Wk Hi
% From Hi |
Featured
Date |
Price
Featured |
Pivot Featured |
|
Max Buy |
GRUB
-
NYSE
Grubhub Inc
COMPUTER SOFTWARE and SERVICES - Technical and System Software
|
$43.83
|
+1.48
3.49% |
$43.95
|
2,639,430
110.85% of 50 DAV
50 DAV is 2,381,000
|
$46.84
-6.42%
|
4/28/2017
|
$44.22
|
PP = $44.68
|
|
MB = $46.91
|
Most Recent Note - 5/26/2017 5:58:31 PM
Y - Posted a solid gain today with higher (near average) volume. A confirming gain backed by at least +40% above average volume and strong close above the pivot point may clinch a technical buy signal.
>>> FEATURED STOCK ARTICLE : Stalled After Reaching New Highs and Encountered Mild Pressure - 5/22/2017 |
View all notes |
Set NEW NOTE alert |
Company Profile |
SEC
News |
Chart |
Request a new note
C
A
S
I |
IBP
-
NYSE
Installed Building Prod
DIVERSIFIED SERVICES - Business/Management Services
|
$48.80
|
-0.15
-0.31% |
$49.10
|
63,077
43.50% of 50 DAV
50 DAV is 145,000
|
$55.45
-11.99%
|
4/17/2017
|
$51.75
|
PP = $53.10
|
|
MB = $55.76
|
Most Recent Note - 5/24/2017 6:31:54 PM
G - Quietly consolidating near the recent low ($46.65 on 5/09/17). Prior highs in the $44 area define the next support level. A rebound above the 50 DMA line ($51.12) is needed for its outlook to improve.
>>> FEATURED STOCK ARTICLE : Due to Report Earnings Prior to Friday's Open - 5/4/2017 |
View all notes |
Set NEW NOTE alert |
Company Profile |
SEC
News |
Chart |
Request a new note
C
A
S
I |
NCOM
-
NASDAQ
National Commerce Corp
BANKING - Regional - Southeast Banks
|
$37.60
|
-0.35
-0.92% |
$37.95
|
9,539
32.89% of 50 DAV
50 DAV is 29,000
|
$40.00
-6.00%
|
4/25/2017
|
$38.95
|
PP = $40.09
|
|
MB = $42.09
|
Most Recent Note - 5/24/2017 10:58:51 AM
Y - Found support while consolidating near its 50 DMA line ($37.47) and its color code is changed to yellow. Prior lows in the $35 area define the next important chart support level to watch. Subsequent gains above the pivot point backed by a minimum of +40% above average volume may trigger a technical buy signal.
>>> FEATURED STOCK ARTICLE : Challenging 52-Week High With Volume-Driven Gains - 4/26/2017 |
View all notes |
Set NEW NOTE alert |
Company Profile |
SEC
News |
Chart |
Request a new note
C
A
S
I |
INGN
-
NASDAQ
Inogen Inc
HEALTH SERVICES - Medical Instruments and Supplies
|
$87.93
|
-1.02
-1.15% |
$89.54
|
131,085
78.49% of 50 DAV
50 DAV is 167,000
|
$89.24
-1.47%
|
4/17/2017
|
$76.77
|
PP = $80.04
|
|
MB = $84.04
|
Most Recent Note - 5/25/2017 6:10:10 PM
G - Posted a gain with lighter volume today while rallying for a new all-time high. Prior highs in the $79 area define support along with its 50 DMA line ($79.84). Fundamentals remain strong.
>>> FEATURED STOCK ARTICLE : Wedging Higher With Recent Gains Lacking Great Volume - 5/1/2017 |
View all notes |
Set NEW NOTE alert |
Company Profile |
SEC
News |
Chart |
Request a new note
C
A
S
I |
PLAY
-
NASDAQ
Dave & Buster's Ent Inc
Retail-Restaurants
|
$66.05
|
-0.50
-0.75% |
$66.55
|
410,206
55.58% of 50 DAV
50 DAV is 738,000
|
$68.25
-3.22%
|
2/23/2017
|
$55.41
|
PP = $58.35
|
|
MB = $61.27
|
Most Recent Note - 5/24/2017 11:03:18 AM
G - Hovering near its all-time high, stubbornly holding its ground. Its 50 DMA line ($62.79) defines near-term support to watch on pullbacks. Jan '17 quarterly earnings were below the +25% minimum guideline (C criteria), raising fundamental concerns.
>>> FEATURED STOCK ARTICLE : New Record High With Solid Gain on Near Average Volume - 5/2/2017 |
View all notes |
Set NEW NOTE alert |
Company Profile |
SEC
News |
Chart |
Request a new note
C
A
S
I |
Symbol/Exchange
Company Name
Industry Group |
PRICE |
CHANGE
(%Change) |
Day High |
Volume
(% DAV)
(% 50 day avg vol) |
52 Wk Hi
% From Hi |
Featured
Date |
Price
Featured |
Pivot Featured |
|
Max Buy |
OLLI
-
NASDAQ
Ollie's Bargain Outlet
Retail-DiscountandVariety
|
$41.70
|
-0.15
-0.36% |
$42.60
|
703,615
107.75% of 50 DAV
50 DAV is 653,000
|
$42.05
-0.83%
|
3/27/2017
|
$32.80
|
PP = $33.55
|
|
MB = $35.23
|
Most Recent Note - 5/25/2017 6:11:06 PM
G - Hit a new all-time high today, and it is very extended from any sound base. Recent low ($37.60 on 5/16/17) defines near-term support above its 50 DMA line. Due to report Apr '17 quarterly results on 5/31/17.
>>> FEATURED STOCK ARTICLE : Retailer Rallied +25% in 2 Months Since Featured - 5/19/2017 |
View all notes |
Set NEW NOTE alert |
Company Profile |
SEC
News |
Chart |
Request a new note
C
A
S
I |
MOMO
-
NASDAQ
Momo Inc Ads Cl A
INTERNET - Content
|
$39.14
|
+0.73
1.90% |
$40.14
|
7,496,488
122.39% of 50 DAV
50 DAV is 6,125,000
|
$45.95
-14.82%
|
3/7/2017
|
$29.71
|
PP = $27.83
|
|
MB = $29.22
|
Most Recent Note - 5/26/2017 1:41:04 PM
G - Halted its slide today after 4 consecutive volume-driven losses. Found prompt support after briefly undercutting its 50 DMA line ($37.35) on the prior session.
>>> FEATURED STOCK ARTICLE : Hovering Near Record High, Extended From Prior Base - 5/9/2017 |
View all notes |
Set NEW NOTE alert |
Company Profile |
SEC
News |
Chart |
Request a new note
C
A
S
I |
HLI
-
NYSE
Houlihan Lokey Inc Cl A
Finance-Invest Bnk/Bkrs
|
$33.65
|
+0.20
0.60% |
$33.81
|
174,068
75.03% of 50 DAV
50 DAV is 232,000
|
$36.65
-8.19%
|
5/10/2017
|
$35.85
|
PP = $35.05
|
|
MB = $36.80
|
Most Recent Note - 5/22/2017 5:43:50 PM
Y - Quietly consolidating above its 50 DMA line ($33.58) defining important near-term support. A subsequent violation would raise concerns and trigger a technical sell signal.
>>> FEATURED STOCK ARTICLE : Breakaway Gap Followed Strong Earnings News - 5/10/2017 |
View all notes |
Set NEW NOTE alert |
Company Profile |
SEC
News |
Chart |
Request a new note
C
A
S
I |
|
|
|
THESE ARE NOT BUY RECOMMENDATIONS!
Comments contained in the body of this report are technical
opinions only. The material herein has been obtained
from sources believed to be reliable and accurate, however,
its accuracy and completeness cannot be guaranteed.
This site is not an investment advisor, hence it does
not endorse or recommend any securities or other investments.
Any recommendation contained in this report may not
be suitable for all investors and it is not to be deemed
an offer or solicitation on our part with respect to
the purchase or sale of any securities. All trademarks,
service marks and trade names appearing in this report
are the property of their respective owners, and are
likewise used for identification purposes only.
This report is a service available
only to active Paid Premium Members.
You may opt-out of receiving report notifications
at any time. Questions or comments may be submitted
by writing to Premium Membership Services 665 S.E. 10 Street, Suite 201 Deerfield Beach, FL 33441-5634 or by calling 1-800-965-8307
or 954-785-1121.
|
|
|