***Last / Change / Volume data in this table is the closing quote data***
Symbol/Exchange
Company Name
Industry Group |
PRICE |
CHANGE
(%Change) |
Day High |
Volume
(% DAV)
(% 50 day avg vol) |
52 Wk Hi
% From Hi |
Featured
Date |
Price
Featured |
Pivot Featured |
|
Max Buy |
BERY
-
NYSE
Berry Global Group Inc
CONSUMER NON-DURABLES - Packaging and Containers
|
$58.10
|
-0.67
-1.14% |
$58.95
|
567,405
46.62% of 50 DAV
50 DAV is 1,217,000
|
$58.82
-1.22%
|
5/26/2017
|
$58.31
|
PP = $57.04
|
|
MB = $59.89
|
Most Recent Note - 6/1/2017 5:51:53 PM
Y - Finished near the session high for a best-ever close since highlighted in yellow in the 5/26/17 mid-day report with a new pivot point cited based on its 5/10/17 high plus 10 cents. Rebounded and rallied to new highs after dropped from the Featured Stocks list on 3/24/17. Reported earnings +36% on +12% sales revenues for the Mar '17 quarter, and fundamentals remain strong.
>>> FEATURED STOCK ARTICLE : Rising From Advanced Base With Above Average Volume - 5/26/2017 |
View all notes |
Set NEW NOTE alert |
Company Profile |
SEC
News |
Chart |
Request a new note
C
A
S
I |
EW
-
NYSE
Edwards Lifesciences Cp
HEALTH SERVICES - Medical Appliances and Equipment
|
$116.95
|
-0.61
-0.52% |
$117.49
|
805,422
51.90% of 50 DAV
50 DAV is 1,552,000
|
$121.75
-3.94%
|
5/16/2017
|
$114.12
|
PP = $113.04
|
|
MB = $118.69
|
 Most Recent Note - 6/5/2017 2:42:02 PM
Y - Recently wedging higher with gains lacking great volume conviction since highlighted in yellow in the 5/16/17 mid-day report with a pivot point based on its 4/26/17 high after a cup-with-handle base.
>>> FEATURED STOCK ARTICLE : Some Overhead Supply Remains For High Ranked Medical Firm - 5/17/2017 |
View all notes |
Set NEW NOTE alert |
Company Profile |
SEC
News |
Chart |
Request a new note
C
A
S
I |
STMP
-
NASDAQ
Stamps.com Inc
INTERNET - Internet Software and Services
|
$141.70
|
+1.20
0.85% |
$142.70
|
205,274
27.55% of 50 DAV
50 DAV is 745,000
|
$145.23
-2.43%
|
5/24/2017
|
$133.10
|
PP = $136.10
|
|
MB = $142.91
|
Most Recent Note - 6/5/2017 7:01:06 PM
Y - Perched near its 52-week high and it managed a new high close with today's 4th consecutive small gain on below average volume. It remains above its pivot point and below the "max buy" level.
>>> FEATURED STOCK ARTICLE : Rallying From Bottom of 13-Week Cup Shaped Base - 5/24/2017 |
View all notes |
Set NEW NOTE alert |
Company Profile |
SEC
News |
Chart |
Request a new note
C
A
S
I |
HTHT
-
NASDAQ
China Lodging Group Ads
LEISURE - Lodging
|
$79.07
|
-0.57
-0.72% |
$79.82
|
100,641
51.09% of 50 DAV
50 DAV is 197,000
|
$81.01
-2.39%
|
9/29/2016
|
$46.12
|
PP = $47.82
|
|
MB = $50.21
|
Most Recent Note - 6/1/2017 5:49:46 PM
G - Posted a gain on light volume today while hovering near its all-time high, very extended from any sound base. Its 50 DMA line ($68.79) defines near-term support to watch.
>>> FEATURED STOCK ARTICLE : Traded Up 108% in 10 Months Since First Highlighted - 5/18/2017 |
View all notes |
Set NEW NOTE alert |
Company Profile |
SEC
News |
Chart |
Request a new note
C
A
S
I |
BEAT
-
NASDAQ
BioTelemetry Inc
Medical-Services
|
$28.50
|
-0.35
-1.21% |
$29.15
|
246,860
44.48% of 50 DAV
50 DAV is 555,000
|
$34.00
-16.18%
|
2/14/2017
|
$25.10
|
PP = $24.55
|
|
MB = $25.78
|
Most Recent Note - 6/1/2017 5:45:37 PM
G - Still sputtering below its 50 DMA line. Prior lows in the $26.50 - $27.00 area define the next level of support. Reported earnings -20% on +15% sales revenues for the Mar '17 quarter versus the year ago period, raising fundamental concerns. See the latest FSU analysis for more details and a new annotated graph.
>>> FEATURED STOCK ARTICLE : Lingering Below 50-Day Moving Average Line - 6/1/2017 |
View all notes |
Set NEW NOTE alert |
Company Profile |
SEC
News |
Chart |
Request a new note
C
A
S
I |
Symbol/Exchange
Company Name
Industry Group |
PRICE |
CHANGE
(%Change) |
Day High |
Volume
(% DAV)
(% 50 day avg vol) |
52 Wk Hi
% From Hi |
Featured
Date |
Price
Featured |
Pivot Featured |
|
Max Buy |
ULTA
-
NASDAQ
Ulta Beauty Inc
SPECIALTY RETAIL - Specialty Retail, Other
|
$313.73
|
+2.26
0.73% |
$314.86
|
843,114
132.36% of 50 DAV
50 DAV is 637,000
|
$311.78
0.63%
|
5/5/2017
|
$293.17
|
PP = $289.37
|
|
MB = $303.84
|
Most Recent Note - 6/1/2017 5:53:59 PM
Y - Reported Apr '17 quarterly earnings +41% on +22% sales revenues. Perched at its all-time high following 5 consecutive gains. Its Relative Strength rank is currently 82, above the 80+ minimum guideline for buy candidates.
>>> FEATURED STOCK ARTICLE : Holding Ground After Recent Gains Lacking Great Volume - 5/12/2017 |
View all notes |
Set NEW NOTE alert |
Company Profile |
SEC
News |
Chart |
Request a new note
C
A
S
I |
ESNT
-
NYSE
Essent Group Ltd
Finance-MrtgandRel Svc
|
$35.17
|
-1.39
-3.80% |
$36.60
|
839,050
136.21% of 50 DAV
50 DAV is 616,000
|
$39.50
-10.96%
|
4/4/2017
|
$36.38
|
PP = $36.81
|
|
MB = $38.65
|
Most Recent Note - 6/5/2017 2:38:11 PM
G - Slumping below its 50 DMA line ($36.72) with today's loss. Subsequent losses below the prior low ($34.08 on 5/05/17) would raise greater concerns and trigger a worrisome technical sell signal.
>>> FEATURED STOCK ARTICLE : Rebound Above 50-Day Moving Average Helped Outlook - 5/11/2017 |
View all notes |
Set NEW NOTE alert |
Company Profile |
SEC
News |
Chart |
Request a new note
C
A
S
I |
FIVE
-
NASDAQ
Five Below Inc
Retail-DiscountandVariety
|
$52.29
|
+0.08
0.15% |
$52.65
|
1,480,138
116.45% of 50 DAV
50 DAV is 1,271,000
|
$54.13
-3.40%
|
6/2/2017
|
$50.76
|
PP = $52.63
|
|
MB = $55.26
|
Most Recent Note - 6/2/2017 6:31:13 PM
Y - Posted a small gain with above average volume after highlighted in yellow with pivot point cited based on its 5/10/17 high in the earlier mid-day report. A convincing volume-driven gain above the pivot point is still needed to clinch a proper technical buy signal. Posted earnings +25% on +21% sales revenues for the Apr '17 quarter, and 3 of the past 4 earnings increases were above the +25% minimum guideline (C criteria), helping it better match the fact-based investment system's winning models. Good annual earnings (A criteria) track record. See the latest FSU analysis for more details and a new annotated graph.
>>> FEATURED STOCK ARTICLE : Retail - Discount & Variety Firm Perched Near Highs - 6/2/2017 |
View all notes |
Set NEW NOTE alert |
Company Profile |
SEC
News |
Chart |
Request a new note
C
A
S
I |
MTSI
-
NASDAQ
Macom Tech Solution Hldg
Elec-Semiconductor Mfg
|
$58.20
|
-1.05
-1.77% |
$60.14
|
855,182
100.61% of 50 DAV
50 DAV is 850,000
|
$61.70
-5.67%
|
5/16/2017
|
$52.52
|
PP = $53.89
|
|
MB = $56.58
|
Most Recent Note - 5/31/2017 6:02:13 PM
G - Posted a small gain for a new high close today. Stubbornly held its ground following considerable volume-driven gains, and it is extended from any sound base. Prior highs in the $54-55 area define initial support to watch on pullbacks.
>>> FEATURED STOCK ARTICLE : Big Breakout Gain With More Than 5 Times Average Volume - 5/16/2017 |
View all notes |
Set NEW NOTE alert |
Company Profile |
SEC
News |
Chart |
Request a new note
C
A
S
I |
VEEV
-
NYSE
Veeva Systems Inc Cl A
Computer Sftwr-Medical
|
$65.72
|
-0.98
-1.47% |
$66.11
|
1,661,604
107.06% of 50 DAV
50 DAV is 1,552,000
|
$67.86
-3.15%
|
3/16/2017
|
$49.00
|
PP = $48.05
|
|
MB = $50.45
|
Most Recent Note - 5/31/2017 5:49:19 PM
G - Pulled back from its all-time high with heavier and above average volume behind its 2nd consecutive loss. Its 50 DMA line ($54.32) defines near-term support to watch.
>>> FEATURED STOCK ARTICLE : Wedging Into New High Territory, Extended From Sound Base - 5/15/2017 |
View all notes |
Set NEW NOTE alert |
Company Profile |
SEC
News |
Chart |
Request a new note
C
A
S
I |
Symbol/Exchange
Company Name
Industry Group |
PRICE |
CHANGE
(%Change) |
Day High |
Volume
(% DAV)
(% 50 day avg vol) |
52 Wk Hi
% From Hi |
Featured
Date |
Price
Featured |
Pivot Featured |
|
Max Buy |
ANET
-
NYSE
Arista Networks Inc
TELECOMMUNICATIONS - Communication Equipment
|
$154.33
|
+2.07
1.36% |
$154.89
|
927,834
114.55% of 50 DAV
50 DAV is 810,000
|
$152.54
1.17%
|
4/17/2017
|
$132.75
|
PP = $135.27
|
|
MB = $142.03
|
Most Recent Note - 5/31/2017 5:51:41 PM
G - Posted a small gain with heavy volume today, churning while very extended from any sound base. Its 50 DMA line ($138.56) and prior lows define near-term support to watch.
>>> FEATURED STOCK ARTICLE : Bullish Technical Action Following Recent Earnings - 5/8/2017 |
View all notes |
Set NEW NOTE alert |
Company Profile |
SEC
News |
Chart |
Request a new note
C
A
S
I |
GRUB
-
NYSE
Grubhub Inc
COMPUTER SOFTWARE and SERVICES - Technical and System Software
|
$44.52
|
-0.15
-0.34% |
$44.95
|
1,422,236
60.86% of 50 DAV
50 DAV is 2,337,000
|
$46.84
-4.94%
|
4/28/2017
|
$44.22
|
PP = $44.68
|
|
MB = $46.91
|
Most Recent Note - 6/2/2017 6:32:11 PM
Y - Posted another gain today with below average volume. A confirming gain backed by at least +40% above average volume and strong close above the pivot point may clinch a technical buy signal.
>>> FEATURED STOCK ARTICLE : Stalled After Reaching New Highs and Encountered Mild Pressure - 5/22/2017 |
View all notes |
Set NEW NOTE alert |
Company Profile |
SEC
News |
Chart |
Request a new note
C
A
S
I |
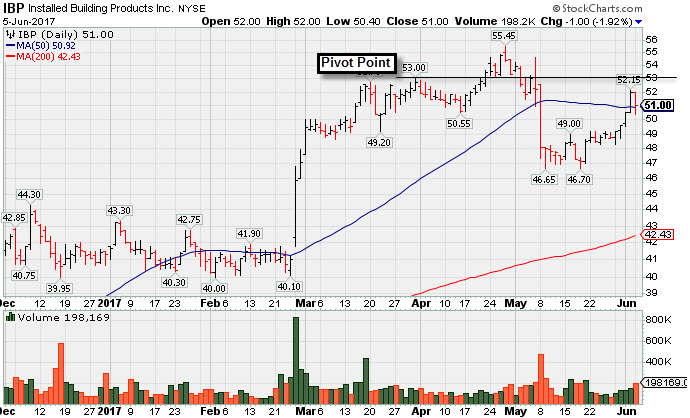
IBP
-
NYSE
Installed Building Prod
DIVERSIFIED SERVICES - Business/Management Services
|
$51.00
|
-1.00
-1.92% |
$52.00
|
198,169
145.71% of 50 DAV
50 DAV is 136,000
|
$55.45
-8.03%
|
4/17/2017
|
$51.75
|
PP = $53.10
|
|
MB = $55.76
|
Most Recent Note - 6/5/2017 6:56:17 PM
G - Consolidating near its 50 DMA line. The recent low ($46.65 on 5/09/17) defines important near-term support. See the latest FSU analysis for more details and a new annotated graph.
>>> FEATURED STOCK ARTICLE : Consolidating Near 50-Day Moving Average Line - 6/5/2017 |
View all notes |
Set NEW NOTE alert |
Company Profile |
SEC
News |
Chart |
Request a new note
C
A
S
I |
NCOM
-
NASDAQ
National Commerce Corp
BANKING - Regional - Southeast Banks
|
$38.60
|
+0.20
0.52% |
$39.75
|
13,371
47.75% of 50 DAV
50 DAV is 28,000
|
$40.00
-3.50%
|
4/25/2017
|
$38.95
|
PP = $40.09
|
|
MB = $42.09
|
Most Recent Note - 6/5/2017 2:36:51 PM
Y - Gapped up today nearly challenging its 52-week high and approaching its pivot point. A volume-driven gain for new highs may trigger a technical buy signal. Its 50 DMA line ($37.74) defines support above prior lows in the $35 area
>>> FEATURED STOCK ARTICLE : Sputtering Near 50-Day Moving Average After Stalling - 5/30/2017 |
View all notes |
Set NEW NOTE alert |
Company Profile |
SEC
News |
Chart |
Request a new note
C
A
S
I |
INGN
-
NASDAQ
Inogen Inc
HEALTH SERVICES - Medical Instruments and Supplies
|
$90.48
|
-0.80
-0.88% |
$91.74
|
234,994
145.96% of 50 DAV
50 DAV is 161,000
|
$91.69
-1.32%
|
4/17/2017
|
$76.77
|
PP = $80.04
|
|
MB = $84.04
|
Most Recent Note - 6/5/2017 12:51:37 PM
G - Holding its ground perched at its all-time high, extended from its prior base. Prior highs in the $79 area define support along with its 50 DMA line ($80.60). Fundamentals remain strong.
>>> FEATURED STOCK ARTICLE : Perched at All Time High Following Volume-Driven Gains - 5/31/2017 |
View all notes |
Set NEW NOTE alert |
Company Profile |
SEC
News |
Chart |
Request a new note
C
A
S
I |
Symbol/Exchange
Company Name
Industry Group |
PRICE |
CHANGE
(%Change) |
Day High |
Volume
(% DAV)
(% 50 day avg vol) |
52 Wk Hi
% From Hi |
Featured
Date |
Price
Featured |
Pivot Featured |
|
Max Buy |
PLAY
-
NASDAQ
Dave & Buster's Ent Inc
Retail-Restaurants
|
$68.16
|
-0.48
-0.70% |
$69.24
|
980,367
135.41% of 50 DAV
50 DAV is 724,000
|
$69.42
-1.82%
|
2/23/2017
|
$55.41
|
PP = $58.35
|
|
MB = $61.27
|
Most Recent Note - 5/31/2017 6:00:31 PM
G - Still hovering near its all-time high, stubbornly holding its ground. Its 50 DMA line ($63.31) defines near-term support to watch on pullbacks. Jan '17 quarterly earnings were below the +25% minimum guideline (C criteria), raising fundamental concerns.
>>> FEATURED STOCK ARTICLE : New Record High With Solid Gain on Near Average Volume - 5/2/2017 |
View all notes |
Set NEW NOTE alert |
Company Profile |
SEC
News |
Chart |
Request a new note
C
A
S
I |
OLLI
-
NASDAQ
Ollie's Bargain Outlet
Retail-DiscountandVariety
|
$42.90
|
+0.00
0.00% |
$43.00
|
498,904
71.48% of 50 DAV
50 DAV is 698,000
|
$44.08
-2.67%
|
3/27/2017
|
$32.80
|
PP = $33.55
|
|
MB = $35.23
|
Most Recent Note - 6/1/2017 12:22:05 PM
G - Perched at its all-time high with today's gain on higher volume, getting very extended from any sound base. Recent low ($37.60 on 5/16/17) defines near-term support above its 50 DMA line. Reported Apr '17 quarterly earnings +25% on +17% sales revenues, meeting the +25% minimum earnings guideline (C criteria).
>>> FEATURED STOCK ARTICLE : Retailer Rallied +25% in 2 Months Since Featured - 5/19/2017 |
View all notes |
Set NEW NOTE alert |
Company Profile |
SEC
News |
Chart |
Request a new note
C
A
S
I |
MOMO
-
NASDAQ
Momo Inc Ads Cl A
INTERNET - Content
|
$40.08
|
+2.01
5.28% |
$40.45
|
9,568,710
146.69% of 50 DAV
50 DAV is 6,523,000
|
$45.95
-12.77%
|
3/7/2017
|
$29.71
|
PP = $27.83
|
|
MB = $29.22
|
Most Recent Note - 6/5/2017 12:56:06 PM
G - Rallying from support near its 50 DMA line ($37.90) with today's big gain on higher volume. Prior low ($35.55 on 4/26/17) defines the next important chart support level where a violation would raise more serious concerns.
>>> FEATURED STOCK ARTICLE : Hovering Near Record High, Extended From Prior Base - 5/9/2017 |
View all notes |
Set NEW NOTE alert |
Company Profile |
SEC
News |
Chart |
Request a new note
C
A
S
I |
HLI
-
NYSE
Houlihan Lokey Inc Cl A
Finance-Invest Bnk/Bkrs
|
$33.72
|
-0.58
-1.69% |
$34.36
|
201,888
93.90% of 50 DAV
50 DAV is 215,000
|
$36.65
-7.99%
|
5/10/2017
|
$35.85
|
PP = $35.05
|
|
MB = $36.80
|
Most Recent Note - 6/1/2017 5:49:03 PM
Y - Rebounded above its 50 DMA line ($33.70) and finished near the session high. Recent lows defines near-term support where violations would raise concerns and trigger technical sell signals.
>>> FEATURED STOCK ARTICLE : Breakaway Gap Followed Strong Earnings News - 5/10/2017 |
View all notes |
Set NEW NOTE alert |
Company Profile |
SEC
News |
Chart |
Request a new note
C
A
S
I |