You are not logged in.
This means you
CAN ONLY VIEW reports that were published prior to Monday, March 31, 2025.
You
MUST UPGRADE YOUR MEMBERSHIP if you want to see any current reports.
AFTER MARKET UPDATE - THURSDAY, JUNE 1ST, 2017
Previous After Market Report Next After Market Report >>>
|
|
|
|
DOW |
+135.53 |
21,144.18 |
+0.65% |
|
Volume |
974,180,710 |
-33% |
|
Volume |
1,936,414,834 |
-12% |
|
NASDAQ |
+48.31 |
6,246.83 |
+0.78% |
|
Advancers |
2,435 |
82% |
|
Advancers |
1,699 |
71% |
|
S&P 500 |
+18.26 |
2,430.06 |
+0.76% |
|
Decliners |
531 |
18% |
|
Decliners |
693 |
29% |
|
Russell 2000 |
+25.85 |
1,396.06 |
+1.89% |
|
52 Wk Highs |
249 |
|
|
52 Wk Highs |
210 |
|
|
S&P 600 |
+14.48 |
846.65 |
+1.74% |
|
52 Wk Lows |
19 |
|
|
52 Wk Lows |
34 |
|
|
 |
Breadth Positive While Leadership Expands and Indices Rise
Kenneth J. Gruneisen - Passed the CAN SLIM® Master's Exam
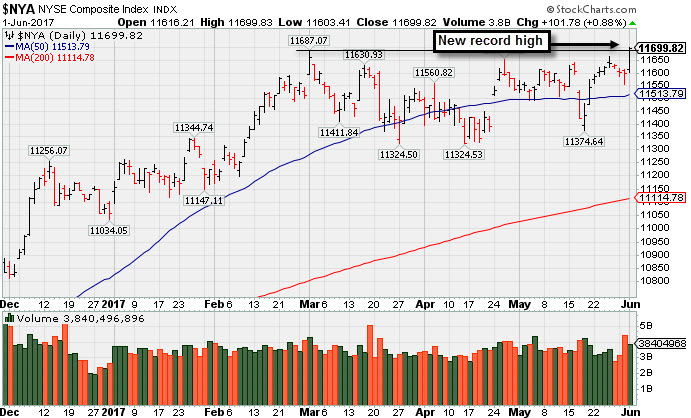
Stocks finished higher on Thursday. The Dow was up 135 points to 21144. The S&P 500 added 18 points to 2430 and the Nasdaq Composite gained 48 points to 6246. The volume totals reported were lighter than the prior session totals on the NYSE and on the Nasdaq exchange. Breadth was solidly positive as advancers led decliners by more than a 4-1 margin on the NYSE and 2-1 on the Nasdaq exchange. There were 103 high-ranked companies from the Leaders List that made new 52-week highs and were listed on the BreakOuts Page, up from the total of 68 on the prior session. New 52-week highs expanded and solidly outnumbered new 52-week lows on the NYSE and on the Nasdaq exchange. PICTURED: The NYSE Composite Index posted a big gain and hit a new record high.
The major averages (M criteria) are in a confirmed uptrend and there remains a healthy level of market leadership (a large number of high-ranked stocks hitting new highs). New buying efforts should only be made in stocks meeting all fundamental and technical criteria of the fact-based investment system. The Featured Stocks Page lists noteworthy high-ranked leaders.
The major averages each climbed to all-time highs Thursday as investors digested better-than-expected economic data. Prior to market open, an ADP report showed that 253,000 workers were added to private payrolls in May, easily besting estimates of 180,000. In separate releases, Markit’s survey of U.S. manufacturing expanded to 52.7 while ISM’s manufacturing index came in at 54.9 last month. Finally, initial jobless claims came in at 248,000, above the expected 238,000.
All 11 sectors in the S&P 500 ended in positive territory. Consumer Discretionary shares outperformed with Ford Motor (F +2.61%) on the rise. Dollar General (DG 6.54%) as the discount retailer beat estimates on the top and bottom lines. Technology stocks fluctuated with Palo Alto Networks (PANW +17.20%) rallied after customer additions jumped to near record highs in the quarter. Shares of Hewlett-Packard Enterprise (HPE -6.86%) slid as the company posted a significant revenue decline in its key server business. In M&A news, Deere (DE +1.83%) rose after agreeing to acquire privately held Germany-based construction equipment firm Wirtgen Group for $5.2 billion.
Treasuries declined with the benchmark 10-year note down 3/32 to yield 2.21%. In commodities, NYMEX WTI crude fell 0.4% to $48.12/barrel. COMEX gold lost 0.4% to $1267.00/ounce. |
 Kenneth J. Gruneisen started out as a licensed stockbroker in August 1987, a couple of months prior to the historic stock market crash that took the Dow Jones Industrial Average down -22.6% in a single day. He has published daily fact-based fundamental and technical analysis on high-ranked stocks online for two decades. Through FACTBASEDINVESTING.COM, Kenneth provides educational articles, news, market commentary, and other information regarding proven investment systems that work in good times and bad.
Comments contained in the body of this report are technical opinions only and are not necessarily those of Gruneisen Growth Corp. The material herein has been obtained from sources believed to be reliable and accurate, however, its accuracy and completeness cannot be guaranteed. Our firm, employees, and customers may effect transactions, including transactions contrary to any recommendation herein, or have positions in the securities mentioned herein or options with respect thereto. Any recommendation contained in this report may not be suitable for all investors and it is not to be deemed an offer or solicitation on our part with respect to the purchase or sale of any securities. |
|
 |
Financial, Retail, Networking, Biotech, and Energy Groups Rose
Kenneth J. Gruneisen - Passed the CAN SLIM® Master's Exam
On Thursday the Bank Index ($BKX +1.28%) and the Broker/Dealer Index ($XBD +1.63%) rallied along with the Retail Index ($RLX +0.99%). The Networking Index ($NWX +3.291%) and the Biotechnology Index ($BTK +2.28%) both posted solid gains, meanwhile the Semiconductor Index ($SOX +0.10%) was little changed. The Integrated Oil Index ($XOI +0.73%) and the Oil Services Index ($OSX +1.05%) rose while the Gold & Silver index ($XAU -0.40%) ended slightly lower. Charts courtesy www.stockcharts.com
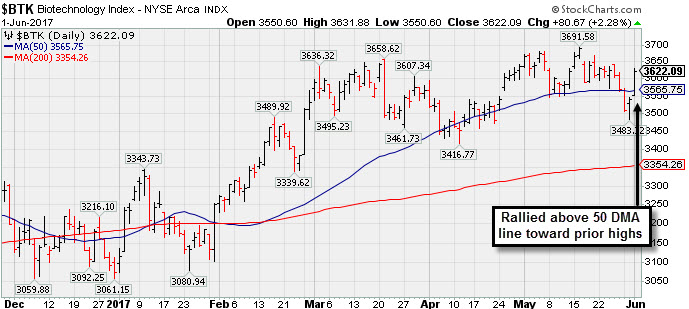 PICTURED: The Biotechnology Index ($BTK +2.28%) rallied above its 50-day moving average (DMA) line toward prior highs.
| Oil Services |
$OSX |
140.12 |
+1.46 |
+1.05% |
-23.76% |
| Integrated Oil |
$XOI |
1,129.57 |
+8.18 |
+0.73% |
-10.92% |
| Semiconductor |
$SOX |
1,092.55 |
+1.13 |
+0.10% |
+20.53% |
| Networking |
$NWX |
455.55 |
+14.49 |
+3.29% |
+2.12% |
| Broker/Dealer |
$XBD |
213.94 |
+3.43 |
+1.63% |
+4.22% |
| Retail |
$RLX |
1,531.69 |
+14.96 |
+0.99% |
+14.05% |
| Gold & Silver |
$XAU |
83.05 |
-0.34 |
-0.41% |
+5.31% |
| Bank |
$BKX |
90.00 |
+1.13 |
+1.27% |
-1.95% |
| Biotech |
$BTK |
3,622.09 |
+80.67 |
+2.28% |
+17.79% |
|
|
|
 |
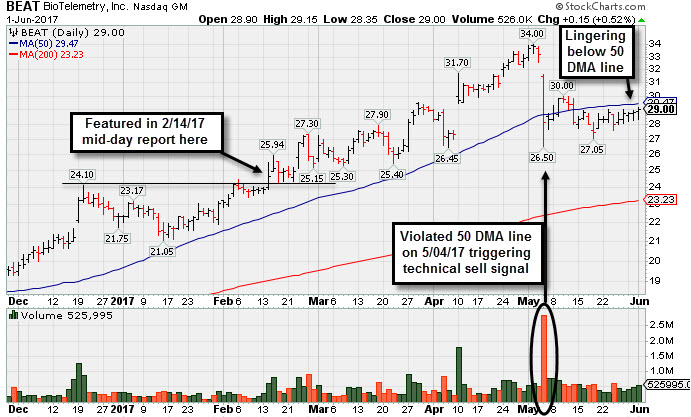
Lingering Below 50-Day Moving Average Line
Kenneth J. Gruneisen - Passed the CAN SLIM® Master's Exam
BioTelemetry Inc (BEAT +$0.15 or +0.52% to $29.00) has met resistance at its 50-day moving average (DMA) line recently when trying to rebound. Prior lows in the $26.50 - $27.00 area define the next level of support.
Volume and volatility often increase near earnings news. It reported earnings -20% on +15% sales revenues for the Mar '17 quarter versus the year ago period, raising fundamental concerns, then abruptly pulled back from all-time high territory with a big loss on heavy volume violating its 50 DMA line.
BEAT was last shown in this FSU section on 5/13/17 with an annotated graph under the headline, "Extended From Sound Base and Earnings Below +25% Guideline. It traded up as much as +35.4% since highlighted in yellow with pivot point cited based on its 10/05/16 high plus 10 cents in the 2/14/17 mid-day report (read here).
Its current Up/Down Volume Ratio of 1.4 is an unbiased indication its shares have been under accumulation over the past 50 days. The number of top-rated funds owning its shares rose from 194 in Dec '15 to 280 in Mar '17. Increasing ownership by top-rated funds is a reassuring sign concerning the I criteria, and it has a small supply (S criteria) of only 28.7 million shares outstanding.
|
|
|
Color Codes Explained :
Y - Better candidates highlighted by our
staff of experts.
G - Previously featured
in past reports as yellow but may no longer be buyable under the
guidelines.
***Last / Change / Volume data in this table is the closing quote data***
Symbol/Exchange
Company Name
Industry Group |
PRICE |
CHANGE
(%Change) |
Day High |
Volume
(% DAV)
(% 50 day avg vol) |
52 Wk Hi
% From Hi |
Featured
Date |
Price
Featured |
Pivot Featured |
|
Max Buy |
BERY
-
NYSE
Berry Global Group Inc
CONSUMER NON-DURABLES - Packaging and Containers
|
$58.63
|
+0.64
1.10% |
$58.64
|
998,756
81.20% of 50 DAV
50 DAV is 1,230,000
|
$58.65
-0.03%
|
5/26/2017
|
$58.31
|
PP = $57.04
|
|
MB = $59.89
|
 Most Recent Note - 6/1/2017 5:51:53 PM
Y - Finished near the session high for a best-ever close since highlighted in yellow in the 5/26/17 mid-day report with a new pivot point cited based on its 5/10/17 high plus 10 cents. Rebounded and rallied to new highs after dropped from the Featured Stocks list on 3/24/17. Reported earnings +36% on +12% sales revenues for the Mar '17 quarter, and fundamentals remain strong.
>>> FEATURED STOCK ARTICLE : Rising From Advanced Base With Above Average Volume - 5/26/2017 |
View all notes |
Set NEW NOTE alert |
Company Profile |
SEC
News |
Chart |
Request a new note
C
A
S
I |
EW
-
NYSE
Edwards Lifesciences Cp
HEALTH SERVICES - Medical Appliances and Equipment
|
$117.38
|
+2.31
2.01% |
$117.39
|
1,265,297
80.54% of 50 DAV
50 DAV is 1,571,000
|
$121.75
-3.59%
|
5/16/2017
|
$114.12
|
PP = $113.04
|
|
MB = $118.69
|
Most Recent Note - 5/30/2017 1:04:53 PM
Y - Holding its ground stubbornly with volume totals cooling since highlighted in yellow in the 5/16/17 mid-day report with a pivot point based on its 4/26/17 high after a cup-with-handle base.
>>> FEATURED STOCK ARTICLE : Some Overhead Supply Remains For High Ranked Medical Firm - 5/17/2017 |
View all notes |
Set NEW NOTE alert |
Company Profile |
SEC
News |
Chart |
Request a new note
C
A
S
I |
STMP
-
NASDAQ
Stamps.com Inc
INTERNET - Internet Software and Services
|
$140.30
|
+2.40
1.74% |
$140.70
|
376,640
50.56% of 50 DAV
50 DAV is 745,000
|
$145.23
-3.40%
|
5/24/2017
|
$133.10
|
PP = $136.10
|
|
MB = $142.91
|
Most Recent Note - 5/30/2017 5:54:07 PM
Y - There was a "negative reversal" today after hitting a new 52-week high. Triggered a technical buy signal with a gain above the pivot point on 5/25/17 backed by +68% above average volume.
>>> FEATURED STOCK ARTICLE : Rallying From Bottom of 13-Week Cup Shaped Base - 5/24/2017 |
View all notes |
Set NEW NOTE alert |
Company Profile |
SEC
News |
Chart |
Request a new note
C
A
S
I |
HTHT
-
NASDAQ
China Lodging Group Ads
LEISURE - Lodging
|
$79.12
|
+2.72
3.56% |
$79.26
|
100,441
49.48% of 50 DAV
50 DAV is 203,000
|
$81.01
-2.33%
|
9/29/2016
|
$46.12
|
PP = $47.82
|
|
MB = $50.21
|
Most Recent Note - 6/1/2017 5:49:46 PM
G - Posted a gain on light volume today while hovering near its all-time high, very extended from any sound base. Its 50 DMA line ($68.79) defines near-term support to watch.
>>> FEATURED STOCK ARTICLE : Traded Up 108% in 10 Months Since First Highlighted - 5/18/2017 |
View all notes |
Set NEW NOTE alert |
Company Profile |
SEC
News |
Chart |
Request a new note
C
A
S
I |
BEAT
-
NASDAQ
BioTelemetry Inc
Medical-Services
|
$29.00
|
+0.15
0.52% |
$29.15
|
523,151
95.64% of 50 DAV
50 DAV is 547,000
|
$34.00
-14.71%
|
2/14/2017
|
$25.10
|
PP = $24.55
|
|
MB = $25.78
|
Most Recent Note - 6/1/2017 5:45:37 PM
G - Still sputtering below its 50 DMA line. Prior lows in the $26.50 - $27.00 area define the next level of support. Reported earnings -20% on +15% sales revenues for the Mar '17 quarter versus the year ago period, raising fundamental concerns. See the latest FSU analysis for more details and a new annotated graph.
>>> FEATURED STOCK ARTICLE : Lingering Below 50-Day Moving Average Line - 6/1/2017 |
View all notes |
Set NEW NOTE alert |
Company Profile |
SEC
News |
Chart |
Request a new note
C
A
S
I |
Symbol/Exchange
Company Name
Industry Group |
PRICE |
CHANGE
(%Change) |
Day High |
Volume
(% DAV)
(% 50 day avg vol) |
52 Wk Hi
% From Hi |
Featured
Date |
Price
Featured |
Pivot Featured |
|
Max Buy |
ULTA
-
NASDAQ
Ulta Beauty Inc
SPECIALTY RETAIL - Specialty Retail, Other
|
$306.72
|
+1.88
0.62% |
$307.19
|
552,078
86.53% of 50 DAV
50 DAV is 638,000
|
$310.00
-1.06%
|
5/5/2017
|
$293.17
|
PP = $289.37
|
|
MB = $303.84
|
Most Recent Note - 6/1/2017 5:53:59 PM
Y - Reported Apr '17 quarterly earnings +41% on +22% sales revenues. Perched at its all-time high following 5 consecutive gains. Its Relative Strength rank is currently 82, above the 80+ minimum guideline for buy candidates.
>>> FEATURED STOCK ARTICLE : Holding Ground After Recent Gains Lacking Great Volume - 5/12/2017 |
View all notes |
Set NEW NOTE alert |
Company Profile |
SEC
News |
Chart |
Request a new note
C
A
S
I |
ESNT
-
NYSE
Essent Group Ltd
Finance-MrtgandRel Svc
|
$36.74
|
+0.47
1.30% |
$36.74
|
431,268
68.56% of 50 DAV
50 DAV is 629,000
|
$39.50
-6.99%
|
4/4/2017
|
$36.38
|
PP = $36.81
|
|
MB = $38.65
|
Most Recent Note - 5/30/2017 1:03:37 PM
G - Still consolidating near its 50 DMA line ($36.63). Subsequent losses below the prior low ($34.08 on 5/05/17) would raise greater concerns and trigger a worrisome technical sell signal.
>>> FEATURED STOCK ARTICLE : Rebound Above 50-Day Moving Average Helped Outlook - 5/11/2017 |
View all notes |
Set NEW NOTE alert |
Company Profile |
SEC
News |
Chart |
Request a new note
C
A
S
I |
MTSI
-
NASDAQ
Macom Tech Solution Hldg
Elec-Semiconductor Mfg
|
$59.75
|
-1.22
-2.00% |
$61.23
|
1,239,466
150.97% of 50 DAV
50 DAV is 821,000
|
$61.70
-3.16%
|
5/16/2017
|
$52.52
|
PP = $53.89
|
|
MB = $56.58
|
Most Recent Note - 5/31/2017 6:02:13 PM
G - Posted a small gain for a new high close today. Stubbornly held its ground following considerable volume-driven gains, and it is extended from any sound base. Prior highs in the $54-55 area define initial support to watch on pullbacks.
>>> FEATURED STOCK ARTICLE : Big Breakout Gain With More Than 5 Times Average Volume - 5/16/2017 |
View all notes |
Set NEW NOTE alert |
Company Profile |
SEC
News |
Chart |
Request a new note
C
A
S
I |
VEEV
-
NYSE
Veeva Systems Inc Cl A
Computer Sftwr-Medical
|
$64.87
|
+1.33
2.09% |
$64.89
|
1,720,539
110.93% of 50 DAV
50 DAV is 1,551,000
|
$67.86
-4.41%
|
3/16/2017
|
$49.00
|
PP = $48.05
|
|
MB = $50.45
|
Most Recent Note - 5/31/2017 5:49:19 PM
G - Pulled back from its all-time high with heavier and above average volume behind its 2nd consecutive loss. Its 50 DMA line ($54.32) defines near-term support to watch.
>>> FEATURED STOCK ARTICLE : Wedging Into New High Territory, Extended From Sound Base - 5/15/2017 |
View all notes |
Set NEW NOTE alert |
Company Profile |
SEC
News |
Chart |
Request a new note
C
A
S
I |
ANET
-
NYSE
Arista Networks Inc
TELECOMMUNICATIONS - Communication Equipment
|
$148.52
|
+1.14
0.77% |
$148.95
|
1,385,416
174.71% of 50 DAV
50 DAV is 793,000
|
$148.60
-0.05%
|
4/17/2017
|
$132.75
|
PP = $135.27
|
|
MB = $142.03
|
Most Recent Note - 5/31/2017 5:51:41 PM
G - Posted a small gain with heavy volume today, churning while very extended from any sound base. Its 50 DMA line ($138.56) and prior lows define near-term support to watch.
>>> FEATURED STOCK ARTICLE : Bullish Technical Action Following Recent Earnings - 5/8/2017 |
View all notes |
Set NEW NOTE alert |
Company Profile |
SEC
News |
Chart |
Request a new note
C
A
S
I |
Symbol/Exchange
Company Name
Industry Group |
PRICE |
CHANGE
(%Change) |
Day High |
Volume
(% DAV)
(% 50 day avg vol) |
52 Wk Hi
% From Hi |
Featured
Date |
Price
Featured |
Pivot Featured |
|
Max Buy |
GRUB
-
NYSE
Grubhub Inc
COMPUTER SOFTWARE and SERVICES - Technical and System Software
|
$43.71
|
+0.24
0.55% |
$44.00
|
1,303,925
54.49% of 50 DAV
50 DAV is 2,393,000
|
$46.84
-6.67%
|
4/28/2017
|
$44.22
|
PP = $44.68
|
|
MB = $46.91
|
Most Recent Note - 6/1/2017 5:52:39 PM
Y - Posted a small gain today with below average volume. A confirming gain backed by at least +40% above average volume and strong close above the pivot point may clinch a technical buy signal.
>>> FEATURED STOCK ARTICLE : Stalled After Reaching New Highs and Encountered Mild Pressure - 5/22/2017 |
View all notes |
Set NEW NOTE alert |
Company Profile |
SEC
News |
Chart |
Request a new note
C
A
S
I |
IBP
-
NYSE
Installed Building Prod
DIVERSIFIED SERVICES - Business/Management Services
|
$50.50
|
+0.90
1.81% |
$50.50
|
129,792
96.14% of 50 DAV
50 DAV is 135,000
|
$55.45
-8.93%
|
4/17/2017
|
$51.75
|
PP = $53.10
|
|
MB = $55.76
|
Most Recent Note - 5/31/2017 5:57:47 PM
G - Consolidating above the recent low ($46.65 on 5/09/17) defining near-term support. A rebound above the 50 DMA line ($50.90) is needed for its outlook to improve.
>>> FEATURED STOCK ARTICLE : Due to Report Earnings Prior to Friday's Open - 5/4/2017 |
View all notes |
Set NEW NOTE alert |
Company Profile |
SEC
News |
Chart |
Request a new note
C
A
S
I |
NCOM
-
NASDAQ
National Commerce Corp
BANKING - Regional - Southeast Banks
|
$37.85
|
+0.50
1.34% |
$38.00
|
15,143
54.08% of 50 DAV
50 DAV is 28,000
|
$40.00
-5.38%
|
4/25/2017
|
$38.95
|
PP = $40.09
|
|
MB = $42.09
|
Most Recent Note - 5/30/2017 5:37:15 PM
Y - Quietly consolidating near its 50 DMA line ($37.53). Prior lows in the $35 area define the next important chart support level to watch. See the latest FSU analysis for more details and a new annotated graph.
>>> FEATURED STOCK ARTICLE : Sputtering Near 50-Day Moving Average After Stalling - 5/30/2017 |
View all notes |
Set NEW NOTE alert |
Company Profile |
SEC
News |
Chart |
Request a new note
C
A
S
I |
INGN
-
NASDAQ
Inogen Inc
HEALTH SERVICES - Medical Instruments and Supplies
|
$89.58
|
+0.94
1.06% |
$89.96
|
182,135
113.13% of 50 DAV
50 DAV is 161,000
|
$89.66
-0.08%
|
4/17/2017
|
$76.77
|
PP = $80.04
|
|
MB = $84.04
|
Most Recent Note - 5/31/2017 5:46:58 PM
G - Holding its ground perched at its all-time high. Prior highs in the $79 area define support along with its 50 DMA line ($80.60). Fundamentals remain strong. See the latest FSU analysis for more details and a new annotated graph.
>>> FEATURED STOCK ARTICLE : Perched at All Time High Following Volume-Driven Gains - 5/31/2017 |
View all notes |
Set NEW NOTE alert |
Company Profile |
SEC
News |
Chart |
Request a new note
C
A
S
I |
PLAY
-
NASDAQ
Dave & Buster's Ent Inc
Retail-Restaurants
|
$67.55
|
+0.85
1.27% |
$67.67
|
518,436
71.31% of 50 DAV
50 DAV is 727,000
|
$68.25
-1.03%
|
2/23/2017
|
$55.41
|
PP = $58.35
|
|
MB = $61.27
|
Most Recent Note - 5/31/2017 6:00:31 PM
G - Still hovering near its all-time high, stubbornly holding its ground. Its 50 DMA line ($63.31) defines near-term support to watch on pullbacks. Jan '17 quarterly earnings were below the +25% minimum guideline (C criteria), raising fundamental concerns.
>>> FEATURED STOCK ARTICLE : New Record High With Solid Gain on Near Average Volume - 5/2/2017 |
View all notes |
Set NEW NOTE alert |
Company Profile |
SEC
News |
Chart |
Request a new note
C
A
S
I |
Symbol/Exchange
Company Name
Industry Group |
PRICE |
CHANGE
(%Change) |
Day High |
Volume
(% DAV)
(% 50 day avg vol) |
52 Wk Hi
% From Hi |
Featured
Date |
Price
Featured |
Pivot Featured |
|
Max Buy |
OLLI
-
NASDAQ
Ollie's Bargain Outlet
Retail-DiscountandVariety
|
$43.65
|
+2.50
6.08% |
$44.00
|
1,509,060
225.57% of 50 DAV
50 DAV is 669,000
|
$42.60
2.46%
|
3/27/2017
|
$32.80
|
PP = $33.55
|
|
MB = $35.23
|
Most Recent Note - 6/1/2017 12:22:05 PM
G - Perched at its all-time high with today's gain on higher volume, getting very extended from any sound base. Recent low ($37.60 on 5/16/17) defines near-term support above its 50 DMA line. Reported Apr '17 quarterly earnings +25% on +17% sales revenues, meeting the +25% minimum earnings guideline (C criteria).
>>> FEATURED STOCK ARTICLE : Retailer Rallied +25% in 2 Months Since Featured - 5/19/2017 |
View all notes |
Set NEW NOTE alert |
Company Profile |
SEC
News |
Chart |
Request a new note
C
A
S
I |
MOMO
-
NASDAQ
Momo Inc Ads Cl A
INTERNET - Content
|
$37.34
|
-0.70
-1.84% |
$38.67
|
6,262,539
95.74% of 50 DAV
50 DAV is 6,541,000
|
$45.95
-18.74%
|
3/7/2017
|
$29.71
|
PP = $27.83
|
|
MB = $29.22
|
Most Recent Note - 5/31/2017 5:53:04 PM
G - Found prompt support near its 50 DMA line ($37.56) and posted a gain today with higher volume. Prior low ($35.55 on 4/26/17) defines the next important chart support level where a violation would raise more serious concerns.
>>> FEATURED STOCK ARTICLE : Hovering Near Record High, Extended From Prior Base - 5/9/2017 |
View all notes |
Set NEW NOTE alert |
Company Profile |
SEC
News |
Chart |
Request a new note
C
A
S
I |
HLI
-
NYSE
Houlihan Lokey Inc Cl A
Finance-Invest Bnk/Bkrs
|
$34.51
|
+0.94
2.80% |
$34.51
|
174,155
79.16% of 50 DAV
50 DAV is 220,000
|
$36.65
-5.84%
|
5/10/2017
|
$35.85
|
PP = $35.05
|
|
MB = $36.80
|
Most Recent Note - 6/1/2017 5:49:03 PM
Y - Rebounded above its 50 DMA line ($33.70) and finished near the session high. Recent lows defines near-term support where violations would raise concerns and trigger technical sell signals.
>>> FEATURED STOCK ARTICLE : Breakaway Gap Followed Strong Earnings News - 5/10/2017 |
View all notes |
Set NEW NOTE alert |
Company Profile |
SEC
News |
Chart |
Request a new note
C
A
S
I |
|
|
|
THESE ARE NOT BUY RECOMMENDATIONS!
Comments contained in the body of this report are technical
opinions only. The material herein has been obtained
from sources believed to be reliable and accurate, however,
its accuracy and completeness cannot be guaranteed.
This site is not an investment advisor, hence it does
not endorse or recommend any securities or other investments.
Any recommendation contained in this report may not
be suitable for all investors and it is not to be deemed
an offer or solicitation on our part with respect to
the purchase or sale of any securities. All trademarks,
service marks and trade names appearing in this report
are the property of their respective owners, and are
likewise used for identification purposes only.
This report is a service available
only to active Paid Premium Members.
You may opt-out of receiving report notifications
at any time. Questions or comments may be submitted
by writing to Premium Membership Services 665 S.E. 10 Street, Suite 201 Deerfield Beach, FL 33441-5634 or by calling 1-800-965-8307
or 954-785-1121.
|
|
|