***Last / Change / Volume data in this table is the closing quote data***
Symbol/Exchange
Company Name
Industry Group |
PRICE |
CHANGE
(%Change) |
Day High |
Volume
(% DAV)
(% 50 day avg vol) |
52 Wk Hi
% From Hi |
Featured
Date |
Price
Featured |
Pivot Featured |
|
Max Buy |
THO
-
NYSE
Thor Industries Inc
AUTOMOTIVE - Recreational Vehicles
|
$105.80
|
-0.13
-0.12% |
$106.59
|
658,877
77.24% of 50 DAV
50 DAV is 853,000
|
$115.74
-8.59%
|
6/7/2017
|
$102.95
|
PP = $98.92
|
|
MB = $103.87
|
Most Recent Note - 6/8/2017 7:33:57 PM
Y - Holding its ground since highlighted in yellow with pivot point cited based on its 4/27/17 high. Gapped up on 6/06/17 clearing a "double bottom" base while rebounding toward prior highs. See the latest FSU analysis for more details and a new annotated graph.
>>> FEATURED STOCK ARTICLE : Some Overhead Supply Remains After Latest Technical Breakout - 6/8/2017 |
View all notes |
Set NEW NOTE alert |
Company Profile |
SEC
News |
Chart |
Request a new note
C
A
S
I |
SBCF
-
NASDAQ
Seacoast Banking Corp Fl
BANKING - Regional - Mid-Atlantic Banks
|
$24.96
|
-0.15
-0.60% |
$25.00
|
210,697
65.03% of 50 DAV
50 DAV is 324,000
|
$25.88
-3.55%
|
6/9/2017
|
$24.13
|
PP = $25.98
|
|
MB = $27.28
|
Most Recent Note - 6/12/2017 12:43:52 PM
Y - Challenging its 52-week high with above average volume behind today's 3rd consecutive big gain. Color code was changed to yellow with new pivot point cited based on its 4/25/17 high when the 6/09/17 mid-day report noted - "Subsequent volume-driven gains for new highs may trigger a new technical buy signal. Rebound above the 50 DMA line helped its outlook improve. Fundamentals remain strong."
>>> FEATURED STOCK ARTICLE : Relative Strength Rating Slumped After Lingering Below 50 DMA - 5/25/2017 |
View all notes |
Set NEW NOTE alert |
Company Profile |
SEC
News |
Chart |
Request a new note
C
A
S
I |
BERY
-
NYSE
Berry Global Group Inc
CONSUMER NON-DURABLES - Packaging and Containers
|
$57.93
|
-0.05
-0.09% |
$58.52
|
700,621
57.57% of 50 DAV
50 DAV is 1,217,000
|
$58.95
-1.73%
|
5/26/2017
|
$58.31
|
PP = $57.04
|
|
MB = $59.89
|
Most Recent Note - 6/8/2017 2:50:05 PM
Y - Consolidating above its pivot point, holding its ground near its 52-week high. Reported earnings +36% on +12% sales revenues for the Mar '17 quarter, and fundamentals remain strong.
>>> FEATURED STOCK ARTICLE : Rising From Advanced Base With Above Average Volume - 5/26/2017 |
View all notes |
Set NEW NOTE alert |
Company Profile |
SEC
News |
Chart |
Request a new note
C
A
S
I |
EW
-
NYSE
Edwards Lifesciences Cp
HEALTH SERVICES - Medical Appliances and Equipment
|
$115.01
|
-0.04
-0.03% |
$115.68
|
1,004,024
67.95% of 50 DAV
50 DAV is 1,477,500
|
$121.75
-5.54%
|
5/16/2017
|
$114.12
|
PP = $113.04
|
|
MB = $118.69
|
Most Recent Note - 6/12/2017 5:31:59 PM
Y - Ended in the upper half of its intra-day range with a loss on higher volume today. Recently wedged higher with gains lacking great volume conviction since highlighted in yellow in the 5/16/17 mid-day report with a pivot point based on its 4/26/17 high after a cup-with-handle base.
>>> FEATURED STOCK ARTICLE : Some Overhead Supply Remains For High Ranked Medical Firm - 5/17/2017 |
View all notes |
Set NEW NOTE alert |
Company Profile |
SEC
News |
Chart |
Request a new note
C
A
S
I |
NTES
-
NASDAQ
Netease Inc Adr
INTERNET - Internet Information Providers
|
$294.77
|
-6.92
-2.29% |
$305.96
|
1,064,447
81.01% of 50 DAV
50 DAV is 1,314,000
|
$323.10
-8.77%
|
6/8/2017
|
$310.76
|
PP = $307.62
|
|
MB = $323.00
|
Most Recent Note - 6/9/2017 6:45:48 PM
Y - Pulling back since highlighted in yellow with pivot point cited based on its 3/01/17 high plus 10 cents. Fundamentals remain strong and it reported earnings +52% on +62% sales revenues for the Mar '17 quarter. See the latest FSU analysis for more details and a new annotated graph.
>>> FEATURED STOCK ARTICLE : Encountered Distributional Pressure After Hitting New Highs - 6/9/2017 |
View all notes |
Set NEW NOTE alert |
Company Profile |
SEC
News |
Chart |
Request a new note
C
A
S
I |
Symbol/Exchange
Company Name
Industry Group |
PRICE |
CHANGE
(%Change) |
Day High |
Volume
(% DAV)
(% 50 day avg vol) |
52 Wk Hi
% From Hi |
Featured
Date |
Price
Featured |
Pivot Featured |
|
Max Buy |
STMP
-
NASDAQ
Stamps.com Inc
INTERNET - Internet Software and Services
|
$145.15
|
-1.25
-0.85% |
$148.85
|
339,696
46.22% of 50 DAV
50 DAV is 735,000
|
$149.80
-3.10%
|
5/24/2017
|
$133.10
|
PP = $136.10
|
|
MB = $142.91
|
Most Recent Note - 6/12/2017 5:35:49 PM
Y - Pulled back from its 52-week high with today's loss after a streak of 8 consecutive gains with below average volume. It finished near its "max buy" level.
>>> FEATURED STOCK ARTICLE : Rallying From Bottom of 13-Week Cup Shaped Base - 5/24/2017 |
View all notes |
Set NEW NOTE alert |
Company Profile |
SEC
News |
Chart |
Request a new note
C
A
S
I |
HTHT
-
NASDAQ
China Lodging Group Ads
LEISURE - Lodging
|
$77.51
|
-3.06
-3.80% |
$82.17
|
258,131
120.62% of 50 DAV
50 DAV is 214,000
|
$88.08
-12.00%
|
9/29/2016
|
$46.12
|
PP = $47.82
|
|
MB = $50.21
|
 Most Recent Note - 6/14/2017 11:38:02 AM
G - Enduring recent distributional pressure while retreating from its all-time high. Extended from any sound base and well above its 50 DMA line ($72.20) defining important near-term support to watch.
>>> FEATURED STOCK ARTICLE : Traded Up 108% in 10 Months Since First Highlighted - 5/18/2017 |
View all notes |
Set NEW NOTE alert |
Company Profile |
SEC
News |
Chart |
Request a new note
C
A
S
I |
BEAT
-
NASDAQ
BioTelemetry Inc
Medical-Services
|
$29.15
|
-0.05
-0.17% |
$29.35
|
276,945
49.37% of 50 DAV
50 DAV is 561,000
|
$34.00
-14.26%
|
2/14/2017
|
$25.10
|
PP = $24.55
|
|
MB = $25.78
|
Most Recent Note - 6/13/2017 10:20:47 PM
G - Slumped back below its 50 DMA line ($29.69) today. Prior lows in the $26.50 - $27.00 area define the next important level of support. Raised fundamental concerns with sub par Mar '17 earnings that were repeatedly noted.
>>> FEATURED STOCK ARTICLE : Lingering Below 50-Day Moving Average Line - 6/1/2017 |
View all notes |
Set NEW NOTE alert |
Company Profile |
SEC
News |
Chart |
Request a new note
C
A
S
I |
ULTA
-
NYSE
Ulta Beauty Inc
SPECIALTY RETAIL - Specialty Retail, Other
|
$302.21
|
-0.48
-0.16% |
$303.51
|
635,890
351.51% of 50 DAV
50 DAV is 180,900
|
$314.86
-4.02%
|
5/5/2017
|
$293.17
|
PP = $289.37
|
|
MB = $303.84
|
Most Recent Note - 6/14/2017 12:47:32 PM
Y - Color code is changed to yellow while consolidating below its "max buy" level. However, its Relative Strength rating fell to 78, below the 80+ minimum guideline for buy candidates.
>>> FEATURED STOCK ARTICLE : Holding Ground After Recent Gains Lacking Great Volume - 5/12/2017 |
View all notes |
Set NEW NOTE alert |
Company Profile |
SEC
News |
Chart |
Request a new note
C
A
S
I |
ESNT
-
NYSE
Essent Group Ltd
Finance-MrtgandRel Svc
|
$36.96
|
-0.21
-0.56% |
$37.02
|
345,313
56.79% of 50 DAV
50 DAV is 608,000
|
$39.50
-6.43%
|
4/4/2017
|
$36.38
|
PP = $36.81
|
|
MB = $38.65
|
Most Recent Note - 6/12/2017 5:30:30 PM
G - Consolidating near its 50 DMA line ($36.77). Subsequent losses below the prior low ($34.08 on 5/05/17) would raise greater concerns and trigger a worrisome technical sell signal.
>>> FEATURED STOCK ARTICLE : Rebound Above 50-Day Moving Average Helped Outlook - 5/11/2017 |
View all notes |
Set NEW NOTE alert |
Company Profile |
SEC
News |
Chart |
Request a new note
C
A
S
I |
Symbol/Exchange
Company Name
Industry Group |
PRICE |
CHANGE
(%Change) |
Day High |
Volume
(% DAV)
(% 50 day avg vol) |
52 Wk Hi
% From Hi |
Featured
Date |
Price
Featured |
Pivot Featured |
|
Max Buy |
FIVE
-
NASDAQ
Five Below Inc
Retail-DiscountandVariety
|
$48.65
|
-2.36
-4.63% |
$50.00
|
3,019,580
267.69% of 50 DAV
50 DAV is 1,128,000
|
$54.13
-10.12%
|
6/2/2017
|
$50.76
|
PP = $52.63
|
|
MB = $55.26
|
Most Recent Note - 6/14/2017 11:49:26 AM
G - Color code was changed to green after gapping down today and violating its 50 DMA line triggering a technical sell signal. It failed to produce confirming gains after previously noted - "A convincing volume-driven gain above the pivot point is still needed to clinch a proper technical buy signal."
>>> FEATURED STOCK ARTICLE : Retail - Discount & Variety Firm Perched Near Highs - 6/2/2017 |
View all notes |
Set NEW NOTE alert |
Company Profile |
SEC
News |
Chart |
Request a new note
C
A
S
I |
MTSI
-
NASDAQ
Macom Tech Solution Hldg
Elec-Semiconductor Mfg
|
$56.05
|
-0.89
-1.56% |
$57.68
|
954,826
102.56% of 50 DAV
50 DAV is 931,000
|
$61.70
-9.16%
|
5/16/2017
|
$52.52
|
PP = $53.89
|
|
MB = $56.58
|
Most Recent Note - 6/14/2017 6:02:10 PM
Y - Suffered another loss today with higher volume than the prior session, action indicative of distributional pressure. Subsequent losses below prior highs in the $54-55 area would raise concerns and trigger a technical sell signal
>>> FEATURED STOCK ARTICLE : Big Breakout Gain With More Than 5 Times Average Volume - 5/16/2017 |
View all notes |
Set NEW NOTE alert |
Company Profile |
SEC
News |
Chart |
Request a new note
C
A
S
I |
VEEV
-
NYSE
Veeva Systems Inc Cl A
Computer Sftwr-Medical
|
$58.96
|
-0.62
-1.04% |
$60.13
|
1,680,800
101.25% of 50 DAV
50 DAV is 1,660,000
|
$68.07
-13.38%
|
3/16/2017
|
$49.00
|
PP = $48.05
|
|
MB = $50.45
|
Most Recent Note - 6/12/2017 5:38:12 PM
G - Suffered another big loss on higher volume, and recent action has been indicative of distributional pressure. Its 50 DMA line ($56.60) defines near-term support to watch.
>>> FEATURED STOCK ARTICLE : Wedging Into New High Territory, Extended From Sound Base - 5/15/2017 |
View all notes |
Set NEW NOTE alert |
Company Profile |
SEC
News |
Chart |
Request a new note
C
A
S
I |
ANET
-
NYSE
Arista Networks Inc
TELECOMMUNICATIONS - Communication Equipment
|
$151.05
|
-0.73
-0.48% |
$153.38
|
550,999
65.75% of 50 DAV
50 DAV is 838,000
|
$158.57
-4.74%
|
4/17/2017
|
$132.75
|
PP = $135.27
|
|
MB = $142.03
|
Most Recent Note - 6/9/2017 6:35:28 PM
G - Pulled back from its all-time high amid widespread tech weakness. Remains very extended from any sound base. Its 50 DMA line ($141) and prior lows define near-term support to watch. See the latest FSU analysis for more details and an annotated graph.
>>> FEATURED STOCK ARTICLE : Computer Networking Firm Very Extended From Any Sound Base - 6/6/2017 |
View all notes |
Set NEW NOTE alert |
Company Profile |
SEC
News |
Chart |
Request a new note
C
A
S
I |
GRUB
-
NYSE
Grubhub Inc
COMPUTER SOFTWARE and SERVICES - Technical and System Software
|
$43.75
|
+0.32
0.74% |
$44.26
|
1,926,021
82.88% of 50 DAV
50 DAV is 2,324,000
|
$46.84
-6.59%
|
4/28/2017
|
$44.22
|
PP = $44.68
|
|
MB = $46.91
|
Most Recent Note - 6/8/2017 7:41:02 PM
Y - Consolidating within close striking distance of its 52-week high. A confirming gain backed by at least +40% above average volume and strong close above the pivot point may clinch a technical buy signal.
>>> FEATURED STOCK ARTICLE : Stalled After Reaching New Highs and Encountered Mild Pressure - 5/22/2017 |
View all notes |
Set NEW NOTE alert |
Company Profile |
SEC
News |
Chart |
Request a new note
C
A
S
I |
Symbol/Exchange
Company Name
Industry Group |
PRICE |
CHANGE
(%Change) |
Day High |
Volume
(% DAV)
(% 50 day avg vol) |
52 Wk Hi
% From Hi |
Featured
Date |
Price
Featured |
Pivot Featured |
|
Max Buy |
IBP
-
NYSE
Installed Building Prod
DIVERSIFIED SERVICES - Business/Management Services
|
$53.85
|
-0.05
-0.09% |
$54.58
|
110,376
78.84% of 50 DAV
50 DAV is 140,000
|
$55.45
-2.89%
|
6/13/2017
|
$54.25
|
PP = $55.55
|
|
MB = $58.33
|
Most Recent Note - 6/13/2017 1:20:43 PM
Y - Color code is changed to yellow with new pivot point cited based on its 4/27/17 high plus 10 cents. Subsequent volume-driven gains above the pivot point may trigger a new technical buy signal. Rebounded above its 50 DMA line, rising near the prior high with today's 10th gain in the span of 11 sessions. The recent low ($46.65 on 5/09/17) defines important near-term support.
>>> FEATURED STOCK ARTICLE : Consolidating Near 50-Day Moving Average Line - 6/5/2017 |
View all notes |
Set NEW NOTE alert |
Company Profile |
SEC
News |
Chart |
Request a new note
C
A
S
I |
NCOM
-
NASDAQ
National Commerce Corp
BANKING - Regional - Southeast Banks
|
$38.95
|
+0.50
1.30% |
$39.20
|
23,592
81.35% of 50 DAV
50 DAV is 29,000
|
$40.00
-2.63%
|
4/25/2017
|
$38.95
|
PP = $40.09
|
|
MB = $42.09
|
Most Recent Note - 6/14/2017 11:41:11 AM
Y - Color code is changed to yellow while perched within close striking distance of its 52-week high and consolidating above its 50 DMA line ($37.95). Subsequent gains above the pivot point backed by a minimum of +40% above average volume may trigger a technical buy signal. Prior lows in the $36-35 area define the next important support level.
>>> FEATURED STOCK ARTICLE : Sputtering Near 50-Day Moving Average After Stalling - 5/30/2017 |
View all notes |
Set NEW NOTE alert |
Company Profile |
SEC
News |
Chart |
Request a new note
C
A
S
I |
INGN
-
NASDAQ
Inogen Inc
HEALTH SERVICES - Medical Instruments and Supplies
|
$92.36
|
+0.89
0.97% |
$92.52
|
203,235
112.91% of 50 DAV
50 DAV is 180,000
|
$95.43
-3.22%
|
4/17/2017
|
$76.77
|
PP = $80.04
|
|
MB = $84.04
|
Most Recent Note - 6/13/2017 10:23:52 PM
G - Trading near its all-time high, very extended from its prior base. Prior highs in the $79 area define support along with its 50 DMA line ($83.25).
>>> FEATURED STOCK ARTICLE : Perched at All Time High Following Volume-Driven Gains - 5/31/2017 |
View all notes |
Set NEW NOTE alert |
Company Profile |
SEC
News |
Chart |
Request a new note
C
A
S
I |
HQY
-
NASDAQ
Healthequity Inc
COMPUTER SOFTWARE and SERVICES - Healthcare Information Service
|
$51.57
|
-0.41
-0.79% |
$52.11
|
758,939
154.57% of 50 DAV
50 DAV is 491,000
|
$54.95
-6.15%
|
6/7/2017
|
$50.01
|
PP = $49.35
|
|
MB = $51.82
|
Most Recent Note - 6/14/2017 11:52:56 AM
G - Consolidating above prior highs in the $49 area defining initial support. It is slightly extended from its prior base following volume-driven gains.
>>> FEATURED STOCK ARTICLE : High Volume Breakout Quickly Getting Extended - 6/7/2017 |
View all notes |
Set NEW NOTE alert |
Company Profile |
SEC
News |
Chart |
Request a new note
C
A
S
I |
PLAY
-
NASDAQ
Dave & Buster's Ent Inc
Retail-Restaurants
|
$67.77
|
-1.64
-2.36% |
$69.89
|
1,122,825
169.36% of 50 DAV
50 DAV is 663,000
|
$73.48
-7.77%
|
2/23/2017
|
$55.41
|
PP = $58.35
|
|
MB = $61.27
|
Most Recent Note - 6/14/2017 6:03:47 PM
G - Pulled back with higher volume today, enduring more distributional pressure. Its 50 DMA line ($65.09) defines near-term support to watch.
>>> FEATURED STOCK ARTICLE : Perched Near Record High After Solid April '17 Quarterly Results - 6/12/2017 |
View all notes |
Set NEW NOTE alert |
Company Profile |
SEC
News |
Chart |
Request a new note
C
A
S
I |
Symbol/Exchange
Company Name
Industry Group |
PRICE |
CHANGE
(%Change) |
Day High |
Volume
(% DAV)
(% 50 day avg vol) |
52 Wk Hi
% From Hi |
Featured
Date |
Price
Featured |
Pivot Featured |
|
Max Buy |
OLLI
-
NASDAQ
Ollie's Bargain Outlet
Retail-DiscountandVariety
|
$41.80
|
-0.10
-0.24% |
$42.15
|
564,973
87.87% of 50 DAV
50 DAV is 643,000
|
$44.08
-5.16%
|
3/27/2017
|
$32.80
|
PP = $33.55
|
|
MB = $35.23
|
Most Recent Note - 6/12/2017 5:39:18 PM
G - Pulled back from its all-time high with a big loss today on higher volume. It is extended from any sound base. Its 50 DMA line ($38.56) and recent low ($37.60 on 5/16/17) define near-term support to watch on pullbacks. Fundamentals remain strong.
>>> FEATURED STOCK ARTICLE : Retailer Rallied +25% in 2 Months Since Featured - 5/19/2017 |
View all notes |
Set NEW NOTE alert |
Company Profile |
SEC
News |
Chart |
Request a new note
C
A
S
I |
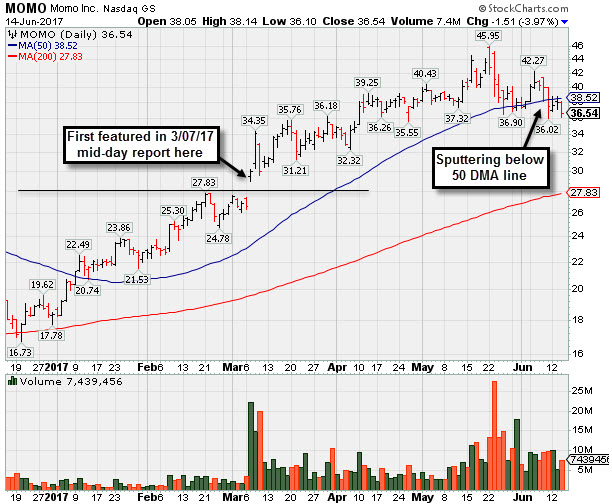
MOMO
-
NASDAQ
Momo Inc Ads Cl A
INTERNET - Content
|
$36.54
|
-1.51
-3.97% |
$38.14
|
7,438,831
107.45% of 50 DAV
50 DAV is 6,923,000
|
$45.95
-20.48%
|
3/7/2017
|
$29.71
|
PP = $27.83
|
|
MB = $29.22
|
Most Recent Note - 6/14/2017 6:00:42 PM
G - Sputtering below its 50 DMA line after losses on higher volume. A rebound above the 50 DMA line is needed for its outlook to improve. Prior low ($35.55 on 4/26/17) defines the next important chart support level where a violation would raise more serious concerns. See the latest FSU analysis for more details and a new annotated graph.
>>> FEATURED STOCK ARTICLE : Sputtering Below 50-Day Moving Average Line - 6/14/2017 |
View all notes |
Set NEW NOTE alert |
Company Profile |
SEC
News |
Chart |
Request a new note
C
A
S
I |
HLI
-
NYSE
Houlihan Lokey Inc Cl A
Finance-Invest Bnk/Bkrs
|
$34.77
|
+0.24
0.70% |
$34.81
|
101,107
53.50% of 50 DAV
50 DAV is 189,000
|
$36.65
-5.13%
|
5/10/2017
|
$35.85
|
PP = $35.05
|
|
MB = $36.80
|
Most Recent Note - 6/8/2017 2:54:51 PM
Y - Consolidating near its 50 DMA line ($33.60). Recent low ($32.72 on 5/31/17) defines near-term support where violations would raise concerns and trigger a more worrisome technical sell signal.
>>> FEATURED STOCK ARTICLE : Breakaway Gap Followed Strong Earnings News - 5/10/2017 |
View all notes |
Set NEW NOTE alert |
Company Profile |
SEC
News |
Chart |
Request a new note
C
A
S
I |