You are not logged in.
This means you
CAN ONLY VIEW reports that were published prior to Thursday, March 20, 2025.
You
MUST UPGRADE YOUR MEMBERSHIP if you want to see any current reports.
AFTER MARKET UPDATE - THURSDAY, MAY 11TH, 2017
Previous After Market Report Next After Market Report >>>
|
|
|
|
DOW |
-23.69 |
20,919.42 |
-0.11% |
|
Volume |
1,013,859,880 |
+6% |
|
Volume |
1,773,249,200 |
-7% |
|
NASDAQ |
-13.18 |
6,115.96 |
-0.22% |
|
Advancers |
1,129 |
39% |
|
Advancers |
1,041 |
37% |
|
S&P 500 |
-5.19 |
2,394.44 |
-0.22% |
|
Decliners |
1,786 |
61% |
|
Decliners |
1,793 |
63% |
|
Russell 2000 |
-9.39 |
1,390.20 |
-0.67% |
|
52 Wk Highs |
81 |
|
|
52 Wk Highs |
120 |
|
|
S&P 600 |
-6.29 |
845.02 |
-0.74% |
|
52 Wk Lows |
42 |
|
|
52 Wk Lows |
60 |
|
|
 |
Leadership Contracted as Major Indices Pulled Back
Kenneth J. Gruneisen - Passed the CAN SLIM® Master's Exam
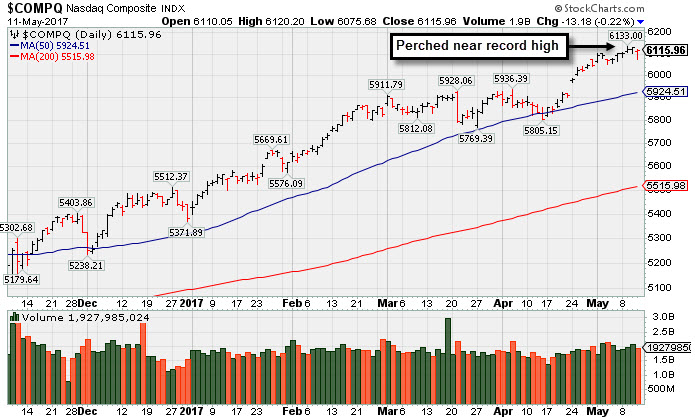
Stocks finished lower on Thursday. The Dow was down 23 points to 20919. The S&P 500 lost 5 points to 2394 and the Nasdaq Composite fell 13 points to 6115. The volume totals reported were mixed, higher than the prior session total on the NYSE and lower on the Nasdaq exchange. Breadth was negative as decliners led advancers by a 3-2 margin on the NYSE and on the Nasdaq exchange. There were 45 high-ranked companies from the Leaders List that made new 52-week highs and were listed on the BreakOuts Page, versus the total of 62 on the prior session. New 52-week highs totals contracted yet still outnumbered new 52-week lows on the NYSE and on the Nasdaq exchange. PICTURED: The Nasdaq Composite Index is perched near its record high.
The major averages' (M criteria) are in a confirmed uptrend, and there remains a healthy level of market leadership (number of high-ranked stocks hitting new highs). New buying efforts should be made only in stocks matching all of the fundamental and technical criteria of the fact-based investment system. The Featured Stocks Page lists noteworthy high-ranked leaders.
The major averages declined as investors digested disappointing corporate earnings. Retailers retreated amid weaker-than-expected quarterly results which seemed to be further confirmation of the secular trend toward online shopping. Department store stocks finished lower with Macy’s (M -17.01%) slumping to a 6-year low after posting a 4.6% decline in same-store sales. On the data front, initial jobless claims came in at 236,000, below the expected 245,000. Separately, wholesale prices rose 0.5% in April, above expectations.
Eight of 11 sectors in the S&P 500 ended in negative territory. Consumer Discretionary shares led the losses with Nordstrom (JWN -7.60%) down and Kohl’s (KSS -7.84%) also falling as quarterly revenue came in below Street forecasts. In M&A news, Straight Path Communications (STRP -20.41%) pulled back after announcing a deal to be purchased by Verizon (VZ -0.78%) for $184/share in stock. Elsewhere in earnings, Snap Inc (SNAP -21.45%) fell as the company reported a wider-than-expected loss for its first quarterly report since going public in March. Whole Foods (WFM +2.15%) was a notable gainer after the grocer increased its quarterly dividend by 29%.
Treasuries advanced with the benchmark 10-year note up 3/32 to yield 2.39%. In commodities, NYMEX WTI crude added 1.1% to $47.83/barrel. COMEX gold gained 0.5% to $1224.90/ounce. |
 Kenneth J. Gruneisen started out as a licensed stockbroker in August 1987, a couple of months prior to the historic stock market crash that took the Dow Jones Industrial Average down -22.6% in a single day. He has published daily fact-based fundamental and technical analysis on high-ranked stocks online for two decades. Through FACTBASEDINVESTING.COM, Kenneth provides educational articles, news, market commentary, and other information regarding proven investment systems that work in good times and bad.
Comments contained in the body of this report are technical opinions only and are not necessarily those of Gruneisen Growth Corp. The material herein has been obtained from sources believed to be reliable and accurate, however, its accuracy and completeness cannot be guaranteed. Our firm, employees, and customers may effect transactions, including transactions contrary to any recommendation herein, or have positions in the securities mentioned herein or options with respect thereto. Any recommendation contained in this report may not be suitable for all investors and it is not to be deemed an offer or solicitation on our part with respect to the purchase or sale of any securities. |
|
 |
Retail, Financial, Networking, and Energy-Linked Groups Fell
Kenneth J. Gruneisen - Passed the CAN SLIM® Master's Exam
The Retail Index ($RLX -1.16%) and financial indexes weighed on the major averages on Thursday as the Broker/Dealer Index ($XBD -0.91%) and the Bank Index ($BKX -0.76%) ended the session lower. Commodity-linked groups were mixed as the Gold & Silver index ($XAU +2.86%) rose but the Integrated Oil Index ($XOI -0.22%) and the Oil Services Index ($OSX -0.92%) both ended lower. The tech sector was mixed as the Networking Index ($NWX -0.48%) edged lower and the Semiconductor Index ($SOX +0.34%) posted a solid gain while the Biotechnology Index ($BTK +0.01%) finished flat. Charts courtesy www.stockcharts.com
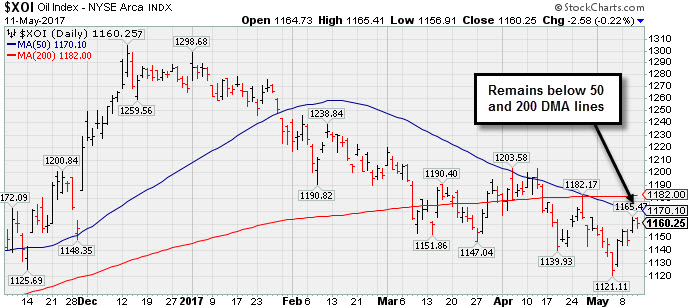 PICTURED: The Integrated Oil Index ($XOI -0.22%) remains below its 50-day and 200-day moving average (DMA) lines.
| Oil Services |
$OSX |
150.30 |
-1.39 |
-0.92% |
-18.22% |
| Integrated Oil |
$XOI |
1,160.25 |
-2.58 |
-0.22% |
-8.50% |
| Semiconductor |
$SOX |
1,042.43 |
+3.51 |
+0.34% |
+15.00% |
| Networking |
$NWX |
445.45 |
-2.14 |
-0.48% |
-0.14% |
| Broker/Dealer |
$XBD |
215.10 |
-1.98 |
-0.91% |
+4.78% |
| Retail |
$RLX |
1,512.71 |
-17.68 |
-1.16% |
+12.64% |
| Gold & Silver |
$XAU |
83.84 |
+2.33 |
+2.86% |
+6.31% |
| Bank |
$BKX |
91.89 |
-0.70 |
-0.76% |
+0.11% |
| Biotech |
$BTK |
3,582.95 |
+0.29 |
+0.01% |
+16.52% |
|
|
|
 |
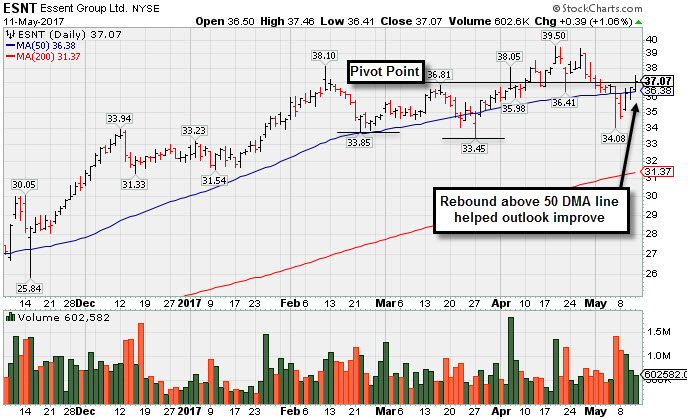
Rebound Above 50-Day Moving Average Helped Outlook
Kenneth J. Gruneisen - Passed the CAN SLIM® Master's Exam
Essent Group Ltd (ESNT +$0.39 or +1.06% to $37.07) posted a small gain with below average volume today. It found prompt support after recent volume-driven losses violated its 50-day moving average (DMA) line triggering a technical sell signal. The gains and close above the 50 DMA line ($36.38) helped its outlook improve, and its color code has been changed to yellow.
ESNT was first highlighted in yellow with pivot point cited based on its 12/12/16 high plus 10 cents in the 1/25/17 mid-day report (read here). It was last shown in this FSU section on 4/10/17 with an annotated graph under the headline, "Quiet Volume Behind Gain for New High Close".
The high-ranked Finance-Mrtg and Rel Svc firm's quarterly earnings have been above the +25% minimum guideline (C criteria) and sales revenues increases in comparisons through Mar '17 have been strong. Its annual earnings (A criteria) history has been good since its $17 IPO on 10/31/13. It completed a new Public Offering on 11/19/14.
The number of top-rated funds owning its shares rose from 317 in Mar '16 to 421 in Mar '17, a reassuring sign concerning the I criteria. Its current Up/Down Volume Ratio of 1.1 is an unbiased indication its shares have been under slight accumulation over the past 50 days.
|
|
|
Color Codes Explained :
Y - Better candidates highlighted by our
staff of experts.
G - Previously featured
in past reports as yellow but may no longer be buyable under the
guidelines.
***Last / Change / Volume data in this table is the closing quote data***
Symbol/Exchange
Company Name
Industry Group |
PRICE |
CHANGE
(%Change) |
Day High |
Volume
(% DAV)
(% 50 day avg vol) |
52 Wk Hi
% From Hi |
Featured
Date |
Price
Featured |
Pivot Featured |
|
Max Buy |
SBCF
-
NASDAQ
Seacoast Banking Corp Fl
BANKING - Regional - Mid-Atlantic Banks
|
$23.28
|
-0.70
-2.92% |
$23.86
|
402,622
123.88% of 50 DAV
50 DAV is 325,000
|
$25.88
-10.05%
|
4/24/2017
|
$25.33
|
PP = $24.38
|
|
MB = $25.60
|
 Most Recent Note - 5/11/2017 5:09:41 PM
G - Slumped below its 50 DMA line ($23.80) with higher volume behind today's loss raising concerns, and its color code was changed to green. Recent gains above the pivot point lacked the above average volume needed to trigger a proper new (or add-on) technical buy signal. Recent low ($21.89 on 3/22/17) defines important support where violations would raise more serious concerns and trigger worrisome technical sell signals.
>>> FEATURED STOCK ARTICLE : Pullback Following Recent Gains With Unimpressive Volume - 4/27/2017 |
View all notes |
Set NEW NOTE alert |
Company Profile |
SEC
News |
Chart |
Request a new note
C
A
S
I |
CSFL
-
NASDAQ
Centerstate Banks Inc
Banks-Southeast
|
$24.43
|
-0.73
-2.90% |
$25.08
|
328,187
102.24% of 50 DAV
50 DAV is 321,000
|
$26.94
-9.31%
|
3/13/2017
|
$25.54
|
PP = $26.40
|
|
MB = $27.72
|
Most Recent Note - 5/11/2017 5:11:09 PM
G - Slumped below its 50 DMA line ($25.27) with higher (near average ) volume behind its loss raising concerns and its color code is changed to green. Reported earnings +10% on +13% sales revenues for the Mar '17 quarter, below the +25% minimum earnings guideline. Damaging losses below its recent low ($23.64 on 4/17/17) would raise more serious concerns.
>>> FEATURED STOCK ARTICLE : Positive Reversal After Intra-day Low Undercut Prior Lows - 4/17/2017 |
View all notes |
Set NEW NOTE alert |
Company Profile |
SEC
News |
Chart |
Request a new note
C
A
S
I |
HTHT
-
NASDAQ
China Lodging Group Ads
LEISURE - Lodging
|
$80.89
|
+5.72
7.61% |
$81.01
|
470,384
261.32% of 50 DAV
50 DAV is 180,000
|
$78.79
2.67%
|
9/29/2016
|
$46.12
|
PP = $47.82
|
|
MB = $50.21
|
Most Recent Note - 5/11/2017 5:15:40 PM
G - Finished near the session high after trading in a wide range today and spiking to a new all-time high, getting very extended from any sound base. Prior highs in the $64 area and its 50 DMA line define near term support to watch. Reported earnings +74% on +4% sales revenues for first quarter ended March 31, 2017.
>>> FEATURED STOCK ARTICLE : Support Shown Promptly After 50-Day Moving Average Violation - 4/19/2017 |
View all notes |
Set NEW NOTE alert |
Company Profile |
SEC
News |
Chart |
Request a new note
C
A
S
I |
BEAT
-
NASDAQ
BioTelemetry Inc
Medical-Services
|
$29.40
|
-0.35
-1.18% |
$29.95
|
497,967
97.07% of 50 DAV
50 DAV is 513,000
|
$34.00
-13.53%
|
2/14/2017
|
$25.10
|
PP = $24.55
|
|
MB = $25.78
|
Most Recent Note - 5/9/2017 10:29:36 AM
G - Halted its slide near its 50 DMA line ($28.67) after a damaging gap down and volume-driven loss on 5/04/17. The 5/04/17 low $26.50 defines important near-term support to watch. Reported earnings -20% on +15% sales revenues for the Mar '17 quarter versus the year ago period, raising fundamental concerns.
>>> FEATURED STOCK ARTICLE : Extended From Sound Base and Earnings Below +25% Guideline - 5/3/2017 |
View all notes |
Set NEW NOTE alert |
Company Profile |
SEC
News |
Chart |
Request a new note
C
A
S
I |
ULTA
-
NASDAQ
Ulta Beauty Inc
SPECIALTY RETAIL - Specialty Retail, Other
|
$299.91
|
+0.44
0.15% |
$300.42
|
502,396
76.58% of 50 DAV
50 DAV is 656,000
|
$301.40
-0.49%
|
5/5/2017
|
$293.17
|
PP = $289.37
|
|
MB = $303.84
|
Most Recent Note - 5/9/2017 6:26:11 PM
Y - Recent gains lacked great volume while rising above the new pivot point cited based on its 3/17/17 high plus 10 cents. Its current Relative Strength rank improved to 82, above the 80+ guideline for buy candidates. Prior highs near the $289 area define important support above its 50 DMA line ($283).
>>> FEATURED STOCK ARTICLE : Volume Totals Cooling Following Technical Breakout - 4/7/2017 |
View all notes |
Set NEW NOTE alert |
Company Profile |
SEC
News |
Chart |
Request a new note
C
A
S
I |
Symbol/Exchange
Company Name
Industry Group |
PRICE |
CHANGE
(%Change) |
Day High |
Volume
(% DAV)
(% 50 day avg vol) |
52 Wk Hi
% From Hi |
Featured
Date |
Price
Featured |
Pivot Featured |
|
Max Buy |
ESNT
-
NYSE
Essent Group Ltd
Finance-MrtgandRel Svc
|
$37.07
|
+0.39
1.06% |
$37.46
|
578,226
83.80% of 50 DAV
50 DAV is 690,000
|
$39.50
-6.15%
|
4/4/2017
|
$36.38
|
PP = $36.81
|
|
MB = $38.65
|
Most Recent Note - 5/11/2017 5:07:54 PM
Y - Color code was changed to yellow after rebounding above its 50 DMA line ($36.38) helped its outlook improve. See the latest FSU analysis for more details and a new annotated graph.
>>> FEATURED STOCK ARTICLE : Rebound Above 50-Day Moving Average Helped Outlook - 5/11/2017 |
View all notes |
Set NEW NOTE alert |
Company Profile |
SEC
News |
Chart |
Request a new note
C
A
S
I |
VEEV
-
NYSE
Veeva Systems Inc Cl A
Computer Sftwr-Medical
|
$56.01
|
-0.34
-0.60% |
$56.46
|
851,852
64.10% of 50 DAV
50 DAV is 1,329,000
|
$56.40
-0.69%
|
3/16/2017
|
$49.00
|
PP = $48.05
|
|
MB = $50.45
|
Most Recent Note - 5/10/2017 7:28:00 PM
G - Hit another new all-time high with today's gain backed by light volume, getting very extended from any sound base. Its 50 DMA line ($50.29) defines support above prior highs in the $47-48 area.
>>> FEATURED STOCK ARTICLE : Hovering Near High, Stubbornly Holding its Ground - 4/18/2017 |
View all notes |
Set NEW NOTE alert |
Company Profile |
SEC
News |
Chart |
Request a new note
C
A
S
I |
ANET
-
NYSE
Arista Networks Inc
TELECOMMUNICATIONS - Communication Equipment
|
$146.02
|
+0.59
0.41% |
$146.45
|
563,630
71.71% of 50 DAV
50 DAV is 786,000
|
$147.55
-1.04%
|
4/17/2017
|
$132.75
|
PP = $135.27
|
|
MB = $142.03
|
Most Recent Note - 5/8/2017 8:51:02 PM
G - Pulled back after hitting a new all-time high with a considerable volume-driven gain. See the latest FSU for more details and a new annotated graph.
>>> FEATURED STOCK ARTICLE : Bullish Technical Action Following Recent Earnings - 5/8/2017 |
View all notes |
Set NEW NOTE alert |
Company Profile |
SEC
News |
Chart |
Request a new note
C
A
S
I |
GRUB
-
NYSE
Grubhub Inc
COMPUTER SOFTWARE and SERVICES - Technical and System Software
|
$45.00
|
-0.01
-0.02% |
$45.30
|
1,208,577
47.88% of 50 DAV
50 DAV is 2,524,000
|
$46.84
-3.92%
|
4/28/2017
|
$44.22
|
PP = $44.68
|
|
MB = $46.91
|
Most Recent Note - 5/8/2017 10:19:47 AM
Y - Hitting a new 52-week high with today's 4th consecutive gain. A gain backed by at least +40% above average volume and strong close above the pivot point may clinch a technical buy signal.
>>> FEATURED STOCK ARTICLE : Hit New 52-Week High But Ended Near Session Low - 4/28/2017 |
View all notes |
Set NEW NOTE alert |
Company Profile |
SEC
News |
Chart |
Request a new note
C
A
S
I |
IBP
-
NYSE
Installed Building Prod
DIVERSIFIED SERVICES - Business/Management Services
|
$47.75
|
-0.05
-0.10% |
$47.80
|
85,001
56.67% of 50 DAV
50 DAV is 150,000
|
$55.45
-13.89%
|
4/17/2017
|
$51.75
|
PP = $53.10
|
|
MB = $55.76
|
Most Recent Note - 5/8/2017 12:36:41 PM
G - Slumping below its 50-day moving average (DMA) line ($51.36) with today's big loss on higher volume raising concerns. Reported earnings +35% on +33% sales revenues for the Mar '17 quarter, above the +25% minimum guideline (C criteria). Volume and volatility often increase near earnings news. See the latest FSU analysis for more details and an annotated graph.
>>> FEATURED STOCK ARTICLE : Due to Report Earnings Prior to Friday's Open - 5/4/2017 |
View all notes |
Set NEW NOTE alert |
Company Profile |
SEC
News |
Chart |
Request a new note
C
A
S
I |
Symbol/Exchange
Company Name
Industry Group |
PRICE |
CHANGE
(%Change) |
Day High |
Volume
(% DAV)
(% 50 day avg vol) |
52 Wk Hi
% From Hi |
Featured
Date |
Price
Featured |
Pivot Featured |
|
Max Buy |
NCOM
-
NASDAQ
National Commerce Corp
BANKING - Regional - Southeast Banks
|
$38.30
|
-0.55
-1.42% |
$38.55
|
19,750
59.85% of 50 DAV
50 DAV is 33,000
|
$40.00
-4.25%
|
4/25/2017
|
$38.95
|
PP = $40.09
|
|
MB = $42.09
|
Most Recent Note - 5/8/2017 10:15:36 AM
Y - Volume totals have been cooling while consolidating within close striking distance of its 52-week high. A gain above the pivot point backed by a minimum of +40% above average volume may trigger a technical buy signal.
>>> FEATURED STOCK ARTICLE : Challenging 52-Week High With Volume-Driven Gains - 4/26/2017 |
View all notes |
Set NEW NOTE alert |
Company Profile |
SEC
News |
Chart |
Request a new note
C
A
S
I |
INGN
-
NASDAQ
Inogen Inc
HEALTH SERVICES - Medical Instruments and Supplies
|
$83.30
|
-1.08
-1.28% |
$84.29
|
239,888
128.97% of 50 DAV
50 DAV is 186,000
|
$88.62
-6.00%
|
4/17/2017
|
$76.77
|
PP = $80.04
|
|
MB = $84.04
|
Most Recent Note - 5/10/2017 11:53:19 AM
Y - Trading in a wide intra-day range today after hitting a new all-time high. Reported earnings +125% on +22% sales revenues for the Mar '17 quarter, continuing its strong earnings track record. Recent gains above the pivot point lacked the minimum +40% above average volume needed to trigger a proper new (or add-on) technical buy signal. Prior highs in the $79 area define support along with its 50 DMA line ($77.35).
>>> FEATURED STOCK ARTICLE : Wedging Higher With Recent Gains Lacking Great Volume - 5/1/2017 |
View all notes |
Set NEW NOTE alert |
Company Profile |
SEC
News |
Chart |
Request a new note
C
A
S
I |
PLAY
-
NASDAQ
Dave & Buster's Ent Inc
Retail-Restaurants
|
$66.39
|
+0.11
0.17% |
$66.55
|
640,246
82.40% of 50 DAV
50 DAV is 777,000
|
$67.15
-1.13%
|
2/23/2017
|
$55.41
|
PP = $58.35
|
|
MB = $61.27
|
Most Recent Note - 5/8/2017 8:56:54 PM
G - Quietly perched at its all-time high. Its 50 DMA line ($60.72) defines near-term support to watch on pullbacks. Latest quarter was below the +25% minimum guideline (C criteria), raising fundamental concerns.
>>> FEATURED STOCK ARTICLE : New Record High With Solid Gain on Near Average Volume - 5/2/2017 |
View all notes |
Set NEW NOTE alert |
Company Profile |
SEC
News |
Chart |
Request a new note
C
A
S
I |
OLLI
-
NASDAQ
Ollie's Bargain Outlet
Retail-DiscountandVariety
|
$39.75
|
-0.25
-0.63% |
$40.05
|
522,040
85.86% of 50 DAV
50 DAV is 608,000
|
$41.30
-3.75%
|
3/27/2017
|
$32.80
|
PP = $33.55
|
|
MB = $35.23
|
Most Recent Note - 5/9/2017 6:23:04 PM
G - Suffered a second consecutive loss today following a "negative reversal" after touching a new all-time high. Very extended from any sound base. Reported earnings +22% on +16% sales revenues for the Jan '17 quarter, below the +25% minimum earnings guideline (C criteria), raising fundamental concerns. Its 50 DMA line ($34.39) and prior highs in the $33 area define near-term support to watch.
>>> FEATURED STOCK ARTICLE : Winning Streak Continues for Discount Retailer - 4/24/2017 |
View all notes |
Set NEW NOTE alert |
Company Profile |
SEC
News |
Chart |
Request a new note
C
A
S
I |
MOMO
-
NASDAQ
Momo Inc Ads Cl A
INTERNET - Content
|
$38.41
|
+0.19
0.50% |
$38.69
|
3,710,479
67.68% of 50 DAV
50 DAV is 5,482,000
|
$40.43
-5.00%
|
3/7/2017
|
$29.71
|
PP = $27.83
|
|
MB = $29.22
|
Most Recent Note - 5/9/2017 6:19:57 PM
G - Hovering near its all-time high, stubbornly holding its ground. Its 50 DMA line ($34.78) defines important near-term support to watch. See the latest FSU analysis for more details and a new annotated graph.
>>> FEATURED STOCK ARTICLE : Hovering Near Record High, Extended From Prior Base - 5/9/2017 |
View all notes |
Set NEW NOTE alert |
Company Profile |
SEC
News |
Chart |
Request a new note
C
A
S
I |
Symbol/Exchange
Company Name
Industry Group |
PRICE |
CHANGE
(%Change) |
Day High |
Volume
(% DAV)
(% 50 day avg vol) |
52 Wk Hi
% From Hi |
Featured
Date |
Price
Featured |
Pivot Featured |
|
Max Buy |
HLI
-
NYSE
Houlihan Lokey Inc Cl A
Finance-Invest Bnk/Bkrs
|
$34.93
|
-1.04
-2.89% |
$35.83
|
373,196
147.51% of 50 DAV
50 DAV is 253,000
|
$36.65
-4.69%
|
5/10/2017
|
$35.85
|
PP = $35.05
|
|
MB = $36.80
|
Most Recent Note - 5/11/2017 5:13:48 PM
Y - Pulled back today with a loss on above average volume slightly undercutting its pivot point, raising some concerns. Highlighted in the 5/10/17 mid-day report in yellow with pivot point cited based on its 3/31/17 high plus 10 cents. There was a "breakaway gap" and considerable gain today backed by +174% above average volume hitting new all-time highs and triggering a technical buy signal. Reported earnings +37% on +40% sales revenues for the Mar '17 quarter, and 3 of the past 4 quarterly comparisons were above the +25% minimum earning guideline (C criteria). Annual earnings growth (A criteria) history is a good match with the fact-based investment system's guidelines. See the latest FSU analysis for more details and an annotated graph.
>>> FEATURED STOCK ARTICLE : Breakaway Gap Followed Strong Earnings News - 5/10/2017 |
View all notes |
Set NEW NOTE alert |
Company Profile |
SEC
News |
Chart |
Request a new note
C
A
S
I |
|
|
|
THESE ARE NOT BUY RECOMMENDATIONS!
Comments contained in the body of this report are technical
opinions only. The material herein has been obtained
from sources believed to be reliable and accurate, however,
its accuracy and completeness cannot be guaranteed.
This site is not an investment advisor, hence it does
not endorse or recommend any securities or other investments.
Any recommendation contained in this report may not
be suitable for all investors and it is not to be deemed
an offer or solicitation on our part with respect to
the purchase or sale of any securities. All trademarks,
service marks and trade names appearing in this report
are the property of their respective owners, and are
likewise used for identification purposes only.
This report is a service available
only to active Paid Premium Members.
You may opt-out of receiving report notifications
at any time. Questions or comments may be submitted
by writing to Premium Membership Services 665 S.E. 10 Street, Suite 201 Deerfield Beach, FL 33441-5634 or by calling 1-800-965-8307
or 954-785-1121.
|
|
|