You are not logged in.
This means you
CAN ONLY VIEW reports that were published prior to Sunday, March 30, 2025.
You
MUST UPGRADE YOUR MEMBERSHIP if you want to see any current reports.
AFTER MARKET UPDATE - FRIDAY, MAY 12TH, 2017
Previous After Market Report Next After Market Report >>>
|
|
|
|
DOW |
-22.81 |
20,896.61 |
-0.11% |
|
Volume |
933,314,690 |
-8% |
|
Volume |
1,600,765,990 |
-10% |
|
NASDAQ |
+5.27 |
6,121.23 |
+0.09% |
|
Advancers |
1,250 |
43% |
|
Advancers |
1,185 |
42% |
|
S&P 500 |
-3.54 |
2,390.90 |
-0.15% |
|
Decliners |
1,643 |
57% |
|
Decliners |
1,635 |
58% |
|
Russell 2000 |
-7.43 |
1,382.77 |
-0.53% |
|
52 Wk Highs |
74 |
|
|
52 Wk Highs |
118 |
|
|
S&P 600 |
-6.48 |
838.54 |
-0.77% |
|
52 Wk Lows |
41 |
|
|
52 Wk Lows |
76 |
|
|
 |
Indices Ended Week Mixed as Tech Leadership Buoys Nasdaq
Kenneth J. Gruneisen - Passed the CAN SLIM® Master's Exam
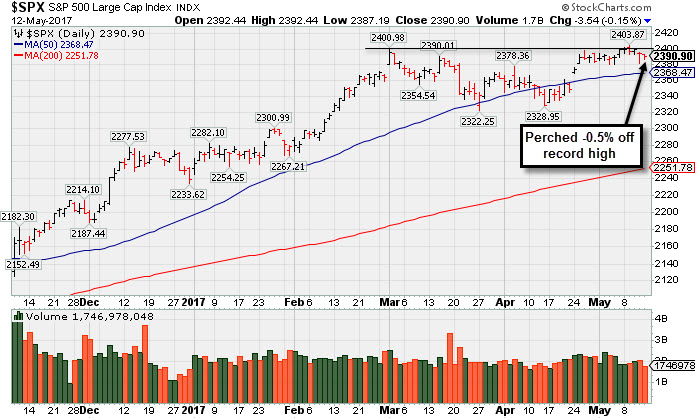
For the week, the Dow was down 0.5%, the S&P 500 lost 0.4%, and the Nasdaq gained 0.3%. Stocks declined on Friday. The Dow was down 22 points to 20896. The S&P 500 lost 3 points to 2390 and the Nasdaq Composite gained 5 points to 6121. The volume totals reported were lighter than the prior session totals on the NYSE and on the Nasdaq exchange. Breadth was negative as decliners led advancers by a 4-3 margin on the NYSE and on the Nasdaq exchange. There were 37 high-ranked companies from the Leaders List that made new 52-week highs and were listed on the BreakOuts Page, versus the total of 45 on the prior session. New 52-week highs totals contracted yet still outnumbered new 52-week lows on the NYSE and on the Nasdaq exchange. PICTURED: The benchmark S&P 500 Index is perched -0.5% off its record high.
The major averages' (M criteria) are in a confirmed uptrend, and there remains a healthy level of market leadership (number of high-ranked stocks hitting new highs). New buying efforts should be made only in stocks matching all of the fundamental and technical criteria of the fact-based investment system. The Featured Stocks Page lists noteworthy high-ranked leaders.
The major averages finished mostly lower as investors digested mixed economic data and disappointing earnings from retailers. On the data front, a gauge of inflation showed that consumer prices rose 0.2% in April, in-line with expectations. In a separate release, retail sales increased 0.4%, below estimates for a 0.6% gain. Finally, a University of Michigan report on consumer sentiment came in at 97.7. In the retail space, Nordstrom (JWN -10.84%) fell after posting a 0.8% decline in comparable-store sales.
Nine of 11 sectors in the S&P 500 ended in negative territory. Industrials led the losses with Acuity Brands (AYI -8.03%) falling. General Electric (GE -2.08%) fell after being the subject of negative analyst commentary. In the consumer space, J.C. Penney (JCP -13.99%) sank as same-store sales dropped 3.5% in the quarter. AstraZeneca (AZN +9.2%) rallied after its immunotherapy drug was shown to reduce the risk of death from lung cancer. In M&A news, Sprint (S +1.02%) amid preliminary talks with controlling shareholder SoftBank (SFTBY -2.13%) about merging with T-Mobile US (TMUS -0.40%).
Treasuries advanced with the benchmark 10-year note up 17/32 to yield 2.33%. In commodities, NYMEX WTI crude added 0.2% to $47.90/barrel. In FOREX, the Dollar Index fell 0.4%. |
 Kenneth J. Gruneisen started out as a licensed stockbroker in August 1987, a couple of months prior to the historic stock market crash that took the Dow Jones Industrial Average down -22.6% in a single day. He has published daily fact-based fundamental and technical analysis on high-ranked stocks online for two decades. Through FACTBASEDINVESTING.COM, Kenneth provides educational articles, news, market commentary, and other information regarding proven investment systems that work in good times and bad.
Comments contained in the body of this report are technical opinions only and are not necessarily those of Gruneisen Growth Corp. The material herein has been obtained from sources believed to be reliable and accurate, however, its accuracy and completeness cannot be guaranteed. Our firm, employees, and customers may effect transactions, including transactions contrary to any recommendation herein, or have positions in the securities mentioned herein or options with respect thereto. Any recommendation contained in this report may not be suitable for all investors and it is not to be deemed an offer or solicitation on our part with respect to the purchase or sale of any securities. |
|
 |
Biotech, Gold & Silver, Retail and Semiconductor Indexes Rose
Kenneth J. Gruneisen - Passed the CAN SLIM® Master's Exam
The Retail Index ($RLX +0.22%) edged higher while financial indexes weighed on the major averages on Friday as the Broker/Dealer Index ($XBD -0.63%) and the Bank Index ($BKX -0.47%) both ended the session lower. Commodity-linked groups were mixed as the Gold & Silver index ($XAU +1.35%) rose but the Integrated Oil Index ($XOI +0.22%) posted a smaller gain and the Oil Services Index ($OSX -1.89%) ended lower. The tech sector was mixed as the Biotechnology Index ($BTK +1.02%) led and the Semiconductor Index ($SOX +0.27%) posted a small gain while the Networking Index ($NWX -0.19%) edged lower. Charts courtesy www.stockcharts.com
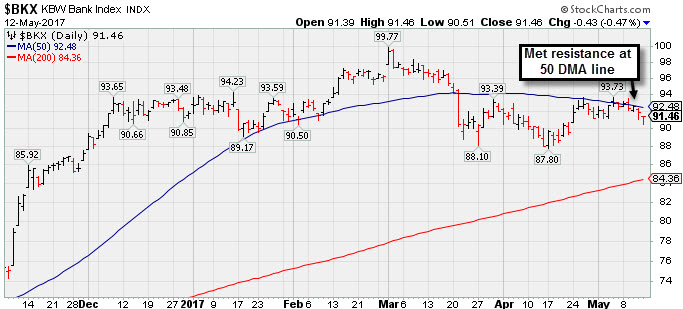 PICTURED: The Bank Index ($BKX -0.47%) recently met resistance at its 50-day moving average (DMA) line.
| Oil Services |
$OSX |
147.46 |
-2.84 |
-1.89% |
-19.77% |
| Integrated Oil |
$XOI |
1,162.80 |
+2.55 |
+0.22% |
-8.30% |
| Semiconductor |
$SOX |
1,045.24 |
+2.81 |
+0.27% |
+15.31% |
| Networking |
$NWX |
444.59 |
-0.87 |
-0.19% |
-0.34% |
| Broker/Dealer |
$XBD |
213.75 |
-1.35 |
-0.63% |
+4.13% |
| Retail |
$RLX |
1,515.99 |
+3.28 |
+0.22% |
+12.88% |
| Gold & Silver |
$XAU |
84.97 |
+1.13 |
+1.35% |
+7.75% |
| Bank |
$BKX |
91.46 |
-0.43 |
-0.47% |
-0.36% |
| Biotech |
$BTK |
3,621.43 |
+38.48 |
+1.07% |
+17.77% |
|
|
|
 |
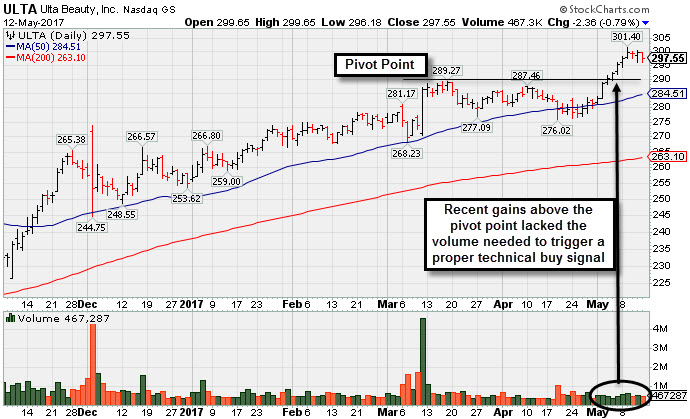
Holding Ground After Recent Gains Lacking Great Volume
Kenneth J. Gruneisen - Passed the CAN SLIM® Master's Exam
Ulta Beauty Inc's (ULTA -$2.36 or -0.79% to $297.55) volume totals have been cooling while stubbornly holding its ground near all-time highs. Recent gains lacked great volume while rising above the new pivot point cited based on its 3/17/17 high plus 10 cents. Confirming gains backed by at least +40% above average volume would trigger a proper new (or add-on) technical buy signal. /
Prior highs near the $289 area define important support above its 50 DMA line ($284.51). Subsequent losses leading to violations would raise concerns and trigger technical sell signals.
ULTA was shown in this FSU section on 4/07/17 with an annotated graph under the headline, "Volume Totals Cooling Following Technical Breakout". It was highlighted in the 3/06/17 mid-day report with a pivot point cited based on its 8/24/16 high plus 10 cents (read here). The volume-driven gain for new highs (N criteria) on 3/10/17 triggered a new technical buy signal.
Bullish action came after it reported Jan '17 quarterly earnings +33% on +25% sales revenues. Its prior earnings history satisfies the C and A criteria. ULTA reported earnings +27%, +39%, +24%, and +26% in the Jan, Apr, Jul, and Oct '16 quarterly comparisons, respectively. Its strong earnings were underpinned by steady sales revenues increases in the +21-22% range during that span of time. Its solid annual earnings (A criteria) history is very reassuring.
It still has a small supply (S criteria) of only 62.1 million shares outstanding. The number of top-rated funds with an ownership interest has grown from 566 funds in Jun '14 to 1,288 funds as of Mar '17, which is a very encouraging sign of increasing institutional interest (the I criteria). |
|
|
Color Codes Explained :
Y - Better candidates highlighted by our
staff of experts.
G - Previously featured
in past reports as yellow but may no longer be buyable under the
guidelines.
***Last / Change / Volume data in this table is the closing quote data***
Symbol/Exchange
Company Name
Industry Group |
PRICE |
CHANGE
(%Change) |
Day High |
Volume
(% DAV)
(% 50 day avg vol) |
52 Wk Hi
% From Hi |
Featured
Date |
Price
Featured |
Pivot Featured |
|
Max Buy |
SBCF
-
NASDAQ
Seacoast Banking Corp Fl
BANKING - Regional - Mid-Atlantic Banks
|
$23.23
|
-0.05
-0.21% |
$23.26
|
303,424
93.36% of 50 DAV
50 DAV is 325,000
|
$25.88
-10.24%
|
4/24/2017
|
$25.33
|
PP = $24.38
|
|
MB = $25.60
|
Most Recent Note - 5/11/2017 5:09:41 PM
G - Slumped below its 50 DMA line ($23.80) with higher volume behind today's loss raising concerns, and its color code was changed to green. Recent gains above the pivot point lacked the above average volume needed to trigger a proper new (or add-on) technical buy signal. Recent low ($21.89 on 3/22/17) defines important support where violations would raise more serious concerns and trigger worrisome technical sell signals.
>>> FEATURED STOCK ARTICLE : Pullback Following Recent Gains With Unimpressive Volume - 4/27/2017 |
View all notes |
Set NEW NOTE alert |
Company Profile |
SEC
News |
Chart |
Request a new note
C
A
S
I |
CSFL
-
NASDAQ
Centerstate Banks Inc
Banks-Southeast
|
$24.59
|
+0.16
0.65% |
$24.66
|
503,866
156.00% of 50 DAV
50 DAV is 323,000
|
$26.94
-8.71%
|
3/13/2017
|
$25.54
|
PP = $26.40
|
|
MB = $27.72
|
Most Recent Note - 5/11/2017 5:11:09 PM
G - Slumped below its 50 DMA line ($25.27) with higher (near average ) volume behind its loss raising concerns and its color code is changed to green. Reported earnings +10% on +13% sales revenues for the Mar '17 quarter, below the +25% minimum earnings guideline. Damaging losses below its recent low ($23.64 on 4/17/17) would raise more serious concerns.
>>> FEATURED STOCK ARTICLE : Positive Reversal After Intra-day Low Undercut Prior Lows - 4/17/2017 |
View all notes |
Set NEW NOTE alert |
Company Profile |
SEC
News |
Chart |
Request a new note
C
A
S
I |
HTHT
-
NASDAQ
China Lodging Group Ads
LEISURE - Lodging
|
$74.98
|
-5.91
-7.31% |
$80.68
|
627,238
337.22% of 50 DAV
50 DAV is 186,000
|
$81.01
-7.44%
|
9/29/2016
|
$46.12
|
PP = $47.82
|
|
MB = $50.21
|
 Most Recent Note - 5/12/2017 1:51:17 PM
G - Retreating today after spiking to a new all-time high on the prior session. Very extended from any sound base. Prior highs in the $64 area and its 50 DMA line define near term support to watch. Reported earnings +74% on +4% sales revenues for first quarter ended March 31, 2017.
>>> FEATURED STOCK ARTICLE : Support Shown Promptly After 50-Day Moving Average Violation - 4/19/2017 |
View all notes |
Set NEW NOTE alert |
Company Profile |
SEC
News |
Chart |
Request a new note
C
A
S
I |
BEAT
-
NASDAQ
BioTelemetry Inc
Medical-Services
|
$28.15
|
-1.25
-4.25% |
$29.85
|
588,560
114.95% of 50 DAV
50 DAV is 512,000
|
$34.00
-17.21%
|
2/14/2017
|
$25.10
|
PP = $24.55
|
|
MB = $25.78
|
Most Recent Note - 5/12/2017 2:17:49 PM
G - Slumping below its 50 DMA line ($29) again raising concerns with today's 3rd consecutive loss. The 5/04/17 low $26.50 defines important near-term support to watch. Reported earnings -20% on +15% sales revenues for the Mar '17 quarter versus the year ago period, raising fundamental concerns.
>>> FEATURED STOCK ARTICLE : Extended From Sound Base and Earnings Below +25% Guideline - 5/3/2017 |
View all notes |
Set NEW NOTE alert |
Company Profile |
SEC
News |
Chart |
Request a new note
C
A
S
I |
ULTA
-
NASDAQ
Ulta Beauty Inc
SPECIALTY RETAIL - Specialty Retail, Other
|
$297.55
|
-2.36
-0.79% |
$299.65
|
467,287
71.45% of 50 DAV
50 DAV is 654,000
|
$301.40
-1.28%
|
5/5/2017
|
$293.17
|
PP = $289.37
|
|
MB = $303.84
|
Most Recent Note - 5/12/2017 6:19:07 PM
Y - Volume totals have been cooling while stubbornly holding its ground near all-time highs. Recent gains lacked great volume while rising above the new pivot point cited based on its 3/17/17 high plus 10 cents. Prior highs near the $289 area define important support above its 50 DMA line ($284.51). See the latest FSU analysis for more details and a new annotated graph.
>>> FEATURED STOCK ARTICLE : Holding Ground After Recent Gains Lacking Great Volume - 5/12/2017 |
View all notes |
Set NEW NOTE alert |
Company Profile |
SEC
News |
Chart |
Request a new note
C
A
S
I |
Symbol/Exchange
Company Name
Industry Group |
PRICE |
CHANGE
(%Change) |
Day High |
Volume
(% DAV)
(% 50 day avg vol) |
52 Wk Hi
% From Hi |
Featured
Date |
Price
Featured |
Pivot Featured |
|
Max Buy |
ESNT
-
NYSE
Essent Group Ltd
Finance-MrtgandRel Svc
|
$36.72
|
-0.35
-0.94% |
$37.00
|
391,726
57.95% of 50 DAV
50 DAV is 676,000
|
$39.50
-7.04%
|
4/4/2017
|
$36.38
|
PP = $36.81
|
|
MB = $38.65
|
Most Recent Note - 5/11/2017 5:07:54 PM
Y - Color code was changed to yellow after rebounding above its 50 DMA line ($36.38) helped its outlook improve. See the latest FSU analysis for more details and a new annotated graph.
>>> FEATURED STOCK ARTICLE : Rebound Above 50-Day Moving Average Helped Outlook - 5/11/2017 |
View all notes |
Set NEW NOTE alert |
Company Profile |
SEC
News |
Chart |
Request a new note
C
A
S
I |
VEEV
-
NYSE
Veeva Systems Inc Cl A
Computer Sftwr-Medical
|
$56.34
|
+0.33
0.59% |
$56.69
|
575,471
45.46% of 50 DAV
50 DAV is 1,266,000
|
$56.46
-0.21%
|
3/16/2017
|
$49.00
|
PP = $48.05
|
|
MB = $50.45
|
Most Recent Note - 5/10/2017 7:28:00 PM
G - Hit another new all-time high with today's gain backed by light volume, getting very extended from any sound base. Its 50 DMA line ($50.29) defines support above prior highs in the $47-48 area.
>>> FEATURED STOCK ARTICLE : Hovering Near High, Stubbornly Holding its Ground - 4/18/2017 |
View all notes |
Set NEW NOTE alert |
Company Profile |
SEC
News |
Chart |
Request a new note
C
A
S
I |
ANET
-
NYSE
Arista Networks Inc
TELECOMMUNICATIONS - Communication Equipment
|
$146.82
|
+0.80
0.55% |
$147.15
|
476,818
60.97% of 50 DAV
50 DAV is 782,000
|
$147.55
-0.49%
|
4/17/2017
|
$132.75
|
PP = $135.27
|
|
MB = $142.03
|
Most Recent Note - 5/12/2017 2:24:36 PM
G - Inching to another new all-time high today while adding to a streak of small gains on light volume. Extended from any sound base. Its 50 DMA line ($133) defines near-term support to watch on pullbacks.
>>> FEATURED STOCK ARTICLE : Bullish Technical Action Following Recent Earnings - 5/8/2017 |
View all notes |
Set NEW NOTE alert |
Company Profile |
SEC
News |
Chart |
Request a new note
C
A
S
I |
GRUB
-
NYSE
Grubhub Inc
COMPUTER SOFTWARE and SERVICES - Technical and System Software
|
$44.91
|
-0.09
-0.20% |
$45.35
|
1,570,555
63.71% of 50 DAV
50 DAV is 2,465,000
|
$46.84
-4.11%
|
4/28/2017
|
$44.22
|
PP = $44.68
|
|
MB = $46.91
|
Most Recent Note - 5/12/2017 2:26:04 PM
Y - Hovering near its 52-week high with volume totals cooling while stubbornly holding its ground. A gain backed by at least +40% above average volume and strong close above the pivot point may clinch a technical buy signal.
>>> FEATURED STOCK ARTICLE : Hit New 52-Week High But Ended Near Session Low - 4/28/2017 |
View all notes |
Set NEW NOTE alert |
Company Profile |
SEC
News |
Chart |
Request a new note
C
A
S
I |
IBP
-
NYSE
Installed Building Prod
DIVERSIFIED SERVICES - Business/Management Services
|
$47.25
|
-0.50
-1.05% |
$47.55
|
68,689
47.05% of 50 DAV
50 DAV is 146,000
|
$55.45
-14.79%
|
4/17/2017
|
$51.75
|
PP = $53.10
|
|
MB = $55.76
|
Most Recent Note - 5/12/2017 2:28:15 PM
G - Failing to rebound after recently violating its 50-day moving average (DMA) line. Prior highs in the $44 area define the next support level. A rebound above the 50 DMA line ($51.32) is needed for its outlook to improve.
>>> FEATURED STOCK ARTICLE : Due to Report Earnings Prior to Friday's Open - 5/4/2017 |
View all notes |
Set NEW NOTE alert |
Company Profile |
SEC
News |
Chart |
Request a new note
C
A
S
I |
Symbol/Exchange
Company Name
Industry Group |
PRICE |
CHANGE
(%Change) |
Day High |
Volume
(% DAV)
(% 50 day avg vol) |
52 Wk Hi
% From Hi |
Featured
Date |
Price
Featured |
Pivot Featured |
|
Max Buy |
NCOM
-
NASDAQ
National Commerce Corp
BANKING - Regional - Southeast Banks
|
$37.90
|
-0.40
-1.04% |
$38.15
|
22,495
70.30% of 50 DAV
50 DAV is 32,000
|
$40.00
-5.25%
|
4/25/2017
|
$38.95
|
PP = $40.09
|
|
MB = $42.09
|
Most Recent Note - 5/12/2017 2:22:05 PM
Y - Pulling back near its 50 DMA line ($37.33) defining near-term support. Volume totals have been cooling while consolidating within close striking distance of its 52-week high. A gain above the pivot point backed by a minimum of +40% above average volume may trigger a technical buy signal.
>>> FEATURED STOCK ARTICLE : Challenging 52-Week High With Volume-Driven Gains - 4/26/2017 |
View all notes |
Set NEW NOTE alert |
Company Profile |
SEC
News |
Chart |
Request a new note
C
A
S
I |
INGN
-
NASDAQ
Inogen Inc
HEALTH SERVICES - Medical Instruments and Supplies
|
$82.01
|
-1.29
-1.55% |
$84.48
|
210,284
118.80% of 50 DAV
50 DAV is 177,000
|
$88.62
-7.45%
|
4/17/2017
|
$76.77
|
PP = $80.04
|
|
MB = $84.04
|
Most Recent Note - 5/10/2017 11:53:19 AM
Y - Trading in a wide intra-day range today after hitting a new all-time high. Reported earnings +125% on +22% sales revenues for the Mar '17 quarter, continuing its strong earnings track record. Recent gains above the pivot point lacked the minimum +40% above average volume needed to trigger a proper new (or add-on) technical buy signal. Prior highs in the $79 area define support along with its 50 DMA line ($77.35).
>>> FEATURED STOCK ARTICLE : Wedging Higher With Recent Gains Lacking Great Volume - 5/1/2017 |
View all notes |
Set NEW NOTE alert |
Company Profile |
SEC
News |
Chart |
Request a new note
C
A
S
I |
PLAY
-
NASDAQ
Dave & Buster's Ent Inc
Retail-Restaurants
|
$66.03
|
-0.36
-0.54% |
$66.50
|
424,994
54.70% of 50 DAV
50 DAV is 777,000
|
$67.15
-1.67%
|
2/23/2017
|
$55.41
|
PP = $58.35
|
|
MB = $61.27
|
Most Recent Note - 5/12/2017 2:30:32 PM
G - Volume totals have been cooling while stubbornly holding its ground near its all-time high. Its 50 DMA line ($61.44) defines near-term support to watch on pullbacks. Latest quarter was below the +25% minimum guideline (C criteria), raising fundamental concerns.
>>> FEATURED STOCK ARTICLE : New Record High With Solid Gain on Near Average Volume - 5/2/2017 |
View all notes |
Set NEW NOTE alert |
Company Profile |
SEC
News |
Chart |
Request a new note
C
A
S
I |
OLLI
-
NASDAQ
Ollie's Bargain Outlet
Retail-DiscountandVariety
|
$39.45
|
-0.30
-0.75% |
$39.55
|
658,517
107.78% of 50 DAV
50 DAV is 611,000
|
$41.30
-4.48%
|
3/27/2017
|
$32.80
|
PP = $33.55
|
|
MB = $35.23
|
Most Recent Note - 5/12/2017 2:29:35 PM
G - Sputtering since a "negative reversal" on 5/08/17 after touching a new all-time high. Very extended from any sound base. Reported earnings +22% on +16% sales revenues for the Jan '17 quarter, below the +25% minimum earnings guideline (C criteria), raising fundamental concerns. Its 50 DMA line ($34.86) and prior highs in the $33 area define near-term support to watch.
>>> FEATURED STOCK ARTICLE : Winning Streak Continues for Discount Retailer - 4/24/2017 |
View all notes |
Set NEW NOTE alert |
Company Profile |
SEC
News |
Chart |
Request a new note
C
A
S
I |
MOMO
-
NASDAQ
Momo Inc Ads Cl A
INTERNET - Content
|
$40.14
|
+1.73
4.50% |
$41.00
|
7,040,104
127.75% of 50 DAV
50 DAV is 5,511,000
|
$40.43
-0.72%
|
3/7/2017
|
$29.71
|
PP = $27.83
|
|
MB = $29.22
|
Most Recent Note - 5/12/2017 2:20:37 PM
G - Hitting a new all-time high with today's gain on higher volume following a consolidation in a very tight trading range. Its 50 DMA line ($35.50) defines important near-term support to watch.
>>> FEATURED STOCK ARTICLE : Hovering Near Record High, Extended From Prior Base - 5/9/2017 |
View all notes |
Set NEW NOTE alert |
Company Profile |
SEC
News |
Chart |
Request a new note
C
A
S
I |
Symbol/Exchange
Company Name
Industry Group |
PRICE |
CHANGE
(%Change) |
Day High |
Volume
(% DAV)
(% 50 day avg vol) |
52 Wk Hi
% From Hi |
Featured
Date |
Price
Featured |
Pivot Featured |
|
Max Buy |
HLI
-
NYSE
Houlihan Lokey Inc Cl A
Finance-Invest Bnk/Bkrs
|
$34.48
|
-0.45
-1.29% |
$35.07
|
205,477
84.56% of 50 DAV
50 DAV is 243,000
|
$36.65
-5.92%
|
5/10/2017
|
$35.85
|
PP = $35.05
|
|
MB = $36.80
|
Most Recent Note - 5/11/2017 5:13:48 PM
Y - Pulled back today with a loss on above average volume slightly undercutting its pivot point, raising some concerns. Highlighted in the 5/10/17 mid-day report in yellow with pivot point cited based on its 3/31/17 high plus 10 cents. There was a "breakaway gap" and considerable gain today backed by +174% above average volume hitting new all-time highs and triggering a technical buy signal. Reported earnings +37% on +40% sales revenues for the Mar '17 quarter, and 3 of the past 4 quarterly comparisons were above the +25% minimum earning guideline (C criteria). Annual earnings growth (A criteria) history is a good match with the fact-based investment system's guidelines. See the latest FSU analysis for more details and an annotated graph.
>>> FEATURED STOCK ARTICLE : Breakaway Gap Followed Strong Earnings News - 5/10/2017 |
View all notes |
Set NEW NOTE alert |
Company Profile |
SEC
News |
Chart |
Request a new note
C
A
S
I |
|
|
|
THESE ARE NOT BUY RECOMMENDATIONS!
Comments contained in the body of this report are technical
opinions only. The material herein has been obtained
from sources believed to be reliable and accurate, however,
its accuracy and completeness cannot be guaranteed.
This site is not an investment advisor, hence it does
not endorse or recommend any securities or other investments.
Any recommendation contained in this report may not
be suitable for all investors and it is not to be deemed
an offer or solicitation on our part with respect to
the purchase or sale of any securities. All trademarks,
service marks and trade names appearing in this report
are the property of their respective owners, and are
likewise used for identification purposes only.
This report is a service available
only to active Paid Premium Members.
You may opt-out of receiving report notifications
at any time. Questions or comments may be submitted
by writing to Premium Membership Services 665 S.E. 10 Street, Suite 201 Deerfield Beach, FL 33441-5634 or by calling 1-800-965-8307
or 954-785-1121.
|
|
|