You are not logged in.
This means you
CAN ONLY VIEW reports that were published prior to Thursday, March 20, 2025.
You
MUST UPGRADE YOUR MEMBERSHIP if you want to see any current reports.
AFTER MARKET UPDATE - WEDNESDAY, MAY 10TH, 2017
Previous After Market Report Next After Market Report >>>
|
|
|
|
DOW |
-32.67 |
20,943.11 |
-0.16% |
|
Volume |
953,374,320 |
-6% |
|
Volume |
1,912,809,170 |
+6% |
|
NASDAQ |
+8.55 |
6,129.14 |
+0.14% |
|
Advancers |
1,899 |
65% |
|
Advancers |
1,585 |
56% |
|
S&P 500 |
+2.71 |
2,399.63 |
+0.11% |
|
Decliners |
1,003 |
35% |
|
Decliners |
1,249 |
44% |
|
Russell 2000 |
+7.73 |
1,399.59 |
+0.56% |
|
52 Wk Highs |
114 |
|
|
52 Wk Highs |
164 |
|
|
S&P 600 |
+4.08 |
851.31 |
+0.48% |
|
52 Wk Lows |
23 |
|
|
52 Wk Lows |
73 |
|
|
 |
Breadth Positive While Indices Ended Mixed
Kenneth J. Gruneisen - Passed the CAN SLIM® Master's Exam
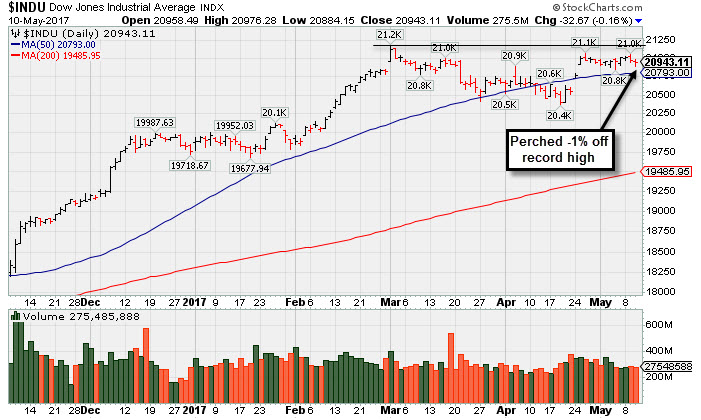
Stocks finished mixed on Wednesday. The Dow was down 32 points to 20943. The S&P 500 added 2 points to 2399 and the Nasdaq Composite gained 8 points to 6129. The volume totals reported were mixed, lighter than the prior session total on the NYSE and higher on the Nasdaq exchange. Breadth was positive as advancers led decliners by nearly a 2-1 margin on the NYSE while and 4-3 on the Nasdaq exchange. There were 62 high-ranked companies from the Leaders List that made new 52-week highs and were listed on the BreakOuts Page, versus the total of 63 on the prior session. New 52-week highs totals contracted yet solidly outnumbered new 52-week lows on the NYSE and on the Nasdaq exchange. PICTURED: The Dow Jones Industrial Average is consolidating -1% off its record high.
The major averages' (M criteria) are in a confirmed uptrend, and there has remains a healthy level of market leadership (number of high-ranked stocks hitting new highs). New buying efforts should be made only in stocks matching all of the fundamental and technical criteria of the fact-based investment system. The Featured Stocks Page lists noteworthy high-ranked leaders.
The major averages fluctuated on the session Wednesday after President Trump fired FBI Director James Comey. The reaction to Comey’s firing in the market was mostly subdued as a large number of investors believe tax reform will arrive in the near future. In contrast, some market participants speculate that Comey’s abrupt dismissal could delay key items in the administration’s agenda, including deregulation. On the data front, import prices rose 0.5% in April, above expectations.
Eight of 11 sectors in the S&P 500 ended in positive territory. Energy shares paced the gains with oil prices rebounding back above $47/barrel. Technology stocks outperformed with NVIDIA Corp (NVDA +17.83%) rallied amid strong demand for its flagship chip products. In the consumer space, Electronic Arts (EA +12.65%) rose after the video game maker reported better-than-expected quarterly profit. Disney (DIS -2.15%) fell as quarterly revenue fell below Street forecasts amid higher programming costs at ESPN. Industrials finished lower with Boeing (BA -2.00%) falling with news the company temporarily suspended its 737 Max flights due to an engine issue.
Treasuries finished lower with the benchmark 10-year note down 2/32 to yield 2.41%. In commodities, NYMEX WTI crude rallied 3.3% to $47.41/barrel. COMEX gold gained 0.3% to $1219.10/ounce. |
 Kenneth J. Gruneisen started out as a licensed stockbroker in August 1987, a couple of months prior to the historic stock market crash that took the Dow Jones Industrial Average down -22.6% in a single day. He has published daily fact-based fundamental and technical analysis on high-ranked stocks online for two decades. Through FACTBASEDINVESTING.COM, Kenneth provides educational articles, news, market commentary, and other information regarding proven investment systems that work in good times and bad.
Comments contained in the body of this report are technical opinions only and are not necessarily those of Gruneisen Growth Corp. The material herein has been obtained from sources believed to be reliable and accurate, however, its accuracy and completeness cannot be guaranteed. Our firm, employees, and customers may effect transactions, including transactions contrary to any recommendation herein, or have positions in the securities mentioned herein or options with respect thereto. Any recommendation contained in this report may not be suitable for all investors and it is not to be deemed an offer or solicitation on our part with respect to the purchase or sale of any securities. |
|
 |
Semiconductor Index and Commodity Linked Groups Led Gainers
Kenneth J. Gruneisen - Passed the CAN SLIM® Master's Exam
The Retail Index ($RLX -0.14%) edged lower while the Broker/Dealer Index ($XBD +0.16%) and the Bank Index ($BKX +0.19%) edged higher on Wednesday. Commodity-linked groups were positive as the Gold & Silver index ($XAU +1.64%), Integrated Oil Index ($XOI +1.32%) and the Oil Services Index ($OSX +1.60%) ended higher. The tech sector was mixed as the Biotechnology Index ($BTK -0.51%) and the Networking Index ($NWX -0.17%) edged lower and the Semiconductor Index ($SOX +2.11%) posted a solid gain. Charts courtesy www.stockcharts.com
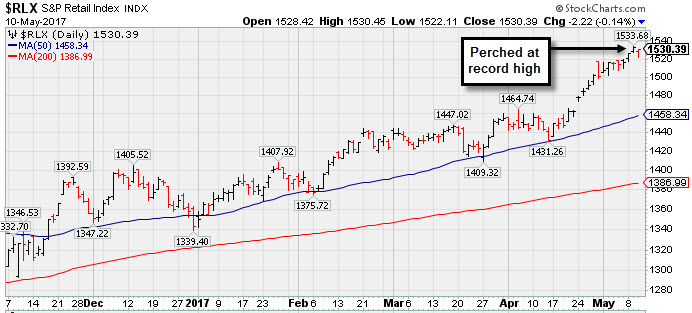 PICTURED: The Retail Index ($RLX -0.14%) is perched at a record high.
| Oil Services |
$OSX |
151.69 |
+2.38 |
+1.59% |
-17.47% |
| Integrated Oil |
$XOI |
1,162.83 |
+15.18 |
+1.32% |
-8.29% |
| Semiconductor |
$SOX |
1,038.92 |
+21.42 |
+2.11% |
+14.61% |
| Networking |
$NWX |
447.59 |
-0.77 |
-0.17% |
+0.33% |
| Broker/Dealer |
$XBD |
217.08 |
+0.35 |
+0.16% |
+5.75% |
| Retail |
$RLX |
1,530.39 |
-2.22 |
-0.14% |
+13.95% |
| Gold & Silver |
$XAU |
81.51 |
+1.31 |
+1.63% |
+3.36% |
| Bank |
$BKX |
92.60 |
+0.17 |
+0.18% |
+0.88% |
| Biotech |
$BTK |
3,582.66 |
-18.45 |
-0.51% |
+16.51% |
|
|
|
 |
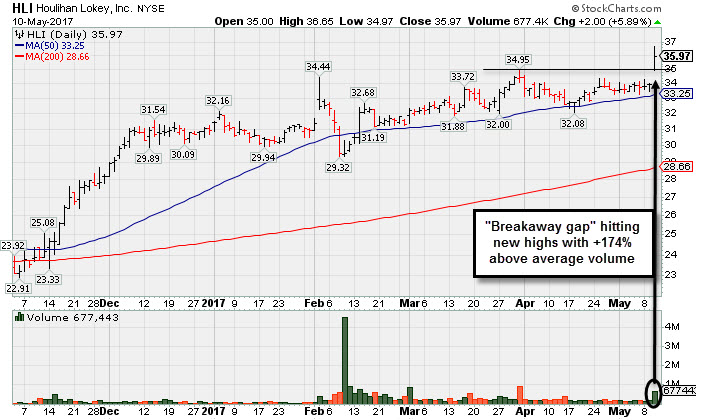
Breakaway Gap Followed Strong Earnings News
Kenneth J. Gruneisen - Passed the CAN SLIM® Master's Exam
Houlihan Lokey Inc (HLI +$2.00 or +5.89% to $35.97) was highlighted in yellow in the earlier mid-day report (read here) with pivot point cited based on its 3/31/17 high plus 10 cents after an orderly flat base. There was a "breakaway gap" today hitting new all-time highs with a considerable gain backed by +174% above average volume triggering a technical buy signal. Disciplined investors avoid chasing stocks that are extended more than +5% above their prior high or pivot point. Recently it found support near its 50-day moving average (DMA) line.
The high ranked Finance - Invest Bank//Broker firm reported earnings +37% on +40% sales revenues for the Mar '17 quarter, and 3 of the past 4 quarterly comparisons were above the +25% minimum earning guideline (C criteria). Annual earnings growth (A criteria) history is a good match with the fact-based investment system's guidelines. It has an Earnings Per share rating of 96.
It has a Timeliness rating of B and a Sponsorship rating of C. The number of top-rated funds owning its shares rose from 165 in Jun '16 to 226 in Mar '17, a reassuring sign concerning the I criteria. Its small supply of only 18.6 million shares (S criteria) in the public float can contribute to greater price volatility in the event of institutional buying or selling.
|
|
|
Color Codes Explained :
Y - Better candidates highlighted by our
staff of experts.
G - Previously featured
in past reports as yellow but may no longer be buyable under the
guidelines.
***Last / Change / Volume data in this table is the closing quote data***
Symbol/Exchange
Company Name
Industry Group |
PRICE |
CHANGE
(%Change) |
Day High |
Volume
(% DAV)
(% 50 day avg vol) |
52 Wk Hi
% From Hi |
Featured
Date |
Price
Featured |
Pivot Featured |
|
Max Buy |
SBCF
-
NASDAQ
Seacoast Banking Corp Fl
BANKING - Regional - Mid-Atlantic Banks
|
$23.98
|
-0.25
-1.03% |
$24.33
|
145,218
42.59% of 50 DAV
50 DAV is 341,000
|
$25.88
-7.34%
|
4/24/2017
|
$25.33
|
PP = $24.38
|
|
MB = $25.60
|
Most Recent Note - 5/9/2017 10:17:25 AM
Y - Consolidating above its 50 DMA line ($23.81). Recent gains above the pivot point lacked the above average volume needed to trigger a proper new (or add-on) technical buy signal. Recent low ($21.89 on 3/22/17) defines important support where violations would raise more serious concerns and trigger worrisome technical sell signals.
>>> FEATURED STOCK ARTICLE : Pullback Following Recent Gains With Unimpressive Volume - 4/27/2017 |
View all notes |
Set NEW NOTE alert |
Company Profile |
SEC
News |
Chart |
Request a new note
C
A
S
I |
CSFL
-
NASDAQ
Centerstate Banks Inc
Banks-Southeast
|
$25.16
|
-0.16
-0.63% |
$25.38
|
246,951
76.93% of 50 DAV
50 DAV is 321,000
|
$26.94
-6.60%
|
3/13/2017
|
$25.54
|
PP = $26.40
|
|
MB = $27.72
|
Most Recent Note - 5/9/2017 10:15:34 AM
Y - Still consolidating near its 50 DMA line ($25.28). Reported earnings +10% on +13% sales revenues for the Mar '17 quarter, below the +25% minimum earnings guideline. Damaging losses below its recent low ($23.64 on 4/17/17) would raise more serious concerns.
>>> FEATURED STOCK ARTICLE : Positive Reversal After Intra-day Low Undercut Prior Lows - 4/17/2017 |
View all notes |
Set NEW NOTE alert |
Company Profile |
SEC
News |
Chart |
Request a new note
C
A
S
I |
HTHT
-
NASDAQ
China Lodging Group Ads
LEISURE - Lodging
|
$75.17
|
+0.34
0.45% |
$78.79
|
497,868
291.15% of 50 DAV
50 DAV is 171,000
|
$75.70
-0.70%
|
9/29/2016
|
$46.12
|
PP = $47.82
|
|
MB = $50.21
|
 Most Recent Note - 5/10/2017 11:50:37 AM
G - Hitting yet another new all-time high with today's 3rd consecutive gain, very extended from any sound base. Prior highs in the $64 area and its 50 DMA line define near term support to watch. Due to report earnings results for first quarter ended March 31, 2017 after the US market closes on May 10, 2017. The Sep and Dec '16 earnings were below the +25% minimum earnings guideline (C criteria), and its waning sales revenues growth rate was noted as a fundamental concern.
>>> FEATURED STOCK ARTICLE : Support Shown Promptly After 50-Day Moving Average Violation - 4/19/2017 |
View all notes |
Set NEW NOTE alert |
Company Profile |
SEC
News |
Chart |
Request a new note
C
A
S
I |
BEAT
-
NASDAQ
BioTelemetry Inc
Medical-Services
|
$29.75
|
-0.05
-0.17% |
$30.00
|
556,151
109.26% of 50 DAV
50 DAV is 509,000
|
$34.00
-12.50%
|
2/14/2017
|
$25.10
|
PP = $24.55
|
|
MB = $25.78
|
Most Recent Note - 5/9/2017 10:29:36 AM
G - Halted its slide near its 50 DMA line ($28.67) after a damaging gap down and volume-driven loss on 5/04/17. The 5/04/17 low $26.50 defines important near-term support to watch. Reported earnings -20% on +15% sales revenues for the Mar '17 quarter versus the year ago period, raising fundamental concerns.
>>> FEATURED STOCK ARTICLE : Extended From Sound Base and Earnings Below +25% Guideline - 5/3/2017 |
View all notes |
Set NEW NOTE alert |
Company Profile |
SEC
News |
Chart |
Request a new note
C
A
S
I |
ULTA
-
NASDAQ
Ulta Beauty Inc
SPECIALTY RETAIL - Specialty Retail, Other
|
$299.47
|
-0.10
-0.03% |
$299.92
|
432,503
65.93% of 50 DAV
50 DAV is 656,000
|
$301.40
-0.64%
|
5/5/2017
|
$293.17
|
PP = $289.37
|
|
MB = $303.84
|
Most Recent Note - 5/9/2017 6:26:11 PM
Y - Recent gains lacked great volume while rising above the new pivot point cited based on its 3/17/17 high plus 10 cents. Its current Relative Strength rank improved to 82, above the 80+ guideline for buy candidates. Prior highs near the $289 area define important support above its 50 DMA line ($283).
>>> FEATURED STOCK ARTICLE : Volume Totals Cooling Following Technical Breakout - 4/7/2017 |
View all notes |
Set NEW NOTE alert |
Company Profile |
SEC
News |
Chart |
Request a new note
C
A
S
I |
Symbol/Exchange
Company Name
Industry Group |
PRICE |
CHANGE
(%Change) |
Day High |
Volume
(% DAV)
(% 50 day avg vol) |
52 Wk Hi
% From Hi |
Featured
Date |
Price
Featured |
Pivot Featured |
|
Max Buy |
ESNT
-
NYSE
Essent Group Ltd
Finance-MrtgandRel Svc
|
$36.68
|
+0.41
1.13% |
$36.69
|
712,894
102.87% of 50 DAV
50 DAV is 693,000
|
$39.50
-7.14%
|
4/4/2017
|
$36.38
|
PP = $36.81
|
|
MB = $38.65
|
Most Recent Note - 5/9/2017 10:14:26 AM
G - Rebounding near its 50 DMA line today after recent volume-driven losses violated its 50 DMA line triggering a technical sell signal. A gain and close above the 50 DMA line ($36.31) would help its outlook improve.
>>> FEATURED STOCK ARTICLE : Quiet Volume Behind Gain for New High Close - 4/10/2017 |
View all notes |
Set NEW NOTE alert |
Company Profile |
SEC
News |
Chart |
Request a new note
C
A
S
I |
VEEV
-
NYSE
Veeva Systems Inc Cl A
Computer Sftwr-Medical
|
$56.35
|
+1.30
2.36% |
$56.40
|
970,275
72.03% of 50 DAV
50 DAV is 1,347,000
|
$55.53
1.48%
|
3/16/2017
|
$49.00
|
PP = $48.05
|
|
MB = $50.45
|
Most Recent Note - 5/10/2017 7:28:00 PM
G - Hit another new all-time high with today's gain backed by light volume, getting very extended from any sound base. Its 50 DMA line ($50.29) defines support above prior highs in the $47-48 area.
>>> FEATURED STOCK ARTICLE : Hovering Near High, Stubbornly Holding its Ground - 4/18/2017 |
View all notes |
Set NEW NOTE alert |
Company Profile |
SEC
News |
Chart |
Request a new note
C
A
S
I |
ANET
-
NYSE
Arista Networks Inc
TELECOMMUNICATIONS - Communication Equipment
|
$145.43
|
+0.50
0.34% |
$146.03
|
675,579
86.06% of 50 DAV
50 DAV is 785,000
|
$147.55
-1.44%
|
4/17/2017
|
$132.75
|
PP = $135.27
|
|
MB = $142.03
|
Most Recent Note - 5/8/2017 8:51:02 PM
G - Pulled back after hitting a new all-time high with a considerable volume-driven gain. See the latest FSU for more details and a new annotated graph.
>>> FEATURED STOCK ARTICLE : Bullish Technical Action Following Recent Earnings - 5/8/2017 |
View all notes |
Set NEW NOTE alert |
Company Profile |
SEC
News |
Chart |
Request a new note
C
A
S
I |
GRUB
-
NYSE
Grubhub Inc
COMPUTER SOFTWARE and SERVICES - Technical and System Software
|
$45.01
|
-0.34
-0.75% |
$45.48
|
2,099,988
83.04% of 50 DAV
50 DAV is 2,529,000
|
$46.84
-3.90%
|
4/28/2017
|
$44.22
|
PP = $44.68
|
|
MB = $46.91
|
Most Recent Note - 5/8/2017 10:19:47 AM
Y - Hitting a new 52-week high with today's 4th consecutive gain. A gain backed by at least +40% above average volume and strong close above the pivot point may clinch a technical buy signal.
>>> FEATURED STOCK ARTICLE : Hit New 52-Week High But Ended Near Session Low - 4/28/2017 |
View all notes |
Set NEW NOTE alert |
Company Profile |
SEC
News |
Chart |
Request a new note
C
A
S
I |
IBP
-
NYSE
Installed Building Prod
DIVERSIFIED SERVICES - Business/Management Services
|
$47.80
|
-0.20
-0.42% |
$48.20
|
148,156
96.21% of 50 DAV
50 DAV is 154,000
|
$55.45
-13.80%
|
4/17/2017
|
$51.75
|
PP = $53.10
|
|
MB = $55.76
|
Most Recent Note - 5/8/2017 12:36:41 PM
G - Slumping below its 50-day moving average (DMA) line ($51.36) with today's big loss on higher volume raising concerns. Reported earnings +35% on +33% sales revenues for the Mar '17 quarter, above the +25% minimum guideline (C criteria). Volume and volatility often increase near earnings news. See the latest FSU analysis for more details and an annotated graph.
>>> FEATURED STOCK ARTICLE : Due to Report Earnings Prior to Friday's Open - 5/4/2017 |
View all notes |
Set NEW NOTE alert |
Company Profile |
SEC
News |
Chart |
Request a new note
C
A
S
I |
Symbol/Exchange
Company Name
Industry Group |
PRICE |
CHANGE
(%Change) |
Day High |
Volume
(% DAV)
(% 50 day avg vol) |
52 Wk Hi
% From Hi |
Featured
Date |
Price
Featured |
Pivot Featured |
|
Max Buy |
NCOM
-
NASDAQ
National Commerce Corp
BANKING - Regional - Southeast Banks
|
$38.85
|
-0.40
-1.02% |
$39.40
|
24,349
73.78% of 50 DAV
50 DAV is 33,000
|
$40.00
-2.88%
|
4/25/2017
|
$38.95
|
PP = $40.09
|
|
MB = $42.09
|
Most Recent Note - 5/8/2017 10:15:36 AM
Y - Volume totals have been cooling while consolidating within close striking distance of its 52-week high. A gain above the pivot point backed by a minimum of +40% above average volume may trigger a technical buy signal.
>>> FEATURED STOCK ARTICLE : Challenging 52-Week High With Volume-Driven Gains - 4/26/2017 |
View all notes |
Set NEW NOTE alert |
Company Profile |
SEC
News |
Chart |
Request a new note
C
A
S
I |
INGN
-
NASDAQ
Inogen Inc
HEALTH SERVICES - Medical Instruments and Supplies
|
$84.38
|
+0.61
0.73% |
$88.62
|
449,413
244.25% of 50 DAV
50 DAV is 184,000
|
$85.94
-1.82%
|
4/17/2017
|
$76.77
|
PP = $80.04
|
|
MB = $84.04
|
Most Recent Note - 5/10/2017 11:53:19 AM
Y - Trading in a wide intra-day range today after hitting a new all-time high. Reported earnings +125% on +22% sales revenues for the Mar '17 quarter, continuing its strong earnings track record. Recent gains above the pivot point lacked the minimum +40% above average volume needed to trigger a proper new (or add-on) technical buy signal. Prior highs in the $79 area define support along with its 50 DMA line ($77.35).
>>> FEATURED STOCK ARTICLE : Wedging Higher With Recent Gains Lacking Great Volume - 5/1/2017 |
View all notes |
Set NEW NOTE alert |
Company Profile |
SEC
News |
Chart |
Request a new note
C
A
S
I |
PLAY
-
NASDAQ
Dave & Buster's Ent Inc
Retail-Restaurants
|
$66.28
|
-0.41
-0.61% |
$67.15
|
415,940
53.19% of 50 DAV
50 DAV is 782,000
|
$66.89
-0.91%
|
2/23/2017
|
$55.41
|
PP = $58.35
|
|
MB = $61.27
|
Most Recent Note - 5/8/2017 8:56:54 PM
G - Quietly perched at its all-time high. Its 50 DMA line ($60.72) defines near-term support to watch on pullbacks. Latest quarter was below the +25% minimum guideline (C criteria), raising fundamental concerns.
>>> FEATURED STOCK ARTICLE : New Record High With Solid Gain on Near Average Volume - 5/2/2017 |
View all notes |
Set NEW NOTE alert |
Company Profile |
SEC
News |
Chart |
Request a new note
C
A
S
I |
OLLI
-
NASDAQ
Ollie's Bargain Outlet
Retail-DiscountandVariety
|
$40.00
|
+0.55
1.39% |
$40.15
|
468,666
76.83% of 50 DAV
50 DAV is 610,000
|
$41.30
-3.15%
|
3/27/2017
|
$32.80
|
PP = $33.55
|
|
MB = $35.23
|
Most Recent Note - 5/9/2017 6:23:04 PM
G - Suffered a second consecutive loss today following a "negative reversal" after touching a new all-time high. Very extended from any sound base. Reported earnings +22% on +16% sales revenues for the Jan '17 quarter, below the +25% minimum earnings guideline (C criteria), raising fundamental concerns. Its 50 DMA line ($34.39) and prior highs in the $33 area define near-term support to watch.
>>> FEATURED STOCK ARTICLE : Winning Streak Continues for Discount Retailer - 4/24/2017 |
View all notes |
Set NEW NOTE alert |
Company Profile |
SEC
News |
Chart |
Request a new note
C
A
S
I |
MOMO
-
NASDAQ
Momo Inc Ads Cl A
INTERNET - Content
|
$38.22
|
-0.36
-0.93% |
$38.52
|
6,067,376
112.46% of 50 DAV
50 DAV is 5,395,000
|
$40.43
-5.47%
|
3/7/2017
|
$29.71
|
PP = $27.83
|
|
MB = $29.22
|
Most Recent Note - 5/9/2017 6:19:57 PM
G - Hovering near its all-time high, stubbornly holding its ground. Its 50 DMA line ($34.78) defines important near-term support to watch. See the latest FSU analysis for more details and a new annotated graph.
>>> FEATURED STOCK ARTICLE : Hovering Near Record High, Extended From Prior Base - 5/9/2017 |
View all notes |
Set NEW NOTE alert |
Company Profile |
SEC
News |
Chart |
Request a new note
C
A
S
I |
Symbol/Exchange
Company Name
Industry Group |
PRICE |
CHANGE
(%Change) |
Day High |
Volume
(% DAV)
(% 50 day avg vol) |
52 Wk Hi
% From Hi |
Featured
Date |
Price
Featured |
Pivot Featured |
|
Max Buy |
HLI
-
NYSE
Houlihan Lokey Inc Cl A
Finance-Invest Bnk/Bkrs
|
$35.97
|
+2.00
5.89% |
$36.65
|
677,443
274.27% of 50 DAV
50 DAV is 247,000
|
$34.95
2.92%
|
5/10/2017
|
$35.85
|
PP = $35.05
|
|
MB = $36.80
|
Most Recent Note - 5/10/2017 7:26:42 PM
Y - Finished in the upper half of its intra-day range after highlighted in the earlier mid-day report in yellow with pivot point cited based on its 3/31/17 high plus 10 cents. There was a "breakaway gap" and considerable gain today backed by +174% above average volume hitting new all-time highs and triggering a technical buy signal. Reported earnings +37% on +40% sales revenues for the Mar '17 quarter, and 3 of the past 4 quarterly comparisons were above the +25% minimum earning guideline (C criteria). Annual earnings growth (A criteria) history is a good match with the fact-based investment system's guidelines. See the latest FSU analysis for more details and a new annotated graph.
>>> FEATURED STOCK ARTICLE : Breakaway Gap Followed Strong Earnings News - 5/10/2017 |
View all notes |
Set NEW NOTE alert |
Company Profile |
SEC
News |
Chart |
Request a new note
C
A
S
I |
|
|
|
THESE ARE NOT BUY RECOMMENDATIONS!
Comments contained in the body of this report are technical
opinions only. The material herein has been obtained
from sources believed to be reliable and accurate, however,
its accuracy and completeness cannot be guaranteed.
This site is not an investment advisor, hence it does
not endorse or recommend any securities or other investments.
Any recommendation contained in this report may not
be suitable for all investors and it is not to be deemed
an offer or solicitation on our part with respect to
the purchase or sale of any securities. All trademarks,
service marks and trade names appearing in this report
are the property of their respective owners, and are
likewise used for identification purposes only.
This report is a service available
only to active Paid Premium Members.
You may opt-out of receiving report notifications
at any time. Questions or comments may be submitted
by writing to Premium Membership Services 665 S.E. 10 Street, Suite 201 Deerfield Beach, FL 33441-5634 or by calling 1-800-965-8307
or 954-785-1121.
|
|
|