You are not logged in.
This means you
CAN ONLY VIEW reports that were published prior to Wednesday, March 26, 2025.
You
MUST UPGRADE YOUR MEMBERSHIP if you want to see any current reports.
AFTER MARKET UPDATE - TUESDAY, MAY 9TH, 2017
Previous After Market Report Next After Market Report >>>
|
|
|
|
DOW |
-36.50 |
20,975.78 |
-0.17% |
|
Volume |
1,011,477,900 |
-1% |
|
Volume |
1,813,010,470 |
+5% |
|
NASDAQ |
+17.93 |
6,120.59 |
+0.29% |
|
Advancers |
1,265 |
43% |
|
Advancers |
1,432 |
50% |
|
S&P 500 |
-2.46 |
2,396.92 |
-0.10% |
|
Decliners |
1,652 |
57% |
|
Decliners |
1,405 |
50% |
|
Russell 2000 |
+0.22 |
1,391.86 |
+0.02% |
|
52 Wk Highs |
189 |
|
|
52 Wk Highs |
213 |
|
|
S&P 600 |
+1.09 |
847.23 |
+0.13% |
|
52 Wk Lows |
40 |
|
|
52 Wk Lows |
86 |
|
|
 |
Tech Strength Helps Nasdaq Lead as Major Indices Ended Mixed
Kenneth J. Gruneisen - Passed the CAN SLIM® Master's Exam
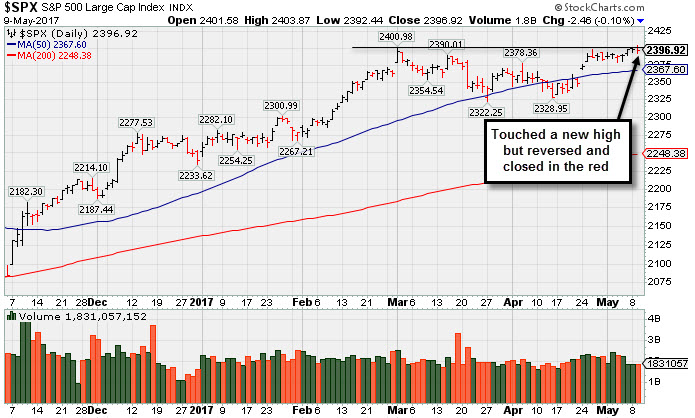
Stocks finished mostly lower on Tuesday. The Dow was down 36 points to 20975. The S&P 500 lost 2 points to 2396 and the Nasdaq Composite gained 17 points to 6120. The volume totals reported were mixed, lighter than the prior session total on the NYSE and higher on the Nasdaq exchange. Breadth was slightly negative as decliners led advancers by a 4-3 margin on the NYSE while the mix was nearly even on the Nasdaq exchange. There were 63 high-ranked companies from the Leaders List that made new 52-week highs and were listed on the BreakOuts Page, versus the total of 61 on the prior session. New 52-week highs totals expanded and solidly outnumbered new 52-week lows on the NYSE and on the Nasdaq exchange. PICTURED: The S&P 500 Index touched a new record high but reversed and closed the session in the red.
The major averages' (M criteria) are in a confirmed uptrend, and there has remains a healthy level of market leadership (number of high-ranked stocks hitting new highs). New buying efforts should be made only in stocks matching all of the fundamental and technical criteria of the fact-based investment system. The Featured Stocks Page lists noteworthy high-ranked leaders.
The major averages fluctuated on the session Tuesday as first-quarter earnings season nears its end. The post-election trend of rising equities attempted to regain momentum as most companies have reported better-than-expected quarterly results. Overall, an impressive 65% of reporting companies in the S&P 500 have topped revenue projections, while 78% have cleared expectations on the bottom line. On the data front, a Job Openings and Labor Turnover Survey revealed job openings increased to 5.7 million in March.
Seven of 11 sectors in the S&P 500 ended in negative territory. Energy shares underperformed with ConocoPhillips (COP -1.82%) down. Health Care stocks fluctuated with Allergan (AGN -1.42%) edging lower. Valeant Pharmaceuticals (VRX +24.10%) rallied as the Canadian drugmaker reported a profit for its latest quarter, compared to a year-ago loss. In the consumer space, Discovery Communications (DISCA -2.17%) fell as quarterly revenue came in below Street forecasts. Hertz Global (HTZ -14.15%) fell after posting a wider-than-expected quarterly loss. Marriott International (MAR +6.36%) rose as the hotel operator saw increased occupancy year-over-year.
Treasuries declined with the benchmark 10-year note down 3/32 to yield 2.40%. In commodities, NYMEX WTI crude lost 0.8% to $46.03/barrel. In FOREX, the Dollar Index gained 0.5%. |
 Kenneth J. Gruneisen started out as a licensed stockbroker in August 1987, a couple of months prior to the historic stock market crash that took the Dow Jones Industrial Average down -22.6% in a single day. He has published daily fact-based fundamental and technical analysis on high-ranked stocks online for two decades. Through FACTBASEDINVESTING.COM, Kenneth provides educational articles, news, market commentary, and other information regarding proven investment systems that work in good times and bad.
Comments contained in the body of this report are technical opinions only and are not necessarily those of Gruneisen Growth Corp. The material herein has been obtained from sources believed to be reliable and accurate, however, its accuracy and completeness cannot be guaranteed. Our firm, employees, and customers may effect transactions, including transactions contrary to any recommendation herein, or have positions in the securities mentioned herein or options with respect thereto. Any recommendation contained in this report may not be suitable for all investors and it is not to be deemed an offer or solicitation on our part with respect to the purchase or sale of any securities. |
|
 |
Retail and Tech Indices Rose
Kenneth J. Gruneisen - Passed the CAN SLIM® Master's Exam
The Retail Index ($RLX +0.44%) posted a small gain while the Broker/Dealer Index ($XBD -0.04%) ended slightly in the red and the Bank Index ($BKX -0.55%) edged lower on Tuesday. Commodity-linked groups were negative as the Gold & Silver index ($XAU -0.45%), Integrated Oil Index ($XOI -0.57%) and the Oil Services Index ($OSX -1.00%) ended lower. The tech sector had a positive bias as the Biotechnology Index ($BTK +1.34%), Semiconductor Index ($SOX +1.03%), and the Networking Index ($NWX +0.68%) posted gains. Charts courtesy www.stockcharts.com
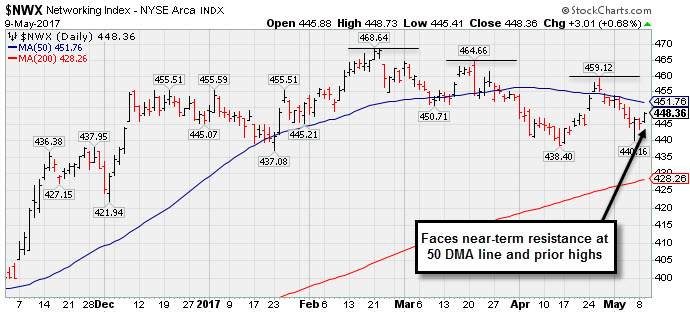 PICTURED: The Networking Index ($NWX +0.68%) faces near-term resistance at its 50-day moving average (DMA) line and prior highs.
| Oil Services |
$OSX |
149.31 |
-1.51 |
-1.00% |
-18.76% |
| Integrated Oil |
$XOI |
1,147.65 |
-6.54 |
-0.57% |
-9.49% |
| Semiconductor |
$SOX |
1,017.50 |
+10.34 |
+1.03% |
+12.25% |
| Networking |
$NWX |
448.36 |
+3.01 |
+0.68% |
+0.51% |
| Broker/Dealer |
$XBD |
216.73 |
-0.08 |
-0.04% |
+5.58% |
| Retail |
$RLX |
1,532.61 |
+6.71 |
+0.44% |
+14.12% |
| Gold & Silver |
$XAU |
80.20 |
-0.36 |
-0.45% |
+1.70% |
| Bank |
$BKX |
92.42 |
-0.52 |
-0.56% |
+0.69% |
| Biotech |
$BTK |
3,601.11 |
+47.72 |
+1.34% |
+17.11% |
|
|
|
 |
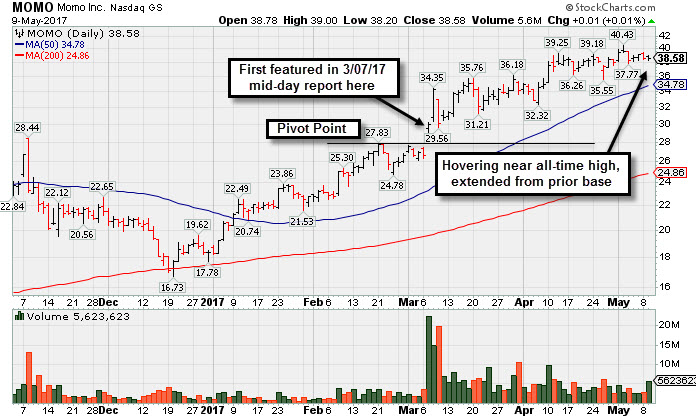
Hovering Near Record High, Extended From Prior Base
Kenneth J. Gruneisen - Passed the CAN SLIM® Master's Exam
Momo Inc Ads (MOMO +$0.01 or +0.01% to $38.58) is hovering near its all-time high, stubbornly holding its ground. Its 50-day moving average DMA line ($34.78) defines important near-term support to watch. Disciplined investors avoid chasing stocks extended more than +5% from a sound base pattern.
MOMO was last shown in this FSU section on 4/06/17 with an annotated graph under the headline, "Extended From Prior Base and Perched Near High". It was first highlighted in yellow in the 3/07/17 mid-day report (read here) with pivot point cited based on its 2/21/17 high after a cup-with-handle base.
Greatly improved sales and earnings in the Dec '16 quarter marked its 3rd consecutive comparison with very strong results versus the year ago periods. Limited history remains of some concern for this Chinese Internet - Content firm that completed its $14 IPO in Dec '14.
The number of top-rated funds owning its shares rose from 39 in Mar '16 to 114 in Mar '17, a reassuring sign concerning the I criteria. Its current Up/Down Volume Ratio of 2.0 is an unbiased indication its shares have been under accumulation over the past 50 days. It has a small supply (S criteria) of only 42.8 million shares in the public float.
|
|
|
Color Codes Explained :
Y - Better candidates highlighted by our
staff of experts.
G - Previously featured
in past reports as yellow but may no longer be buyable under the
guidelines.
***Last / Change / Volume data in this table is the closing quote data***
Symbol/Exchange
Company Name
Industry Group |
PRICE |
CHANGE
(%Change) |
Day High |
Volume
(% DAV)
(% 50 day avg vol) |
52 Wk Hi
% From Hi |
Featured
Date |
Price
Featured |
Pivot Featured |
|
Max Buy |
SBCF
-
NASDAQ
Seacoast Banking Corp Fl
BANKING - Regional - Mid-Atlantic Banks
|
$24.23
|
-0.02
-0.08% |
$24.56
|
208,645
59.27% of 50 DAV
50 DAV is 352,000
|
$25.88
-6.38%
|
4/24/2017
|
$25.33
|
PP = $24.38
|
|
MB = $25.60
|
 Most Recent Note - 5/9/2017 10:17:25 AM
Y - Consolidating above its 50 DMA line ($23.81). Recent gains above the pivot point lacked the above average volume needed to trigger a proper new (or add-on) technical buy signal. Recent low ($21.89 on 3/22/17) defines important support where violations would raise more serious concerns and trigger worrisome technical sell signals.
>>> FEATURED STOCK ARTICLE : Pullback Following Recent Gains With Unimpressive Volume - 4/27/2017 |
View all notes |
Set NEW NOTE alert |
Company Profile |
SEC
News |
Chart |
Request a new note
C
A
S
I |
CSFL
-
NASDAQ
Centerstate Banks Inc
Banks-Southeast
|
$25.32
|
-0.14
-0.55% |
$25.71
|
239,949
74.52% of 50 DAV
50 DAV is 322,000
|
$26.94
-6.00%
|
3/13/2017
|
$25.54
|
PP = $26.40
|
|
MB = $27.72
|
Most Recent Note - 5/9/2017 10:15:34 AM
Y - Still consolidating near its 50 DMA line ($25.28). Reported earnings +10% on +13% sales revenues for the Mar '17 quarter, below the +25% minimum earnings guideline. Damaging losses below its recent low ($23.64 on 4/17/17) would raise more serious concerns.
>>> FEATURED STOCK ARTICLE : Positive Reversal After Intra-day Low Undercut Prior Lows - 4/17/2017 |
View all notes |
Set NEW NOTE alert |
Company Profile |
SEC
News |
Chart |
Request a new note
C
A
S
I |
HTHT
-
NASDAQ
China Lodging Group Ads
LEISURE - Lodging
|
$74.83
|
+0.61
0.82% |
$75.70
|
247,383
147.25% of 50 DAV
50 DAV is 168,000
|
$74.35
0.65%
|
9/29/2016
|
$46.12
|
PP = $47.82
|
|
MB = $50.21
|
Most Recent Note - 5/9/2017 10:34:22 AM
G - Hitting yet another new all-time high today. Prior highs in the $64 area and its 50 DMA line define near term support to watch. Due to report earnings results for first quarter ended March 31, 2017 after the US market closes on May 10, 2017. The Sep and Dec '16 earnings were below the +25% minimum earnings guideline (C criteria), and its waning sales revenues growth rate was also noted recently as a fundamental concern.
>>> FEATURED STOCK ARTICLE : Support Shown Promptly After 50-Day Moving Average Violation - 4/19/2017 |
View all notes |
Set NEW NOTE alert |
Company Profile |
SEC
News |
Chart |
Request a new note
C
A
S
I |
BEAT
-
NASDAQ
BioTelemetry Inc
Medical-Services
|
$29.80
|
+1.05
3.65% |
$29.85
|
720,891
140.52% of 50 DAV
50 DAV is 513,000
|
$34.00
-12.35%
|
2/14/2017
|
$25.10
|
PP = $24.55
|
|
MB = $25.78
|
Most Recent Note - 5/9/2017 10:29:36 AM
G - Halted its slide near its 50 DMA line ($28.67) after a damaging gap down and volume-driven loss on 5/04/17. The 5/04/17 low $26.50 defines important near-term support to watch. Reported earnings -20% on +15% sales revenues for the Mar '17 quarter versus the year ago period, raising fundamental concerns.
>>> FEATURED STOCK ARTICLE : Extended From Sound Base and Earnings Below +25% Guideline - 5/3/2017 |
View all notes |
Set NEW NOTE alert |
Company Profile |
SEC
News |
Chart |
Request a new note
C
A
S
I |
ULTA
-
NASDAQ
Ulta Beauty Inc
SPECIALTY RETAIL - Specialty Retail, Other
|
$299.57
|
+2.03
0.68% |
$301.40
|
591,196
90.67% of 50 DAV
50 DAV is 652,000
|
$298.13
0.48%
|
5/5/2017
|
$293.17
|
PP = $289.37
|
|
MB = $303.84
|
Most Recent Note - 5/9/2017 6:26:11 PM
Y - Recent gains lacked great volume while rising above the new pivot point cited based on its 3/17/17 high plus 10 cents. Its current Relative Strength rank improved to 82, above the 80+ guideline for buy candidates. Prior highs near the $289 area define important support above its 50 DMA line ($283).
>>> FEATURED STOCK ARTICLE : Volume Totals Cooling Following Technical Breakout - 4/7/2017 |
View all notes |
Set NEW NOTE alert |
Company Profile |
SEC
News |
Chart |
Request a new note
C
A
S
I |
Symbol/Exchange
Company Name
Industry Group |
PRICE |
CHANGE
(%Change) |
Day High |
Volume
(% DAV)
(% 50 day avg vol) |
52 Wk Hi
% From Hi |
Featured
Date |
Price
Featured |
Pivot Featured |
|
Max Buy |
ESNT
-
NYSE
Essent Group Ltd
Finance-MrtgandRel Svc
|
$36.27
|
+1.51
4.34% |
$36.62
|
1,053,641
154.04% of 50 DAV
50 DAV is 684,000
|
$39.50
-8.18%
|
4/4/2017
|
$36.38
|
PP = $36.81
|
|
MB = $38.65
|
Most Recent Note - 5/9/2017 10:14:26 AM
G - Rebounding near its 50 DMA line today after recent volume-driven losses violated its 50 DMA line triggering a technical sell signal. A gain and close above the 50 DMA line ($36.31) would help its outlook improve.
>>> FEATURED STOCK ARTICLE : Quiet Volume Behind Gain for New High Close - 4/10/2017 |
View all notes |
Set NEW NOTE alert |
Company Profile |
SEC
News |
Chart |
Request a new note
C
A
S
I |
VEEV
-
NYSE
Veeva Systems Inc Cl A
Computer Sftwr-Medical
|
$55.05
|
-0.19
-0.34% |
$55.53
|
901,674
66.84% of 50 DAV
50 DAV is 1,349,000
|
$55.48
-0.78%
|
3/16/2017
|
$49.00
|
PP = $48.05
|
|
MB = $50.45
|
Most Recent Note - 5/8/2017 8:59:35 PM
G - Hit another new all-time high with today's 4th consecutive gain. Extended from any sound base. Its 50 DMA line ($49.82) defines support above prior highs in the $47-48 area.
>>> FEATURED STOCK ARTICLE : Hovering Near High, Stubbornly Holding its Ground - 4/18/2017 |
View all notes |
Set NEW NOTE alert |
Company Profile |
SEC
News |
Chart |
Request a new note
C
A
S
I |
ANET
-
NYSE
Arista Networks Inc
TELECOMMUNICATIONS - Communication Equipment
|
$144.93
|
+2.18
1.53% |
$145.58
|
692,536
88.45% of 50 DAV
50 DAV is 783,000
|
$147.55
-1.78%
|
4/17/2017
|
$132.75
|
PP = $135.27
|
|
MB = $142.03
|
Most Recent Note - 5/8/2017 8:51:02 PM
G - Pulled back after hitting a new all-time high with a considerable volume-driven gain. See the latest FSU for more details and a new annotated graph.
>>> FEATURED STOCK ARTICLE : Bullish Technical Action Following Recent Earnings - 5/8/2017 |
View all notes |
Set NEW NOTE alert |
Company Profile |
SEC
News |
Chart |
Request a new note
C
A
S
I |
GRUB
-
NYSE
Grubhub Inc
COMPUTER SOFTWARE and SERVICES - Technical and System Software
|
$45.35
|
+0.05
0.11% |
$45.87
|
1,576,910
61.62% of 50 DAV
50 DAV is 2,559,000
|
$46.84
-3.17%
|
4/28/2017
|
$44.22
|
PP = $44.68
|
|
MB = $46.91
|
Most Recent Note - 5/8/2017 10:19:47 AM
Y - Hitting a new 52-week high with today's 4th consecutive gain. A gain backed by at least +40% above average volume and strong close above the pivot point may clinch a technical buy signal.
>>> FEATURED STOCK ARTICLE : Hit New 52-Week High But Ended Near Session Low - 4/28/2017 |
View all notes |
Set NEW NOTE alert |
Company Profile |
SEC
News |
Chart |
Request a new note
C
A
S
I |
IBP
-
NYSE
Installed Building Prod
DIVERSIFIED SERVICES - Business/Management Services
|
$48.00
|
-0.05
-0.10% |
$48.10
|
247,948
150.27% of 50 DAV
50 DAV is 165,000
|
$55.45
-13.44%
|
4/17/2017
|
$51.75
|
PP = $53.10
|
|
MB = $55.76
|
Most Recent Note - 5/8/2017 12:36:41 PM
G - Slumping below its 50-day moving average (DMA) line ($51.36) with today's big loss on higher volume raising concerns. Reported earnings +35% on +33% sales revenues for the Mar '17 quarter, above the +25% minimum guideline (C criteria). Volume and volatility often increase near earnings news. See the latest FSU analysis for more details and an annotated graph.
>>> FEATURED STOCK ARTICLE : Due to Report Earnings Prior to Friday's Open - 5/4/2017 |
View all notes |
Set NEW NOTE alert |
Company Profile |
SEC
News |
Chart |
Request a new note
C
A
S
I |
Symbol/Exchange
Company Name
Industry Group |
PRICE |
CHANGE
(%Change) |
Day High |
Volume
(% DAV)
(% 50 day avg vol) |
52 Wk Hi
% From Hi |
Featured
Date |
Price
Featured |
Pivot Featured |
|
Max Buy |
NCOM
-
NASDAQ
National Commerce Corp
BANKING - Regional - Southeast Banks
|
$39.25
|
+0.00
0.00% |
$39.58
|
28,101
87.82% of 50 DAV
50 DAV is 32,000
|
$40.00
-1.88%
|
4/25/2017
|
$38.95
|
PP = $40.09
|
|
MB = $42.09
|
Most Recent Note - 5/8/2017 10:15:36 AM
Y - Volume totals have been cooling while consolidating within close striking distance of its 52-week high. A gain above the pivot point backed by a minimum of +40% above average volume may trigger a technical buy signal.
>>> FEATURED STOCK ARTICLE : Challenging 52-Week High With Volume-Driven Gains - 4/26/2017 |
View all notes |
Set NEW NOTE alert |
Company Profile |
SEC
News |
Chart |
Request a new note
C
A
S
I |
INGN
-
NASDAQ
Inogen Inc
HEALTH SERVICES - Medical Instruments and Supplies
|
$83.77
|
-0.44
-0.52% |
$84.89
|
226,327
122.34% of 50 DAV
50 DAV is 185,000
|
$85.94
-2.53%
|
4/17/2017
|
$76.77
|
PP = $80.04
|
|
MB = $84.04
|
Most Recent Note - 5/8/2017 10:13:12 AM
Y - Color code is changed to yellow while consolidating near its all-time high and just below its "max buy" level. Due to report Mar '17 earnings news after the close on Tuesday, May 9th. Volume and volatility often increase near earnings news. Recent gains above the pivot point lacked the minimum +40% above average volume needed to trigger a proper new (or add-on) technical buy signal. Prior highs in the $79 area define support above its 50 DMA line ($76.76).
>>> FEATURED STOCK ARTICLE : Wedging Higher With Recent Gains Lacking Great Volume - 5/1/2017 |
View all notes |
Set NEW NOTE alert |
Company Profile |
SEC
News |
Chart |
Request a new note
C
A
S
I |
PLAY
-
NASDAQ
Dave & Buster's Ent Inc
Retail-Restaurants
|
$66.69
|
+0.79
1.20% |
$66.89
|
364,324
46.23% of 50 DAV
50 DAV is 788,000
|
$66.39
0.45%
|
2/23/2017
|
$55.41
|
PP = $58.35
|
|
MB = $61.27
|
Most Recent Note - 5/8/2017 8:56:54 PM
G - Quietly perched at its all-time high. Its 50 DMA line ($60.72) defines near-term support to watch on pullbacks. Latest quarter was below the +25% minimum guideline (C criteria), raising fundamental concerns.
>>> FEATURED STOCK ARTICLE : New Record High With Solid Gain on Near Average Volume - 5/2/2017 |
View all notes |
Set NEW NOTE alert |
Company Profile |
SEC
News |
Chart |
Request a new note
C
A
S
I |
OLLI
-
NASDAQ
Ollie's Bargain Outlet
Retail-DiscountandVariety
|
$39.45
|
-0.65
-1.62% |
$40.50
|
659,234
108.61% of 50 DAV
50 DAV is 607,000
|
$41.30
-4.48%
|
3/27/2017
|
$32.80
|
PP = $33.55
|
|
MB = $35.23
|
Most Recent Note - 5/9/2017 6:23:04 PM
G - Suffered a second consecutive loss today following a "negative reversal" after touching a new all-time high. Very extended from any sound base. Reported earnings +22% on +16% sales revenues for the Jan '17 quarter, below the +25% minimum earnings guideline (C criteria), raising fundamental concerns. Its 50 DMA line ($34.39) and prior highs in the $33 area define near-term support to watch.
>>> FEATURED STOCK ARTICLE : Winning Streak Continues for Discount Retailer - 4/24/2017 |
View all notes |
Set NEW NOTE alert |
Company Profile |
SEC
News |
Chart |
Request a new note
C
A
S
I |
MOMO
-
NASDAQ
Momo Inc Ads Cl A
INTERNET - Content
|
$38.58
|
+0.01
0.01% |
$39.00
|
5,623,759
105.43% of 50 DAV
50 DAV is 5,334,000
|
$40.43
-4.58%
|
3/7/2017
|
$29.71
|
PP = $27.83
|
|
MB = $29.22
|
Most Recent Note - 5/9/2017 6:19:57 PM
G - Hovering near its all-time high, stubbornly holding its ground. Its 50 DMA line ($34.78) defines important near-term support to watch. See the latest FSU analysis for more details and a new annotated graph.
>>> FEATURED STOCK ARTICLE : Hovering Near Record High, Extended From Prior Base - 5/9/2017 |
View all notes |
Set NEW NOTE alert |
Company Profile |
SEC
News |
Chart |
Request a new note
C
A
S
I |
Symbol/Exchange
Company Name
Industry Group |
PRICE |
CHANGE
(%Change) |
Day High |
Volume
(% DAV)
(% 50 day avg vol) |
52 Wk Hi
% From Hi |
Featured
Date |
Price
Featured |
Pivot Featured |
|
Max Buy |
|
|
|
THESE ARE NOT BUY RECOMMENDATIONS!
Comments contained in the body of this report are technical
opinions only. The material herein has been obtained
from sources believed to be reliable and accurate, however,
its accuracy and completeness cannot be guaranteed.
This site is not an investment advisor, hence it does
not endorse or recommend any securities or other investments.
Any recommendation contained in this report may not
be suitable for all investors and it is not to be deemed
an offer or solicitation on our part with respect to
the purchase or sale of any securities. All trademarks,
service marks and trade names appearing in this report
are the property of their respective owners, and are
likewise used for identification purposes only.
This report is a service available
only to active Paid Premium Members.
You may opt-out of receiving report notifications
at any time. Questions or comments may be submitted
by writing to Premium Membership Services 665 S.E. 10 Street, Suite 201 Deerfield Beach, FL 33441-5634 or by calling 1-800-965-8307
or 954-785-1121.
|
|
|