***Last / Change / Volume data in this table is the closing quote data***
Symbol/Exchange
Company Name
Industry Group |
PRICE |
CHANGE
(%Change) |
Day High |
Volume
(% DAV)
(% 50 day avg vol) |
52 Wk Hi
% From Hi |
Featured
Date |
Price
Featured |
Pivot Featured |
|
Max Buy |
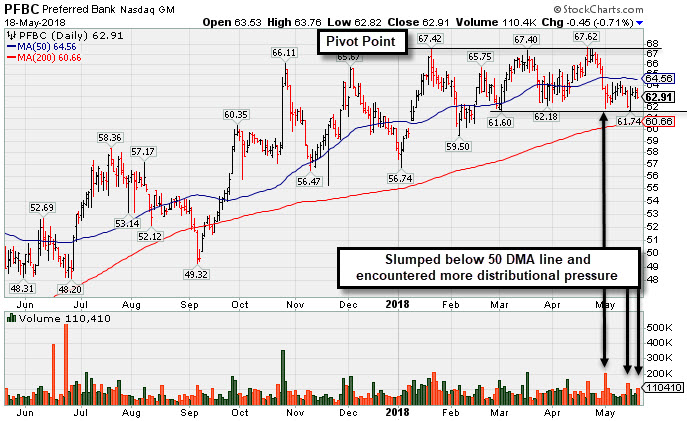
PFBC
-
NASDAQ
Preferred Bank Los Angls
BANKING - Regional - Pacific Banks
|
$62.91
|
-0.45
-0.71% |
$63.76
|
110,380
132.99% of 50 DAV
50 DAV is 83,000
|
$67.65
-7.01%
|
5/18/2018
|
$62.91
|
PP = $67.75
|
|
MB = $71.14
|
 Most Recent Note - 5/18/2018 5:32:12 PM
Y - A rebound above the 50 DMA line ($64.64) is needed for its outlook to improve. Its Relative Strength rating has slumped below the 80+ minimum guideline to 66, yet it remains only -7% off its high. Despite concerns its color code is changed to yellow with new pivot point cited based on its 1/22/18 high plus 10 cents. Subsequent gains above the pivot point are needed to trigger a technical buy signal. See the latest FSU analysis for more details and a new annotated graph.
>>> FEATURED STOCK ARTICLE : Some Technical Sputtering Yet Bank is Still Only -7% Off High - 5/18/2018 |
View all notes |
Set NEW NOTE alert |
Company Profile |
SEC
News |
Chart |
Request a new note
C
A
S
I |
SIVB
-
NASDAQ
S V B Financial Group
BANKING - Regional - Pacific Banks
|
$321.78
|
-1.58
-0.49% |
$325.93
|
380,564
46.93% of 50 DAV
50 DAV is 811,000
|
$325.38
-1.11%
|
3/12/2018
|
$267.79
|
PP = $263.19
|
|
MB = $276.35
|
Most Recent Note - 5/15/2018 5:37:23 PM
G - Still stubbornly holding its ground and quietly edging higher after a big "breakaway gap" for a new high on 4/27/18. Bullish action came after it reported financial results for the quarter ended March 31, 2018 and earnings rose +90% on +34% sales revenues versus the year ago period.
>>> FEATURED STOCK ARTICLE : Rebounded Above its 50-Day Moving Average - 4/12/2018 |
View all notes |
Set NEW NOTE alert |
Company Profile |
SEC
News |
Chart |
Request a new note
C
A
S
I |
EPAM
-
NYSE
Epam Systems Inc
COMPUTER SOFTWARE and SERVICES - Information Technology Service
|
$126.41
|
+0.78
0.62% |
$126.99
|
292,186
90.74% of 50 DAV
50 DAV is 322,000
|
$131.75
-4.05%
|
5/9/2018
|
$120.34
|
PP = $125.98
|
|
MB = $132.28
|
Most Recent Note - 5/14/2018 7:24:37 PM
Y - Pulled back today testing near the prior high ($125.88 on 3/13/18) defining initial support after 3 consecutive volume-driven gains. Prior highs in the $119 area also define near-term support to watch above its 50 DMA line ($116.94).
>>> FEATURED STOCK ARTICLE : Volume-Driven Gain Challenged Prior High Following Earnings - 5/9/2018 |
View all notes |
Set NEW NOTE alert |
Company Profile |
SEC
News |
Chart |
Request a new note
C
A
S
I |
MA
-
NYSE
Mastercard Inc Cl A
DIVERSIFIED SERVICES - Business/Management Services
|
$190.40
|
-0.80
-0.42% |
$192.09
|
4,067,104
104.39% of 50 DAV
50 DAV is 3,896,000
|
$194.72
-2.22%
|
5/2/2018
|
$184.96
|
PP = $183.83
|
|
MB = $193.02
|
Most Recent Note - 5/16/2018 2:15:20 PM
Y - Stubbornly holding its ground near its "max buy" level and all-time high. Tallied an impressive streak of gains since breaking out on 5/02/18 from a riskier "late stage" base. Prior highs in the $183 area define initial support to watch on pullbacks.
>>> FEATURED STOCK ARTICLE : Gap Up and Volume Driven Gain for New High After Earnings - 5/2/2018 |
View all notes |
Set NEW NOTE alert |
Company Profile |
SEC
News |
Chart |
Request a new note
C
A
S
I |
V
-
NYSE
Visa Inc Cl A
DIVERSIFIED SERVICES - Business/Management Services
|
$129.93
|
+0.00
0.00% |
$130.34
|
6,068,499
77.81% of 50 DAV
50 DAV is 7,799,000
|
$132.50
-1.94%
|
4/26/2018
|
$126.68
|
PP = $126.98
|
|
MB = $133.33
|
Most Recent Note - 5/16/2018 2:09:02 PM
Y - Stubbornly holding its ground and inching higher after a technical breakout noted in the 4/26/18 mid-day report. Reported earnings +29% on +13% sales revenues for the Mar '18 quarter, and 3 of the past 4 quarterly comparisons were above the +25% minimum earnings guideline (C criteria).
>>> FEATURED STOCK ARTICLE : Volume-Driven Gain For New High Triggered Technical Buy Signal - 4/26/2018 |
View all notes |
Set NEW NOTE alert |
Company Profile |
SEC
News |
Chart |
Request a new note
C
A
S
I |
Symbol/Exchange
Company Name
Industry Group |
PRICE |
CHANGE
(%Change) |
Day High |
Volume
(% DAV)
(% 50 day avg vol) |
52 Wk Hi
% From Hi |
Featured
Date |
Price
Featured |
Pivot Featured |
|
Max Buy |
TPL
-
NYSE
Texas Pacific Land Trust
FINANCIAL SERVICES - Diversified Investments
|
$683.28
|
-6.81
-0.99% |
$704.00
|
29,870
165.94% of 50 DAV
50 DAV is 18,000
|
$691.25
-1.15%
|
4/13/2018
|
$547.85
|
PP = $552.10
|
|
MB = $579.71
|
Most Recent Note - 5/18/2018 1:00:32 PM
G - Powered to a new all-time high with 3 consecutive gains marked by above average volume, getting very extended from the prior base. Prior highs in the $569-552 area define initial support to watch along with its 50 DMA line ($557).
>>> FEATURED STOCK ARTICLE : Perched Near Prior High After Showing Resilience - 4/20/2018 |
View all notes |
Set NEW NOTE alert |
Company Profile |
SEC
News |
Chart |
Request a new note
C
A
S
I |
STMP
-
NASDAQ
Stamps.com Inc
INTERNET - Internet Software and Services
|
$248.00
|
+0.20
0.08% |
$249.50
|
329,070
104.47% of 50 DAV
50 DAV is 315,000
|
$251.50
-1.39%
|
5/4/2018
|
$234.15
|
PP = $233.23
|
|
MB = $244.89
|
Most Recent Note - 5/16/2018 2:07:51 PM
G - Holding its ground with volume totals cooling while perched at its all-time high. Extended from prior highs in the $233 area which define initial support above its 50 DMA line ($215).
>>> FEATURED STOCK ARTICLE : Volume-Driven Gain For New High - 5/4/2018 |
View all notes |
Set NEW NOTE alert |
Company Profile |
SEC
News |
Chart |
Request a new note
C
A
S
I |
CHDN
-
NASDAQ
Churchill Downs Inc
LEISURE - Gaming Activities
|
$309.65
|
-0.20
-0.06% |
$313.57
|
245,055
224.82% of 50 DAV
50 DAV is 109,000
|
$314.60
-1.57%
|
5/14/2018
|
$285.80
|
PP = $285.80
|
|
MB = $300.09
|
Most Recent Note - 5/18/2018 12:26:36 PM
G - Quickly rallied above its "max buy" level getting extended from the previously noted base. Prior highs in the $285-279 area define initial support to watch on pullbacks.
>>> FEATURED STOCK ARTICLE : Breakout Followed New Supreme Court Ruling on Sports Betting - 5/14/2018 |
View all notes |
Set NEW NOTE alert |
Company Profile |
SEC
News |
Chart |
Request a new note
C
A
S
I |
HTHT
-
NASDAQ
China Lodging Group Ads
LEISURE - Lodging
|
$173.93
|
+3.82
2.25% |
$174.50
|
707,913
122.26% of 50 DAV
50 DAV is 579,000
|
$173.76
0.10%
|
5/15/2018
|
$138.07
|
PP = $166.29
|
|
MB = $174.60
|
Most Recent Note - 5/16/2018 12:49:36 PM
Y - Holding its ground today while on track for a 9th consecutive gain. Finished strong on the prior session after highlighted in yellow with new pivot point cited based on its 1/22/18 high plus 10 cents. The strong finish above the pivot point clinched a convincing new technical buy signal. Found support at its 200 DMA line and rebounded after dropped from the Featured Stocks list on 3/27/18. See the latest FSU analysis for more detailed analysis and an annotated graph.
>>> FEATURED STOCK ARTICLE : New Volume-Driven Breakout For All-Time High - 5/15/2018 |
View all notes |
Set NEW NOTE alert |
Company Profile |
SEC
News |
Chart |
Request a new note
C
A
S
I |
DPZ
-
NYSE
Dominos Pizza Inc
WHOLESALE - Food Wholesale
|
$244.86
|
-1.69
-0.69% |
$247.99
|
697,021
111.35% of 50 DAV
50 DAV is 626,000
|
$255.00
-3.98%
|
2/20/2018
|
$224.86
|
PP = $222.01
|
|
MB = $233.11
|
Most Recent Note - 5/14/2018 6:59:39 PM
G - It is extended from the prior base and volume totals have been cooling while consolidating in a tight range. Its 50 DMA line ($235) and prior highs in the $236 area define important near-term support to watch on pullbacks.
>>> FEATURED STOCK ARTICLE : Earnings News Due From Pizza Firm - 4/23/2018 |
View all notes |
Set NEW NOTE alert |
Company Profile |
SEC
News |
Chart |
Request a new note
C
A
S
I |
Symbol/Exchange
Company Name
Industry Group |
PRICE |
CHANGE
(%Change) |
Day High |
Volume
(% DAV)
(% 50 day avg vol) |
52 Wk Hi
% From Hi |
Featured
Date |
Price
Featured |
Pivot Featured |
|
Max Buy |
FIVE
-
NASDAQ
Five Below Inc
Retail-DiscountandVariety
|
$74.83
|
-0.70
-0.93% |
$75.89
|
1,275,867
85.34% of 50 DAV
50 DAV is 1,495,000
|
$78.28
-4.41%
|
3/9/2018
|
$68.58
|
PP = $73.65
|
|
MB = $77.33
|
Most Recent Note - 5/14/2018 7:03:21 PM
Y - Finding support near its 50 DMA line ($71.56) after recent distributional pressure. Subsequent damaging losses below the recent low ($69.37 on 5/02/18) may trigger a more worrisome technical sell signal.
>>> FEATURED STOCK ARTICLE : Trading Near 50-Day Average After Falling Into Prior Base - 5/7/2018 |
View all notes |
Set NEW NOTE alert |
Company Profile |
SEC
News |
Chart |
Request a new note
C
A
S
I |
NOW
-
NYSE
Servicenow Inc
Computer Sftwr-Enterprse
|
$173.94
|
+2.23
1.30% |
$174.56
|
1,190,616
59.00% of 50 DAV
50 DAV is 2,018,000
|
$182.59
-4.73%
|
5/8/2018
|
$174.63
|
PP = $176.66
|
|
MB = $185.49
|
Most Recent Note - 5/15/2018 5:33:57 PM
Y - It stalled after highlighted in yellow with pivot point cited based on its 3/14/18 high plus 10 cents in the 5/08/18 mid-day report. Subsequent gains backed by at least +40% above average volume while rising above the pivot point may trigger a technical buy signal.
>>> FEATURED STOCK ARTICLE : High-Ranked Software - Enterprise Firm is Near Pivot Point - 5/8/2018 |
View all notes |
Set NEW NOTE alert |
Company Profile |
SEC
News |
Chart |
Request a new note
C
A
S
I |
NVEE
-
NASDAQ
N V 5 Global Inc
Comml Svcs-Consulting
|
$59.90
|
+1.10
1.87% |
$60.40
|
40,416
44.41% of 50 DAV
50 DAV is 91,000
|
$71.90
-16.69%
|
4/9/2018
|
$58.35
|
PP = $59.05
|
|
MB = $62.00
|
Most Recent Note - 5/16/2018 2:20:48 PM
Y -Losses on light volume recently tested support defined by its 50 DMA line and prior highs in the $58-59 area. More damaging losses would raise greater concerns. Reported earnings +51% on +48% sales revenues for the Mar '18 quarter, continuing its strong earnings track record.
>>> FEATURED STOCK ARTICLE : Encountered Distributional Pressure After Hitting New High - 5/11/2018 |
View all notes |
Set NEW NOTE alert |
Company Profile |
SEC
News |
Chart |
Request a new note
C
A
S
I |
QLYS
-
NASDAQ
Qualys Inc
Computer Sftwr-Security
|
$77.30
|
+0.35
0.45% |
$77.85
|
137,746
43.59% of 50 DAV
50 DAV is 316,000
|
$85.00
-9.06%
|
4/17/2018
|
$82.85
|
PP = $79.50
|
|
MB = $83.48
|
Most Recent Note - 5/15/2018 5:36:36 PM
Y - Still sputtering near its 50 DMA line ($76.72) and below its pivot point. Recently reported earnings +80% on +22% sales revenues for the Mar '18 quarter, continuing its strong earnings track record.
>>> FEATURED STOCK ARTICLE : Quickly Rallied More Than 5% Above Prior High - 4/18/2018 |
View all notes |
Set NEW NOTE alert |
Company Profile |
SEC
News |
Chart |
Request a new note
C
A
S
I |
SPLK
-
NASDAQ
Splunk Inc
Computer Sftwr-Database
|
$116.70
|
+1.84
1.60% |
$116.78
|
889,866
51.38% of 50 DAV
50 DAV is 1,732,000
|
$117.86
-0.98%
|
5/8/2018
|
$113.14
|
PP = $112.76
|
|
MB = $118.40
|
Most Recent Note - 5/14/2018 7:20:48 PM
Y - Today's volume-driven loss led to a close below the pivot point raising some concerns. Recent gains above the stock's pivot point did not meet the required volume threshold of at least +40% above average volume needed to trigger a proper technical buy signal.
>>> FEATURED STOCK ARTICLE : Found Support Near 50-Day Average on Pullbacks - 4/19/2018 |
View all notes |
Set NEW NOTE alert |
Company Profile |
SEC
News |
Chart |
Request a new note
C
A
S
I |
Symbol/Exchange
Company Name
Industry Group |
PRICE |
CHANGE
(%Change) |
Day High |
Volume
(% DAV)
(% 50 day avg vol) |
52 Wk Hi
% From Hi |
Featured
Date |
Price
Featured |
Pivot Featured |
|
Max Buy |
SUPN
-
NASDAQ
Supernus Pharmaceuticals
Medical-Biomed/Biotech
|
$56.10
|
-0.40
-0.71% |
$56.75
|
941,583
122.92% of 50 DAV
50 DAV is 766,000
|
$59.05
-5.00%
|
4/24/2018
|
$47.73
|
PP = $50.15
|
|
MB = $52.66
|
Most Recent Note - 5/17/2018 6:22:10 PM
G - Pulled back from its all-time high today following an impressive streak of big volume-driven gains. Very extended from the previously noted base and prior highs in the $49-50 area define initial support to watch on pullbacks.
>>> FEATURED STOCK ARTICLE : Pharmaceutical Firm Perched Near Record High - 4/24/2018 |
View all notes |
Set NEW NOTE alert |
Company Profile |
SEC
News |
Chart |
Request a new note
C
A
S
I |
PAYC
-
NYSE
Paycom Software Inc
COMPUTER SOFTWARE and SERVICES - Application Software
|
$103.52
|
+1.83
1.80% |
$103.82
|
584,830
78.50% of 50 DAV
50 DAV is 745,000
|
$118.45
-12.60%
|
2/15/2018
|
$95.01
|
PP = $93.61
|
|
MB = $98.29
|
Most Recent Note - 5/14/2018 7:13:16 PM
G - Met resistance near its 50 DMA line recently and today's big volume-driven loss tested prior lows in the $101 area defining important near-term support. More damaging losses would raise greater concerns. Meanwhile, a rebound above the 50 DMA line is needed for its outlook to improve.
>>> FEATURED STOCK ARTICLE : Violation of 50-Day Average Triggered Technical Sell Signal - 5/3/2018 |
View all notes |
Set NEW NOTE alert |
Company Profile |
SEC
News |
Chart |
Request a new note
C
A
S
I |
GRUB
-
NYSE
Grubhub Inc
COMPUTER SOFTWARE and SERVICES - Technical and System Software
|
$103.80
|
+0.42
0.41% |
$105.13
|
1,026,453
67.71% of 50 DAV
50 DAV is 1,516,000
|
$112.41
-7.66%
|
6/21/2017
|
$47.33
|
PP = $46.94
|
|
MB = $49.29
|
Most Recent Note - 5/15/2018 5:29:33 PM
G - Consolidating quietly just below its 50 DMA line ($102.25). Faces resistance due to overhead supply up to the $112 level. Recently reported earnings +79% on +49% sales revenues for the Mar '18 quarter.
>>> FEATURED STOCK ARTICLE : Consolidating Near 50 Day Average With Earnings News Due - 4/30/2018 |
View all notes |
Set NEW NOTE alert |
Company Profile |
SEC
News |
Chart |
Request a new note
C
A
S
I |
HQY
-
NASDAQ
Healthequity Inc
COMPUTER SOFTWARE and SERVICES - Healthcare Information Service
|
$73.72
|
+1.48
2.05% |
$73.83
|
467,550
78.84% of 50 DAV
50 DAV is 593,000
|
$72.44
1.77%
|
5/2/2018
|
$66.31
|
PP = $68.85
|
|
MB = $72.29
|
Most Recent Note - 5/16/2018 2:10:56 PM
Y - Volume totals still have been below average while wedging into new all-time high territory. Gains above a stock's pivot point must have at least +40% above average volume to trigger a proper new (or add-on) technical buy signal. Its 50 DMA line ($64.56) defines near term support above the recent low ($59.50 on 4/03/18).
>>> FEATURED STOCK ARTICLE : Perched Near All-Time High Building a Short New Base - 4/25/2018 |
View all notes |
Set NEW NOTE alert |
Company Profile |
SEC
News |
Chart |
Request a new note
C
A
S
I |
LOB
-
NASDAQ
Live Oak Bancshares Inc
Banks-Southeast
|
$29.25
|
-0.10
-0.34% |
$29.40
|
63,280
53.18% of 50 DAV
50 DAV is 119,000
|
$30.05
-2.66%
|
3/16/2018
|
$28.63
|
PP = $28.30
|
|
MB = $29.72
|
Most Recent Note - 5/14/2018 7:06:53 PM
Y - Volume totals have been cooling while consolidating in a tight trading range near its 50 DMA line ($28.40). Recent lows in the $26-27 area define the next important near term support. Recently reported earnings +63% on +42% for the Mar '18 quarter.
>>> FEATURED STOCK ARTICLE : Tested Support at 50-Day Moving Average After Breakout - 4/16/2018 |
View all notes |
Set NEW NOTE alert |
Company Profile |
SEC
News |
Chart |
Request a new note
C
A
S
I |
Symbol/Exchange
Company Name
Industry Group |
PRICE |
CHANGE
(%Change) |
Day High |
Volume
(% DAV)
(% 50 day avg vol) |
52 Wk Hi
% From Hi |
Featured
Date |
Price
Featured |
Pivot Featured |
|
Max Buy |
PYPL
-
NASDAQ
Paypal Holdings Inc
Finance-CrdtCard/PmtPr
|
$80.79
|
+1.60
2.02% |
$81.94
|
13,735,080
161.89% of 50 DAV
50 DAV is 8,484,000
|
$86.32
-6.41%
|
5/18/2018
|
$81.63
|
PP = $80.89
|
|
MB = $84.93
|
Most Recent Note - 5/18/2018 12:57:00 PM
Y - Color code is changed to yellow with new pivot point cited based on its 4/18/18 high after forming a "double bottom" base. A gain and close above the pivot point backed by at least +40% above average volume may trigger a new technical buy signal. Found prompt support near its 200 DMA line and prior lows in the $71-72 area. Rebound above the 50 DMA line with volume-driven gains helped its outlook improve. Fundamentals remain strong.
>>> FEATURED STOCK ARTICLE : Slumping Near Important Near-Term Support - 4/27/2018 |
View all notes |
Set NEW NOTE alert |
Company Profile |
SEC
News |
Chart |
Request a new note
C
A
S
I |
OLLI
-
NASDAQ
Ollie's Bargain Outlet
Retail-DiscountandVariety
|
$70.00
|
+0.35
0.50% |
$70.20
|
420,651
61.41% of 50 DAV
50 DAV is 685,000
|
$70.75
-1.06%
|
4/10/2018
|
$62.05
|
PP = $62.15
|
|
MB = $65.26
|
Most Recent Note - 5/14/2018 7:08:52 PM
G - Color code is changed to green while perched at its all-time high after 5 consecutive gains backed by below average volume. No resistance remains due to overhead supply.
>>> FEATURED STOCK ARTICLE : Extended From Prior Base After 8 Consecutive Gains - 5/17/2018 |
View all notes |
Set NEW NOTE alert |
Company Profile |
SEC
News |
Chart |
Request a new note
C
A
S
I |
NOVT
-
NASDAQ
Novanta Inc
Elec-Scientific/Msrng
|
$63.40
|
+0.20
0.32% |
$63.66
|
162,046
75.72% of 50 DAV
50 DAV is 214,000
|
$66.25
-4.29%
|
4/17/2018
|
$60.55
|
PP = $60.40
|
|
MB = $63.42
|
Most Recent Note - 5/15/2018 5:32:26 PM
Y - There was a "negative reversal" today after hitting a new 52-week high. Reported earnings +52% on +35% sales revenues for the Mar '18 quarter. Found support near prior highs in the $58 area and stayed above its 50 DMA line ($57.11) during the recent consolidation.
>>> FEATURED STOCK ARTICLE : Volume-Driven Gain Hit New All-Time High - 4/17/2018 |
View all notes |
Set NEW NOTE alert |
Company Profile |
SEC
News |
Chart |
Request a new note
C
A
S
I |
BZUN
-
NASDAQ
Baozun Inc Cl A Ads
Computer Sftwr-Enterprse
|
$54.85
|
+1.34
2.50% |
$55.29
|
5,074,206
186.62% of 50 DAV
50 DAV is 2,719,000
|
$53.90
1.76%
|
5/15/2018
|
$45.38
|
PP = $52.43
|
|
MB = $55.05
|
Most Recent Note - 5/18/2018 12:24:01 PM
Y - Hitting another new high today. Finished strong on the prior session and clinched a convincing technical buy signal with a gap up and considerable volume-driven gain. Bullish action came after reporting earnings +29% on +25% sales revenues for the Mar '18 quarter. It was first featured in the 5/15/18 mid-day report (read here). See the latest FSU analysis for more details and an annotated graph.
>>> FEATURED STOCK ARTICLE : Earnings News Due; Formed a Base-on-Base Pattern - 5/16/2018 |
View all notes |
Set NEW NOTE alert |
Company Profile |
SEC
News |
Chart |
Request a new note
C
A
S
I |
SEDG
-
NASDAQ
Solaredge Technologies
Energy-Solar
|
$66.45
|
-0.15
-0.23% |
$67.00
|
460,012
56.51% of 50 DAV
50 DAV is 814,000
|
$70.74
-6.06%
|
5/9/2018
|
$55.33
|
PP = $59.30
|
|
MB = $62.27
|
Most Recent Note - 5/15/2018 1:02:08 PM
G - Perched at its all-time high following big volume-driven gains, extended from the previously noted base. Prior highs define initial support in the $59 area. Disciplined investors avoid chasing extended stocks.
>>> FEATURED STOCK ARTICLE : Quickly Rallied Following Strong Earnings News - 5/10/2018 |
View all notes |
Set NEW NOTE alert |
Company Profile |
SEC
News |
Chart |
Request a new note
C
A
S
I |
Symbol/Exchange
Company Name
Industry Group |
PRICE |
CHANGE
(%Change) |
Day High |
Volume
(% DAV)
(% 50 day avg vol) |
52 Wk Hi
% From Hi |
Featured
Date |
Price
Featured |
Pivot Featured |
|
Max Buy |
SEND
-
NYSE
Sendgrid Inc
INTERNET - Content
|
$26.39
|
+0.31
1.19% |
$26.82
|
470,562
107.19% of 50 DAV
50 DAV is 439,000
|
$32.03
-17.60%
|
3/6/2018
|
$28.00
|
PP = $28.37
|
|
MB = $29.79
|
Most Recent Note - 5/14/2018 7:16:15 PM
G - Gapped down today for a damaging volume-driven loss. Met resistance whereas a convincing rebound above the 50 DMA line ($28.09) is needed for its outlook to improve. The prior low ($23.77 on 4/04/18) defines the next important support to watch. Completed a new Public Offering and Secondary Offering on 4/05/18.
>>> FEATURED STOCK ARTICLE : Earnings News Continues to be Strong - 5/1/2018 |
View all notes |
Set NEW NOTE alert |
Company Profile |
SEC
News |
Chart |
Request a new note
C
A
S
I |