***Last / Change / Volume data in this table is the closing quote data***
Symbol/Exchange
Company Name
Industry Group |
PRICE |
CHANGE
(%Change) |
Day High |
Volume
(% DAV)
(% 50 day avg vol) |
52 Wk Hi
% From Hi |
Featured
Date |
Price
Featured |
Pivot Featured |
|
Max Buy |
PFBC
-
NASDAQ
Preferred Bank Los Angls
BANKING - Regional - Pacific Banks
|
$66.90
|
+0.44
0.66% |
$67.50
|
76,497
92.17% of 50 DAV
50 DAV is 83,000
|
$67.65
-1.11%
|
4/10/2018
|
$64.56
|
PP = $67.75
|
|
MB = $71.14
|
Most Recent Note - 4/20/2018 12:43:55 PM
Y - Early gain today challenged its 52-week high and previously cited pivot point. Subsequent volume-driven gains for new highs may trigger a technical buy signal. Reported +35% earnings on +23% sales revenues for the first quarter ended March 31, 2018 versus the year ago period, continuing its strong earnings track record. Volume and volatility often increase near earnings news. Consolidating above its 50 DMA line ($64.45) after holding its ground stubbornly in recent weeks.
>>> FEATURED STOCK ARTICLE : Bank Stock Hovering Within Striking Distance of Prior High - 4/10/2018 |
View all notes |
Set NEW NOTE alert |
Company Profile |
SEC
News |
Chart |
Request a new note
C
A
S
I |
SIVB
-
NASDAQ
S V B Financial Group
BANKING - Regional - Pacific Banks
|
$257.61
|
+3.38
1.33% |
$262.68
|
690,850
94.51% of 50 DAV
50 DAV is 731,000
|
$271.79
-5.22%
|
3/12/2018
|
$267.79
|
PP = $263.19
|
|
MB = $276.35
|
Most Recent Note - 4/19/2018 5:50:45 PM
Y - Consolidating near its 50 DMA line ($249.23). Found support when recently sputtering near the prior low ($226.61 on 2/06/18). More damaging losses would raise greater concerns and trigger a worrisome technical sell signal.
>>> FEATURED STOCK ARTICLE : Rebounded Above its 50-Day Moving Average - 4/12/2018 |
View all notes |
Set NEW NOTE alert |
Company Profile |
SEC
News |
Chart |
Request a new note
C
A
S
I |
TPL
-
NYSE
Texas Pacific Land Trust
FINANCIAL SERVICES - Diversified Investments
|
$535.44
|
-10.06
-1.84% |
$552.00
|
21,075
162.12% of 50 DAV
50 DAV is 13,000
|
$569.99
-6.06%
|
4/13/2018
|
$547.85
|
PP = $552.10
|
|
MB = $579.71
|
 Most Recent Note - 4/24/2018 1:09:19 PM
Y - Encountered distributional pressure on the prior session after challenging its all-time high. Recent gains lacked great volume conviction as it wedged up above the new pivot point cited based on its 2/28/18 high plus 10 cents. Gains above a stock's pivot point must have more than +40% above average volume to trigger a proper new (or add-on) technical buy signal. Very little resistance remains due to overhead supply up to the $569 level. The 50 DMA line defines near-term support to watch above the recent lows ($480).
>>> FEATURED STOCK ARTICLE : Perched Near Prior High After Showing Resilience - 4/20/2018 |
View all notes |
Set NEW NOTE alert |
Company Profile |
SEC
News |
Chart |
Request a new note
C
A
S
I |
LMAT
-
NASDAQ
Lemaitre Vascular Inc
Medical-Products
|
$38.80
|
-1.26
-3.15% |
$40.15
|
133,048
97.83% of 50 DAV
50 DAV is 136,000
|
$41.28
-6.01%
|
3/19/2018
|
$36.77
|
PP = $39.98
|
|
MB = $41.98
|
Most Recent Note - 4/23/2018 6:28:48 PM
Y - Perched near its all-time high. Held its ground stubbornly since it triggered a technical buy signal on 4/11/18 . Found support recently near its 50 DMA line ($36.91).
>>> FEATURED STOCK ARTICLE : Gain With Heavy Volume Triggered Technical Buy Signal - 4/13/2018 |
View all notes |
Set NEW NOTE alert |
Company Profile |
SEC
News |
Chart |
Request a new note
C
A
S
I |
DPZ
-
NYSE
Dominos Pizza Inc
WHOLESALE - Food Wholesale
|
$231.82
|
-7.66
-3.20% |
$240.44
|
890,890
99.21% of 50 DAV
50 DAV is 898,000
|
$243.81
-4.92%
|
2/20/2018
|
$224.86
|
PP = $222.01
|
|
MB = $233.11
|
Most Recent Note - 4/23/2018 6:23:38 PM
G - Earnings news is due on Thursday. Recently wedged above its "max buy" level with gains lacking great volume conviction. Its 50 DMA line and recent lows define near-term support to watch. See the latest FSU analysis for more details and a new annotated graph.
>>> FEATURED STOCK ARTICLE : Earnings News Due From Pizza Firm - 4/23/2018 |
View all notes |
Set NEW NOTE alert |
Company Profile |
SEC
News |
Chart |
Request a new note
C
A
S
I |
Symbol/Exchange
Company Name
Industry Group |
PRICE |
CHANGE
(%Change) |
Day High |
Volume
(% DAV)
(% 50 day avg vol) |
52 Wk Hi
% From Hi |
Featured
Date |
Price
Featured |
Pivot Featured |
|
Max Buy |
FIVE
-
NASDAQ
Five Below Inc
Retail-DiscountandVariety
|
$72.64
|
-0.76
-1.04% |
$73.56
|
1,254,428
86.04% of 50 DAV
50 DAV is 1,458,000
|
$78.28
-7.20%
|
3/9/2018
|
$68.58
|
PP = $73.65
|
|
MB = $77.33
|
Most Recent Note - 4/24/2018 5:59:02 PM
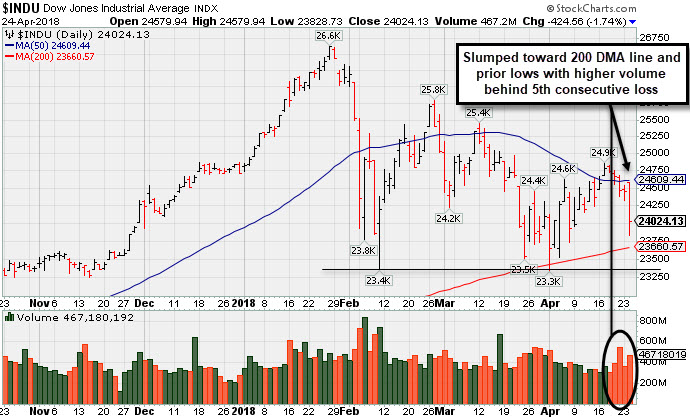
Y - Fell for a 5th consecutive small loss on lighter volume since the noted "negative reversal" on 4/18/18 after hitting a new all-time high. Slumped near prior highs in the $73 area defining initial support above its 50 DMA line ($70.06). More damaging losses may raise concerns and trigger technical sell signals.
>>> FEATURED STOCK ARTICLE : Quietly Hovering Near All-Time High - 4/5/2018 |
View all notes |
Set NEW NOTE alert |
Company Profile |
SEC
News |
Chart |
Request a new note
C
A
S
I |
NVEE
-
NASDAQ
N V 5 Global Inc
Comml Svcs-Consulting
|
$61.15
|
-0.95
-1.53% |
$62.80
|
89,622
109.30% of 50 DAV
50 DAV is 82,000
|
$64.50
-5.19%
|
4/9/2018
|
$58.35
|
PP = $59.05
|
|
MB = $62.00
|
Most Recent Note - 4/23/2018 6:31:05 PM
G - Consolidating just above its "max buy" level. Prior highs in the $58 area define initial support to watch on pullbacks. Hit a new all-time high with +95% above average volume behind its considerable 4/12/18 gain above the pivot point triggering a technical buy signal.
>>> FEATURED STOCK ARTICLE : Perched Near High After 3 Strong Quarterly Comparisons - 4/9/2018 |
View all notes |
Set NEW NOTE alert |
Company Profile |
SEC
News |
Chart |
Request a new note
C
A
S
I |
QLYS
-
NASDAQ
Qualys Inc
Computer Sftwr-Security
|
$79.00
|
-2.30
-2.83% |
$83.00
|
344,628
97.35% of 50 DAV
50 DAV is 354,000
|
$85.00
-7.06%
|
4/17/2018
|
$82.85
|
PP = $79.50
|
|
MB = $83.48
|
Most Recent Note - 4/19/2018 1:02:37 PM
G - Perched at its all-time high today following 3 consecutive volume-driven gains. Color code was changed to green after quickly rising above its "max buy" level. Prior high in the $79 area defines initial support to watch on pullbacks. See the latest FSU analysis for more details and an annotated graph.
>>> FEATURED STOCK ARTICLE : Quickly Rallied More Than 5% Above Prior High - 4/18/2018 |
View all notes |
Set NEW NOTE alert |
Company Profile |
SEC
News |
Chart |
Request a new note
C
A
S
I |
SPLK
-
NASDAQ
Splunk Inc
Computer Sftwr-Database
|
$100.36
|
-4.67
-4.45% |
$106.16
|
1,685,500
82.74% of 50 DAV
50 DAV is 2,037,000
|
$112.66
-10.92%
|
2/15/2018
|
$96.06
|
PP = $93.68
|
|
MB = $98.36
|
Most Recent Note - 4/24/2018 5:47:23 PM
G - Slumped near its 50 DMA line ($100.89) with a big loss today on below average volume. More damaging losses would raise concerns, especially any breach of the prior low ($94.39 on 4/04/18).
>>> FEATURED STOCK ARTICLE : Found Support Near 50-Day Average on Pullbacks - 4/19/2018 |
View all notes |
Set NEW NOTE alert |
Company Profile |
SEC
News |
Chart |
Request a new note
C
A
S
I |
SUPN
-
NASDAQ
Supernus Pharmaceuticals
Medical-Biomed/Biotech
|
$46.75
|
-0.75
-1.58% |
$48.50
|
1,202,779
190.61% of 50 DAV
50 DAV is 631,000
|
$50.05
-6.58%
|
4/24/2018
|
$47.73
|
PP = $50.15
|
|
MB = $52.66
|
Most Recent Note - 4/24/2018 1:01:49 PM
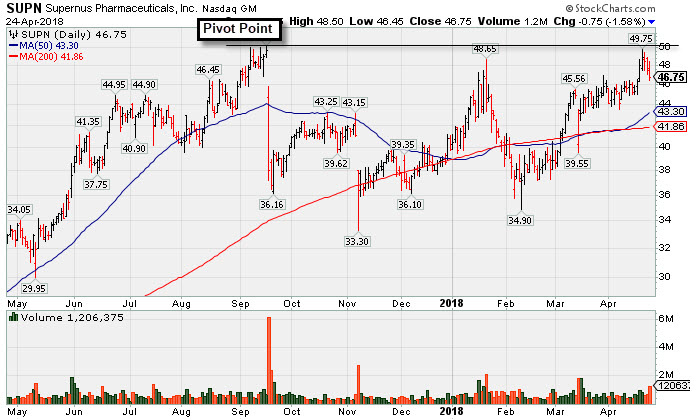
Y - Color code is changed to yellow with pivot point cited based on its 9/18/17 high plus 10 cents. Hovering within close striking distance of its all-time high. Subsequent gains above the pivot point backed by at least +40% above average volume are needed to trigger a technical buy signal. Sales revenues increases were in the +30-47% range while three of the past 4 quarterly earnings comparisons through Dec '17 were above the +25% minimum guideline (C criteria). Showed strong earnings growth since FY '15 after years of losses.
>>> FEATURED STOCK ARTICLE : Pharmaceutical Firm Perched Near Record High - 4/24/2018 |
View all notes |
Set NEW NOTE alert |
Company Profile |
SEC
News |
Chart |
Request a new note
C
A
S
I |
Symbol/Exchange
Company Name
Industry Group |
PRICE |
CHANGE
(%Change) |
Day High |
Volume
(% DAV)
(% 50 day avg vol) |
52 Wk Hi
% From Hi |
Featured
Date |
Price
Featured |
Pivot Featured |
|
Max Buy |
PAYC
-
NYSE
Paycom Software Inc
COMPUTER SOFTWARE and SERVICES - Application Software
|
$110.55
|
-3.52
-3.09% |
$116.63
|
1,120,238
159.58% of 50 DAV
50 DAV is 702,000
|
$118.45
-6.67%
|
2/15/2018
|
$95.01
|
PP = $93.61
|
|
MB = $98.29
|
Most Recent Note - 4/24/2018 5:43:48 PM
G - Pulled back from its all-time high with 4 consecutive losses on ever increasing volume. Its 50 DMA line ($106) and recent low ($101.55 on 4/04/18) define important near-term support to watch on pullbacks. Due to report earnings news on 5/01/18.
>>> FEATURED STOCK ARTICLE : Pulling Back After Negative Reversal at All-Time High Last Week - 4/4/2018 |
View all notes |
Set NEW NOTE alert |
Company Profile |
SEC
News |
Chart |
Request a new note
C
A
S
I |
GRUB
-
NYSE
Grubhub Inc
COMPUTER SOFTWARE and SERVICES - Technical and System Software
|
$98.03
|
-4.14
-4.05% |
$103.99
|
1,851,861
111.49% of 50 DAV
50 DAV is 1,661,000
|
$112.41
-12.79%
|
6/21/2017
|
$47.33
|
PP = $46.94
|
|
MB = $49.29
|
Most Recent Note - 4/24/2018 5:41:39 PM
G - Big loss today with slightly higher volume violated the 50 DMA line ($101.25) triggering a technical sell signal. Subsequent losses below the recent low ($94.08 on 4/04/18) would raise more serious concerns.
>>> FEATURED STOCK ARTICLE : Very Extended and Enduring Distributional Pressure - 3/29/2018 |
View all notes |
Set NEW NOTE alert |
Company Profile |
SEC
News |
Chart |
Request a new note
C
A
S
I |
HQY
-
NASDAQ
Healthequity Inc
COMPUTER SOFTWARE and SERVICES - Healthcare Information Service
|
$65.11
|
-1.21
-1.82% |
$66.57
|
258,038
34.64% of 50 DAV
50 DAV is 745,000
|
$68.75
-5.29%
|
2/20/2018
|
$56.37
|
PP = $55.41
|
|
MB = $58.18
|
Most Recent Note - 4/23/2018 6:25:30 PM
G - Hovering near its all-time high. It is extended from any sound base. Its 50 DMA line ($59.88) defines near term support above prior highs.
>>> FEATURED STOCK ARTICLE : Bullish Action Followed Latest Earnings Report - 3/22/2018 |
View all notes |
Set NEW NOTE alert |
Company Profile |
SEC
News |
Chart |
Request a new note
C
A
S
I |
LOB
-
NASDAQ
Live Oak Bancshares Inc
Banks-Southeast
|
$28.75
|
+0.00
0.00% |
$29.15
|
73,366
54.75% of 50 DAV
50 DAV is 134,000
|
$30.05
-4.33%
|
3/16/2018
|
$28.63
|
PP = $28.30
|
|
MB = $29.72
|
Most Recent Note - 4/23/2018 6:29:55 PM
Y - Earnings news is due on 4/25/18. Quietly consolidating above its pivot point after testing its 50 DMA line ($27.76). Subsequent damaging losses would raise greater concerns.
>>> FEATURED STOCK ARTICLE : Tested Support at 50-Day Moving Average After Breakout - 4/16/2018 |
View all notes |
Set NEW NOTE alert |
Company Profile |
SEC
News |
Chart |
Request a new note
C
A
S
I |
PYPL
-
NASDAQ
Paypal Holdings Inc
Finance-CrdtCard/PmtPr
|
$75.28
|
-2.93
-3.75% |
$79.40
|
9,151,930
111.60% of 50 DAV
50 DAV is 8,201,000
|
$86.32
-12.79%
|
2/1/2018
|
$80.35
|
PP = $79.49
|
|
MB = $83.46
|
Most Recent Note - 4/24/2018 6:07:47 PM
G - Slumped below its 50 DMA line ($78.20) with a big loss today raising concerns. Prior lows in the $71-72 area define important support. Due to report Mar '18 quarterly results on 4/25/18. Volume and volatility often increase near earnings news.
>>> FEATURED STOCK ARTICLE : Sputtering Below 50-Day Moving Average Again - 3/27/2018 |
View all notes |
Set NEW NOTE alert |
Company Profile |
SEC
News |
Chart |
Request a new note
C
A
S
I |
Symbol/Exchange
Company Name
Industry Group |
PRICE |
CHANGE
(%Change) |
Day High |
Volume
(% DAV)
(% 50 day avg vol) |
52 Wk Hi
% From Hi |
Featured
Date |
Price
Featured |
Pivot Featured |
|
Max Buy |
OLLI
-
NASDAQ
Ollie's Bargain Outlet
Retail-DiscountandVariety
|
$61.75
|
-0.50
-0.80% |
$62.50
|
898,304
136.52% of 50 DAV
50 DAV is 658,000
|
$64.45
-4.19%
|
4/10/2018
|
$62.05
|
PP = $62.15
|
|
MB = $65.26
|
Most Recent Note - 4/23/2018 6:32:14 PM
Y - Stalled since it encountered distributional pressure and finished unchanged on 4/11/18 after hitting a new all-time high. Confirming gains above the pivot point backed by at least +40% above average volume are needed to trigger a proper technical buy signal.
>>> FEATURED STOCK ARTICLE : Encountered Distribution, Finished Below Pivot Point After Early Gain - 4/11/2018 |
View all notes |
Set NEW NOTE alert |
Company Profile |
SEC
News |
Chart |
Request a new note
C
A
S
I |
WB
-
NASDAQ
Weibo Corp Cl A Ads
INTERNET - Content
|
$114.13
|
-3.82
-3.24% |
$121.78
|
2,107,222
110.33% of 50 DAV
50 DAV is 1,910,000
|
$142.12
-19.69%
|
1/16/2018
|
$126.33
|
PP = $122.21
|
|
MB = $128.32
|
Most Recent Note - 4/24/2018 5:54:23 PM
G - Suffered a big loss today with higher (near average) volume. Subsequent gains above the 50 DMA line ($126.57) still are needed for its outlook to improve. Prior lows in the $109 area define important near-term support above its 200 DMA line ($107.90).
>>> FEATURED STOCK ARTICLE : Quietly Slumping Near Prior Low - 4/6/2018 |
View all notes |
Set NEW NOTE alert |
Company Profile |
SEC
News |
Chart |
Request a new note
C
A
S
I |
NOVT
-
NASDAQ
Novanta Inc
Elec-Scientific/Msrng
|
$61.30
|
-0.75
-1.21% |
$63.50
|
224,578
101.16% of 50 DAV
50 DAV is 222,000
|
$63.60
-3.62%
|
4/17/2018
|
$60.55
|
PP = $60.40
|
|
MB = $63.42
|
Most Recent Note - 4/18/2018 1:30:37 PM
Y - Tallying a 7th consecutive gain today, hitting another new high and approaching its "max buy" level. Finished strong after highlighted in yellow with pivot point cited based on its 1/29/18 high plus 10 cents in the 4/17/18 mid-day report. The big gain above the stock's pivot point backed by +67% above average volume triggered a technical buy signal. Reported earnings +26% on +49% sales revenues for the Dec '17 quarter. and 3 of the past 4 quarterly earnings comparisons were above the +25% minimum guideline (C criteria). Sales revenues growth has shown encouraging acceleration. See the latest FSU analysis for more details and an annotated graph.
>>> FEATURED STOCK ARTICLE : Volume-Driven Gain Hit New All-Time High - 4/17/2018 |
View all notes |
Set NEW NOTE alert |
Company Profile |
SEC
News |
Chart |
Request a new note
C
A
S
I |
SQ
-
NYSE
Square Inc Cl A
Finance-CrdtCard/PmtPr
|
$46.01
|
-4.34
-8.62% |
$50.35
|
18,346,159
131.92% of 50 DAV
50 DAV is 13,907,000
|
$58.46
-21.30%
|
3/5/2018
|
$49.70
|
PP = $49.66
|
|
MB = $52.14
|
Most Recent Note - 4/24/2018 5:49:38 PM
G - Big loss today with above average volume violated its 50 DMA line ($48.91) triggering a technical sell signal. Subsequent losses below the prior low ($44.94 on 4/06/18) would raise greater concerns.
>>> FEATURED STOCK ARTICLE : Slumped Back Into Prior Base Testing 50-Day Average - 4/2/2018 |
View all notes |
Set NEW NOTE alert |
Company Profile |
SEC
News |
Chart |
Request a new note
C
A
S
I |
SEND
-
NYSE
Sendgrid Inc
INTERNET - Content
|
$28.69
|
+0.37
1.31% |
$29.30
|
527,166
143.64% of 50 DAV
50 DAV is 367,000
|
$32.03
-10.42%
|
3/6/2018
|
$28.00
|
PP = $28.37
|
|
MB = $29.79
|
Most Recent Note - 4/19/2018 5:48:49 PM
G - Rebounding further above its 50 DMA line ($27.03) with additional gains on below average volume. Showing resilience after it priced a new Public Offering and Secondary Offering on 4/05/18.
>>> FEATURED STOCK ARTICLE : Slumped Into Prior Base Testing 50-Day Average - 4/3/2018 |
View all notes |
Set NEW NOTE alert |
Company Profile |
SEC
News |
Chart |
Request a new note
C
A
S
I |
Symbol/Exchange
Company Name
Industry Group |
PRICE |
CHANGE
(%Change) |
Day High |
Volume
(% DAV)
(% 50 day avg vol) |
52 Wk Hi
% From Hi |
Featured
Date |
Price
Featured |
Pivot Featured |
|
Max Buy |