***Last / Change / Volume data in this table is the closing quote data***
Symbol/Exchange
Company Name
Industry Group |
PRICE |
CHANGE
(%Change) |
Day High |
Volume
(% DAV)
(% 50 day avg vol) |
52 Wk Hi
% From Hi |
Featured
Date |
Price
Featured |
Pivot Featured |
|
Max Buy |
PFBC
-
NASDAQ
Preferred Bank Los Angls
BANKING - Regional - Pacific Banks
|
$66.44
|
+1.18
1.81% |
$66.68
|
45,161
54.28% of 50 DAV
50 DAV is 83,200
|
$67.65
-1.79%
|
4/10/2018
|
$64.56
|
PP = $67.75
|
|
MB = $71.14
|
Most Recent Note - 4/16/2018 1:00:46 PM
Y - Quietly consolidating near its 50 DMA line ($64.13), holding its ground within striking distance of the new pivot point cited based on its 1/22/18 high plus 10 cents. Subsequent volume-driven gains for new highs may trigger a technical buy signal. Due to report results for the first quarter ended March 31, 2018 after the close of the market on Thursday, April 19, 2018. Volume and volatility often increase near earnings news.
>>> FEATURED STOCK ARTICLE : Bank Stock Hovering Within Striking Distance of Prior High - 4/10/2018 |
View all notes |
Set NEW NOTE alert |
Company Profile |
SEC
News |
Chart |
Request a new note
C
A
S
I |
SIVB
-
NASDAQ
S V B Financial Group
BANKING - Regional - Pacific Banks
|
$249.14
|
+6.42
2.65% |
$251.16
|
585,471
79.55% of 50 DAV
50 DAV is 736,000
|
$271.79
-8.33%
|
3/12/2018
|
$267.79
|
PP = $263.19
|
|
MB = $276.35
|
 Most Recent Note - 4/19/2018 5:50:45 PM
Y - Consolidating near its 50 DMA line ($249.23). Found support when recently sputtering near the prior low ($226.61 on 2/06/18). More damaging losses would raise greater concerns and trigger a worrisome technical sell signal.
>>> FEATURED STOCK ARTICLE : Rebounded Above its 50-Day Moving Average - 4/12/2018 |
View all notes |
Set NEW NOTE alert |
Company Profile |
SEC
News |
Chart |
Request a new note
C
A
S
I |
TPL
-
NYSE
Texas Pacific Land Trust
FINANCIAL SERVICES - Diversified Investments
|
$546.19
|
+1.48
0.27% |
$551.80
|
10,181
78.32% of 50 DAV
50 DAV is 13,000
|
$569.99
-4.18%
|
4/13/2018
|
$547.85
|
PP = $552.10
|
|
MB = $579.71
|
Most Recent Note - 4/19/2018 5:52:20 PM
Y - Holding its ground with volume totals recently cooling. New pivot point was cited based on its 2/28/18 high plus 10 cents. Subsequent gains above the pivot point with more than+40% above average volume may trigger a new (or add-on) technical buy signal. Very little resistance remains due to overhead supply up to the $569 level. Recent lows ($480) define important support where damaging losses may trigger a worrisome technical sell signal.
>>> FEATURED STOCK ARTICLE : Slump Under 50-Day Average Line Hurt Near Term Outlook - 3/23/2018 |
View all notes |
Set NEW NOTE alert |
Company Profile |
SEC
News |
Chart |
Request a new note
C
A
S
I |
LMAT
-
NASDAQ
Lemaitre Vascular Inc
Medical-Products
|
$41.02
|
+0.30
0.74% |
$41.22
|
183,958
133.30% of 50 DAV
50 DAV is 138,000
|
$41.25
-0.56%
|
3/19/2018
|
$36.77
|
PP = $39.98
|
|
MB = $41.98
|
Most Recent Note - 4/16/2018 5:49:40 PM
Y - Posted a gain on light volume today for a new all-time high. Triggered a technical buy signal as it posted a solid gain on 4/11/18 with +87% above average volume, rising above the new pivot point cited based on its 10/20/17 high plus 10 cents. Found support recently near its 50 DMA line ($36.28). See the latest FSU analysis for more details and an annotated graph.
>>> FEATURED STOCK ARTICLE : Gain With Heavy Volume Triggered Technical Buy Signal - 4/13/2018 |
View all notes |
Set NEW NOTE alert |
Company Profile |
SEC
News |
Chart |
Request a new note
C
A
S
I |
DPZ
-
NYSE
Dominos Pizza Inc
WHOLESALE - Food Wholesale
|
$240.69
|
+2.50
1.05% |
$241.41
|
399,388
42.44% of 50 DAV
50 DAV is 941,000
|
$239.21
0.62%
|
2/20/2018
|
$224.86
|
PP = $222.01
|
|
MB = $233.11
|
Most Recent Note - 4/19/2018 1:28:22 PM
G - Color code is changed to green after recently wedging above its "max buy" level with gains this week lacking great volume conviction. Its 50 DMA line ($226.11) and recent lows define near-term support to watch.
>>> FEATURED STOCK ARTICLE : Popular Pizza Firm Perched Near All Time High - 3/21/2018 |
View all notes |
Set NEW NOTE alert |
Company Profile |
SEC
News |
Chart |
Request a new note
C
A
S
I |
Symbol/Exchange
Company Name
Industry Group |
PRICE |
CHANGE
(%Change) |
Day High |
Volume
(% DAV)
(% 50 day avg vol) |
52 Wk Hi
% From Hi |
Featured
Date |
Price
Featured |
Pivot Featured |
|
Max Buy |
FIVE
-
NASDAQ
Five Below Inc
Retail-DiscountandVariety
|
$74.79
|
-1.27
-1.67% |
$76.40
|
1,563,862
109.90% of 50 DAV
50 DAV is 1,423,000
|
$78.28
-4.46%
|
3/9/2018
|
$68.58
|
PP = $73.65
|
|
MB = $77.33
|
Most Recent Note - 4/18/2018 5:37:37 PM
Y - There was a "negative reversal" today for a loss on heavy volume after briefly trading above its "max buy" level and hitting a new all-time high. Prior highs in the $73 area define initial support to watch on pullbacks.
>>> FEATURED STOCK ARTICLE : Quietly Hovering Near All-Time High - 4/5/2018 |
View all notes |
Set NEW NOTE alert |
Company Profile |
SEC
News |
Chart |
Request a new note
C
A
S
I |
NVEE
-
NASDAQ
N V 5 Global Inc
Comml Svcs-Consulting
|
$62.90
|
-0.45
-0.71% |
$63.93
|
85,518
104.29% of 50 DAV
50 DAV is 82,000
|
$64.50
-2.48%
|
4/9/2018
|
$58.35
|
PP = $59.05
|
|
MB = $62.00
|
Most Recent Note - 4/16/2018 3:12:05 PM
G - Color code is changed to green after gapping up and rising above its "max buy" level with today's big gain. Prior highs in the $58 area define initial support to watch on pullbacks. Hit a new all-time high with +95% above average volume behind its considerable 4/12/18 gain above the pivot point triggering a technical buy signal.
>>> FEATURED STOCK ARTICLE : Perched Near High After 3 Strong Quarterly Comparisons - 4/9/2018 |
View all notes |
Set NEW NOTE alert |
Company Profile |
SEC
News |
Chart |
Request a new note
C
A
S
I |
QLYS
-
NASDAQ
Qualys Inc
Computer Sftwr-Security
|
$82.75
|
-1.70
-2.01% |
$84.95
|
440,497
127.31% of 50 DAV
50 DAV is 346,000
|
$85.00
-2.65%
|
4/17/2018
|
$82.85
|
PP = $79.50
|
|
MB = $83.48
|
Most Recent Note - 4/19/2018 1:02:37 PM
G - Perched at its all-time high today following 3 consecutive volume-driven gains. Color code was changed to green after quickly rising above its "max buy" level. Prior high in the $79 area defines initial support to watch on pullbacks. See the latest FSU analysis for more details and an annotated graph.
>>> FEATURED STOCK ARTICLE : Quickly Rallied More Than 5% Above Prior High - 4/18/2018 |
View all notes |
Set NEW NOTE alert |
Company Profile |
SEC
News |
Chart |
Request a new note
C
A
S
I |
SPLK
-
NASDAQ
Splunk Inc
Computer Sftwr-Database
|
$105.91
|
-0.89
-0.83% |
$107.64
|
1,139,766
54.48% of 50 DAV
50 DAV is 2,092,000
|
$112.66
-5.99%
|
2/15/2018
|
$96.06
|
PP = $93.68
|
|
MB = $98.36
|
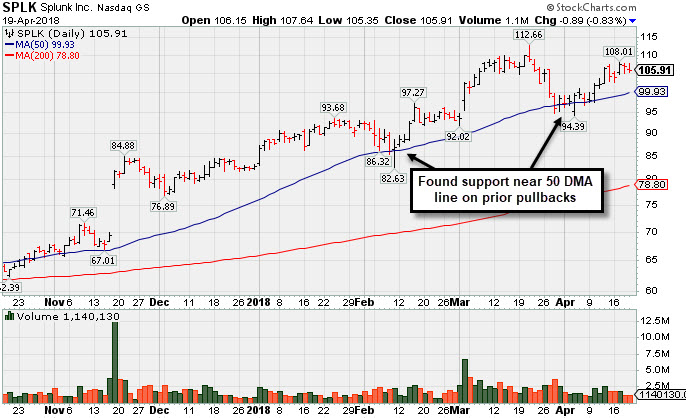
Most Recent Note - 4/19/2018 5:43:25 PM
G - Recently found support near its 50 DMA line ($99.93) but it has not formed a sound base. More damaging losses would raise greater concerns. See the latest FSU analysis for more details and a new annotated graph.
>>> FEATURED STOCK ARTICLE : Found Support Near 50-Day Average on Pullbacks - 4/19/2018 |
View all notes |
Set NEW NOTE alert |
Company Profile |
SEC
News |
Chart |
Request a new note
C
A
S
I |
PAYC
-
NYSE
Paycom Software Inc
COMPUTER SOFTWARE and SERVICES - Application Software
|
$116.76
|
-0.86
-0.73% |
$117.70
|
433,723
57.29% of 50 DAV
50 DAV is 757,000
|
$118.45
-1.43%
|
2/15/2018
|
$95.01
|
PP = $93.61
|
|
MB = $98.29
|
Most Recent Note - 4/17/2018 1:01:04 PM
G - Hitting a new all-time high today after a brief consolidation. Its 50 DMA line ($102.92) and recent low ($101.55 on 4/04/18) define important near-term support to watch on pullbacks.
>>> FEATURED STOCK ARTICLE : Pulling Back After Negative Reversal at All-Time High Last Week - 4/4/2018 |
View all notes |
Set NEW NOTE alert |
Company Profile |
SEC
News |
Chart |
Request a new note
C
A
S
I |
Symbol/Exchange
Company Name
Industry Group |
PRICE |
CHANGE
(%Change) |
Day High |
Volume
(% DAV)
(% 50 day avg vol) |
52 Wk Hi
% From Hi |
Featured
Date |
Price
Featured |
Pivot Featured |
|
Max Buy |
GRUB
-
NYSE
Grubhub Inc
COMPUTER SOFTWARE and SERVICES - Technical and System Software
|
$101.74
|
-1.33
-1.29% |
$103.45
|
973,702
49.75% of 50 DAV
50 DAV is 1,957,000
|
$112.41
-9.49%
|
6/21/2017
|
$47.33
|
PP = $46.94
|
|
MB = $49.29
|
Most Recent Note - 4/17/2018 12:42:56 PM
G - Rallying today after finding support at its 50 DMA line ($98.75) in recent weeks. Subsequent losses below the 50 DMA line and recent low ($94.08 on 4/04/18) would raise more serious concerns and trigger technical sell signals.
>>> FEATURED STOCK ARTICLE : Very Extended and Enduring Distributional Pressure - 3/29/2018 |
View all notes |
Set NEW NOTE alert |
Company Profile |
SEC
News |
Chart |
Request a new note
C
A
S
I |
HQY
-
NASDAQ
Healthequity Inc
COMPUTER SOFTWARE and SERVICES - Healthcare Information Service
|
$66.19
|
+0.10
0.15% |
$66.99
|
409,819
52.27% of 50 DAV
50 DAV is 784,000
|
$68.75
-3.72%
|
2/20/2018
|
$56.37
|
PP = $55.41
|
|
MB = $58.18
|
Most Recent Note - 4/16/2018 12:49:40 PM
G - Volume totals have been cooling in recent weeks while hovering near its all-time high. It is extended from any sound base. Its 50 DMA line ($58.33) defines near term support above prior highs.
>>> FEATURED STOCK ARTICLE : Bullish Action Followed Latest Earnings Report - 3/22/2018 |
View all notes |
Set NEW NOTE alert |
Company Profile |
SEC
News |
Chart |
Request a new note
C
A
S
I |
LOB
-
NASDAQ
Live Oak Bancshares Inc
Banks-Southeast
|
$28.50
|
+0.10
0.35% |
$28.96
|
127,948
94.78% of 50 DAV
50 DAV is 135,000
|
$30.05
-5.16%
|
3/16/2018
|
$28.63
|
PP = $28.30
|
|
MB = $29.72
|
Most Recent Note - 4/16/2018 5:47:18 PM
Y - Quietly consolidating above its pivot point after testing its 50 DMA line ($27.56). Subsequent damaging losses would raise greater concerns. See the latest FSU analysis for more details and a new annotated graph.
>>> FEATURED STOCK ARTICLE : Tested Support at 50-Day Moving Average After Breakout - 4/16/2018 |
View all notes |
Set NEW NOTE alert |
Company Profile |
SEC
News |
Chart |
Request a new note
C
A
S
I |
PYPL
-
NASDAQ
Paypal Holdings Inc
Finance-CrdtCard/PmtPr
|
$79.68
|
-0.66
-0.82% |
$80.39
|
6,101,100
69.65% of 50 DAV
50 DAV is 8,760,000
|
$86.32
-7.69%
|
2/1/2018
|
$80.35
|
PP = $79.49
|
|
MB = $83.46
|
Most Recent Note - 4/19/2018 5:46:52 PM
G - Quietly consolidating above its 50 DMA line ($78.01). Halted its slide above the prior low ($71.63 on 2/09/18) which defines the next important support level. Due to report Mar '18 quarterly results on 4/25/18.
>>> FEATURED STOCK ARTICLE : Sputtering Below 50-Day Moving Average Again - 3/27/2018 |
View all notes |
Set NEW NOTE alert |
Company Profile |
SEC
News |
Chart |
Request a new note
C
A
S
I |
OLLI
-
NASDAQ
Ollie's Bargain Outlet
Retail-DiscountandVariety
|
$62.80
|
-0.80
-1.26% |
$63.50
|
391,437
59.67% of 50 DAV
50 DAV is 656,000
|
$64.45
-2.56%
|
4/10/2018
|
$62.05
|
PP = $62.15
|
|
MB = $65.26
|
Most Recent Note - 4/16/2018 12:55:15 PM
Y - Encountered distributional pressure and finished unchanged on 4/11/18 after hitting a new all-time high. Confirming gains above the pivot point backed by at least +40% above average volume are needed to trigger a proper technical buy signal.
>>> FEATURED STOCK ARTICLE : Encountered Distribution, Finished Below Pivot Point After Early Gain - 4/11/2018 |
View all notes |
Set NEW NOTE alert |
Company Profile |
SEC
News |
Chart |
Request a new note
C
A
S
I |
Symbol/Exchange
Company Name
Industry Group |
PRICE |
CHANGE
(%Change) |
Day High |
Volume
(% DAV)
(% 50 day avg vol) |
52 Wk Hi
% From Hi |
Featured
Date |
Price
Featured |
Pivot Featured |
|
Max Buy |
WB
-
NASDAQ
Weibo Corp Cl A Ads
INTERNET - Content
|
$118.32
|
-0.06
-0.05% |
$118.96
|
799,045
40.21% of 50 DAV
50 DAV is 1,987,000
|
$142.12
-16.75%
|
1/16/2018
|
$126.33
|
PP = $122.21
|
|
MB = $128.32
|
Most Recent Note - 4/19/2018 5:53:42 PM
G - Still sputtering after it met resistance near its 50 DMA line ($126.44) last week. Subsequent gains above that short-term average are still needed for its outlook to improve. Prior lows in the $109 area define near-term support above its 200 DMA line ($107).
>>> FEATURED STOCK ARTICLE : Quietly Slumping Near Prior Low - 4/6/2018 |
View all notes |
Set NEW NOTE alert |
Company Profile |
SEC
News |
Chart |
Request a new note
C
A
S
I |
NOVT
-
NASDAQ
Novanta Inc
Elec-Scientific/Msrng
|
$62.30
|
-0.65
-1.03% |
$63.08
|
160,751
70.50% of 50 DAV
50 DAV is 228,000
|
$63.60
-2.04%
|
4/17/2018
|
$60.55
|
PP = $60.40
|
|
MB = $63.42
|
Most Recent Note - 4/18/2018 1:30:37 PM
Y - Tallying a 7th consecutive gain today, hitting another new high and approaching its "max buy" level. Finished strong after highlighted in yellow with pivot point cited based on its 1/29/18 high plus 10 cents in the 4/17/18 mid-day report. The big gain above the stock's pivot point backed by +67% above average volume triggered a technical buy signal. Reported earnings +26% on +49% sales revenues for the Dec '17 quarter. and 3 of the past 4 quarterly earnings comparisons were above the +25% minimum guideline (C criteria). Sales revenues growth has shown encouraging acceleration. See the latest FSU analysis for more details and an annotated graph.
>>> FEATURED STOCK ARTICLE : Volume-Driven Gain Hit New All-Time High - 4/17/2018 |
View all notes |
Set NEW NOTE alert |
Company Profile |
SEC
News |
Chart |
Request a new note
C
A
S
I |
SQ
-
NYSE
Square Inc Cl A
Finance-CrdtCard/PmtPr
|
$50.63
|
-0.75
-1.46% |
$51.58
|
8,810,872
61.35% of 50 DAV
50 DAV is 14,362,000
|
$58.46
-13.39%
|
3/5/2018
|
$49.70
|
PP = $49.66
|
|
MB = $52.14
|
Most Recent Note - 4/17/2018 7:29:45 PM
G - Posted a gain with lighter than average volume today and closed above its 50 DMA line ($47.98) helping its outlook improve. It has not formed a sound base.
>>> FEATURED STOCK ARTICLE : Slumped Back Into Prior Base Testing 50-Day Average - 4/2/2018 |
View all notes |
Set NEW NOTE alert |
Company Profile |
SEC
News |
Chart |
Request a new note
C
A
S
I |
SEND
-
NYSE
Sendgrid Inc
INTERNET - Content
|
$28.07
|
+0.00
0.00% |
$28.43
|
201,221
55.74% of 50 DAV
50 DAV is 361,000
|
$32.03
-12.35%
|
3/6/2018
|
$28.00
|
PP = $28.37
|
|
MB = $29.79
|
Most Recent Note - 4/19/2018 5:48:49 PM
G - Rebounding further above its 50 DMA line ($27.03) with additional gains on below average volume. Showing resilience after it priced a new Public Offering and Secondary Offering on 4/05/18.
>>> FEATURED STOCK ARTICLE : Slumped Into Prior Base Testing 50-Day Average - 4/3/2018 |
View all notes |
Set NEW NOTE alert |
Company Profile |
SEC
News |
Chart |
Request a new note
C
A
S
I |