***Last / Change / Volume data in this table is the closing quote data***
Symbol/Exchange
Company Name
Industry Group |
PRICE |
CHANGE
(%Change) |
Day High |
Volume
(% DAV)
(% 50 day avg vol) |
52 Wk Hi
% From Hi |
Featured
Date |
Price
Featured |
Pivot Featured |
|
Max Buy |
PFBC
-
NASDAQ
Preferred Bank Los Angls
BANKING - Regional - Pacific Banks
|
$63.25
|
+0.47
0.75% |
$64.28
|
68,531
80.34% of 50 DAV
50 DAV is 85,300
|
$67.65
-6.50%
|
4/10/2018
|
$64.56
|
PP = $67.75
|
|
MB = $71.14
|
Most Recent Note - 5/1/2018 1:05:56 PM
G - Color code is changed to green while slumping below its 50 DMA line ($64.84) this week and also undercutting the prior low, raising concerns and triggering technical sell signals. A prompt rebound above the 50 DMA line is needed for its outlook to improve.
>>> FEATURED STOCK ARTICLE : Bank Stock Hovering Within Striking Distance of Prior High - 4/10/2018 |
View all notes |
Set NEW NOTE alert |
Company Profile |
SEC
News |
Chart |
Request a new note
C
A
S
I |
SIVB
-
NASDAQ
S V B Financial Group
BANKING - Regional - Pacific Banks
|
$305.82
|
+2.34
0.77% |
$309.23
|
503,603
62.95% of 50 DAV
50 DAV is 800,000
|
$309.40
-1.16%
|
3/12/2018
|
$267.79
|
PP = $263.19
|
|
MB = $276.35
|
Most Recent Note - 5/2/2018 5:14:09 PM
G - Color code is changed to green. Holding its ground stubbornly following a big "breakaway gap" for a new high on 4/27/18. Bullish action came after it reported financial results for the quarter ended March 31, 2018 and earnings rose +90% on +34% sales revenues versus the year ago period.
>>> FEATURED STOCK ARTICLE : Rebounded Above its 50-Day Moving Average - 4/12/2018 |
View all notes |
Set NEW NOTE alert |
Company Profile |
SEC
News |
Chart |
Request a new note
C
A
S
I |
MA
-
NYSE
Mastercard Inc Cl A
DIVERSIFIED SERVICES - Business/Management Services
|
$188.17
|
+1.69
0.91% |
$188.79
|
3,582,509
87.14% of 50 DAV
50 DAV is 4,111,000
|
$188.25
-0.04%
|
5/2/2018
|
$184.96
|
PP = $183.83
|
|
MB = $193.02
|
Most Recent Note - 5/2/2018 12:31:00 PM
Y - Color code is changed to yellow with pivot point cited based on its 3/13/18 high plus 10 cents. Gapped up today hitting a new all-time high, rising from a riskier "late stage" base. Reported earnings +49% on +31% sales revenues for the Mar '18 quarter. Helping it better match the winning models of the fact-based investment system, sequential quarterly comparisons have shown encouraging sales revenues acceleration and earnings increases above the +25% minimum earnings guideline (C criteria). Annual earnings growth has been good.
>>> FEATURED STOCK ARTICLE : Gap Up and Volume Driven Gain for New High After Earnings - 5/2/2018 |
View all notes |
Set NEW NOTE alert |
Company Profile |
SEC
News |
Chart |
Request a new note
C
A
S
I |
V
-
NYSE
Visa Inc Cl A
DIVERSIFIED SERVICES - Business/Management Services
|
$128.16
|
+0.98
0.77% |
$128.36
|
5,775,727
71.85% of 50 DAV
50 DAV is 8,039,000
|
$128.10
0.05%
|
4/26/2018
|
$126.68
|
PP = $126.98
|
|
MB = $133.33
|
Most Recent Note - 5/2/2018 5:16:00 PM
Y - Touched a new high today but reversed into the red. Finished strong after highlighted in yellow with pivot point cited based on its 1/29/18 high plus 10 cents in the 4/26/18 mid-day report. Reported earnings +29% on +13% sales revenues for the Mar '18 quarter, and 3 of the past 4 quarterly comparisons were above the +25% minimum earnings guideline (C criteria).
>>> FEATURED STOCK ARTICLE : Volume-Driven Gain For New High Triggered Technical Buy Signal - 4/26/2018 |
View all notes |
Set NEW NOTE alert |
Company Profile |
SEC
News |
Chart |
Request a new note
C
A
S
I |
TPL
-
NYSE
Texas Pacific Land Trust
FINANCIAL SERVICES - Diversified Investments
|
$628.13
|
+0.47
0.07% |
$636.73
|
17,851
119.01% of 50 DAV
50 DAV is 15,000
|
$639.88
-1.84%
|
4/13/2018
|
$547.85
|
PP = $552.10
|
|
MB = $579.71
|
Most Recent Note - 5/3/2018 1:29:02 PM
G - Hitting another new high today, getting very extended from the prior base. Reported strong results for the Mar '18 quarter and gapped up on 5/01/18 for a considerable volume-driven gain, rallying above the pivot point cited based on its 2/28/18 high plus 10 cents. No resistance remains due to overhead supply. On pullbacks the prior highs in the $569-552 area define initial support to watch above its 50 DMA line ($530).
>>> FEATURED STOCK ARTICLE : Perched Near Prior High After Showing Resilience - 4/20/2018 |
View all notes |
Set NEW NOTE alert |
Company Profile |
SEC
News |
Chart |
Request a new note
C
A
S
I |
Symbol/Exchange
Company Name
Industry Group |
PRICE |
CHANGE
(%Change) |
Day High |
Volume
(% DAV)
(% 50 day avg vol) |
52 Wk Hi
% From Hi |
Featured
Date |
Price
Featured |
Pivot Featured |
|
Max Buy |
STMP
-
NASDAQ
Stamps.com Inc
INTERNET - Internet Software and Services
|
$237.30
|
+8.95
3.92% |
$240.45
|
1,044,760
303.71% of 50 DAV
50 DAV is 344,000
|
$237.00
0.13%
|
5/4/2018
|
$234.15
|
PP = $233.23
|
|
MB = $244.89
|
 Most Recent Note - 5/4/2018 12:50:23 PM
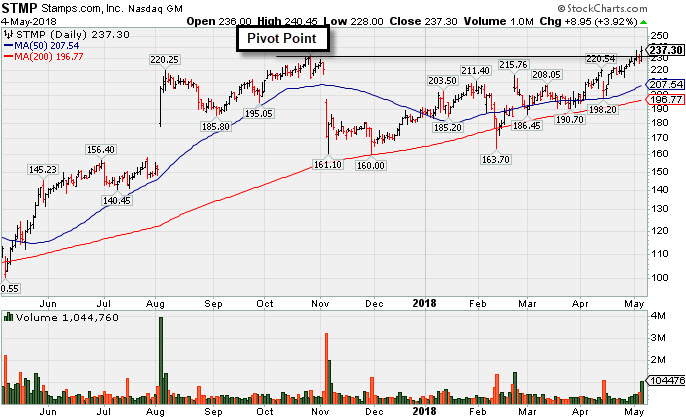
Y - Color code is changed to yellow with new pivot point cited based on its 10/26/17 high plus 10 cents. Clawing into new all-time high territory with above average volume behind gains this week. Fundamentals remain strong after it reported earnings +39% on +27% sales revenues for the Mar '18 quarter. Found support at its 200 DMA line after dropped from the Featured Stocks list on 11/30/17.
>>> FEATURED STOCK ARTICLE : Volume-Driven Gain For New High - 5/4/2018 |
View all notes |
Set NEW NOTE alert |
Company Profile |
SEC
News |
Chart |
Request a new note
C
A
S
I |
DPZ
-
NYSE
Dominos Pizza Inc
WHOLESALE - Food Wholesale
|
$248.24
|
+2.41
0.98% |
$249.20
|
307,452
42.06% of 50 DAV
50 DAV is 731,000
|
$255.00
-2.65%
|
2/20/2018
|
$224.86
|
PP = $222.01
|
|
MB = $233.11
|
Most Recent Note - 4/30/2018 6:18:16 PM
G - Pulled back today for a 2nd consecutive loss following a big 4/26/18 gap up for a new all-time high. Reported earnings +59% on +26% sales revenues for the Mar '18 quarter, continuing its strong earnings track record. Its 50 DMA line and recent lows define near-term support to watch on pullbacks.
>>> FEATURED STOCK ARTICLE : Earnings News Due From Pizza Firm - 4/23/2018 |
View all notes |
Set NEW NOTE alert |
Company Profile |
SEC
News |
Chart |
Request a new note
C
A
S
I |
FIVE
-
NASDAQ
Five Below Inc
Retail-DiscountandVariety
|
$71.27
|
-0.72
-1.00% |
$72.03
|
1,323,663
89.50% of 50 DAV
50 DAV is 1,479,000
|
$78.28
-8.96%
|
3/9/2018
|
$68.58
|
PP = $73.65
|
|
MB = $77.33
|
Most Recent Note - 4/30/2018 6:16:35 PM
Y - Fell below prior highs and into the prior base today raising concerns with a big loss on higher volume testing its 50 DMA line ($70.69). More damaging losses may trigger a more worrisome technical sell signal.
>>> FEATURED STOCK ARTICLE : Quietly Hovering Near All-Time High - 4/5/2018 |
View all notes |
Set NEW NOTE alert |
Company Profile |
SEC
News |
Chart |
Request a new note
C
A
S
I |
NVEE
-
NASDAQ
N V 5 Global Inc
Comml Svcs-Consulting
|
$65.40
|
+4.15
6.78% |
$71.90
|
217,592
265.36% of 50 DAV
50 DAV is 82,000
|
$64.50
1.40%
|
4/9/2018
|
$58.35
|
PP = $59.05
|
|
MB = $62.00
|
Most Recent Note - 5/4/2018 12:39:05 PM
G - Gapped up and quickly rallied above its "max buy" level and its color code was changed to green. Bullish action came after it reported earnings +51% on +48% sales revenues for the Mar '18 quarter, continuing its strong earnings track record. Disciplined investors avoid chasing stocks after they are extended from sound bases.
>>> FEATURED STOCK ARTICLE : Perched Near High After 3 Strong Quarterly Comparisons - 4/9/2018 |
View all notes |
Set NEW NOTE alert |
Company Profile |
SEC
News |
Chart |
Request a new note
C
A
S
I |
QLYS
-
NASDAQ
Qualys Inc
Computer Sftwr-Security
|
$74.30
|
+0.35
0.47% |
$75.00
|
230,094
68.28% of 50 DAV
50 DAV is 337,000
|
$85.00
-12.59%
|
4/17/2018
|
$82.85
|
PP = $79.50
|
|
MB = $83.48
|
Most Recent Note - 5/2/2018 12:40:59 PM
G - Reported earnings +80% on +22% sales revenues for the Mar '18 quarter. Gapped down today violating its 50 DMA line ($76.45) and also undercutting the prior low ($70.85 on 3/28/18) triggering technical sell signals. Its color code was changed to green. A rebound above the 50 DMA line is needed for its outlook to improve.
>>> FEATURED STOCK ARTICLE : Quickly Rallied More Than 5% Above Prior High - 4/18/2018 |
View all notes |
Set NEW NOTE alert |
Company Profile |
SEC
News |
Chart |
Request a new note
C
A
S
I |
Symbol/Exchange
Company Name
Industry Group |
PRICE |
CHANGE
(%Change) |
Day High |
Volume
(% DAV)
(% 50 day avg vol) |
52 Wk Hi
% From Hi |
Featured
Date |
Price
Featured |
Pivot Featured |
|
Max Buy |
SPLK
-
NASDAQ
Splunk Inc
Computer Sftwr-Database
|
$107.25
|
+1.42
1.34% |
$108.80
|
1,596,248
81.82% of 50 DAV
50 DAV is 1,951,000
|
$112.66
-4.80%
|
2/15/2018
|
$96.06
|
PP = $93.68
|
|
MB = $98.36
|
Most Recent Note - 5/2/2018 10:34:07 AM
G - Found prompt support near its 50 DMA line ($102) last week, but it has not formed a sound base. Subsequent losses and a breach of the prior low ($94.39 on 4/04/18) would raise more serious concerns.
>>> FEATURED STOCK ARTICLE : Found Support Near 50-Day Average on Pullbacks - 4/19/2018 |
View all notes |
Set NEW NOTE alert |
Company Profile |
SEC
News |
Chart |
Request a new note
C
A
S
I |
SUPN
-
NASDAQ
Supernus Pharmaceuticals
Medical-Biomed/Biotech
|
$45.85
|
-0.30
-0.65% |
$46.10
|
594,288
92.00% of 50 DAV
50 DAV is 646,000
|
$50.05
-8.38%
|
4/24/2018
|
$47.73
|
PP = $50.15
|
|
MB = $52.66
|
Most Recent Note - 5/1/2018 2:26:34 PM
Y - Still quietly hovering within close striking distance of its all-time high. Subsequent gains above the pivot point backed by at least +40% above average volume are needed to trigger a technical buy signal.
>>> FEATURED STOCK ARTICLE : Pharmaceutical Firm Perched Near Record High - 4/24/2018 |
View all notes |
Set NEW NOTE alert |
Company Profile |
SEC
News |
Chart |
Request a new note
C
A
S
I |
PAYC
-
NYSE
Paycom Software Inc
COMPUTER SOFTWARE and SERVICES - Application Software
|
$107.29
|
+2.17
2.06% |
$108.36
|
590,948
83.12% of 50 DAV
50 DAV is 711,000
|
$118.45
-9.42%
|
2/15/2018
|
$95.01
|
PP = $93.61
|
|
MB = $98.29
|
Most Recent Note - 5/3/2018 5:19:37 PM
G - Managed a "positive reversal" after an early loss today. Gapped down on the prior session and violated its 50 DMA line ($108.53) triggering a technical sell signal. Reported earnings +56% on +29% sales revenues for the Mar '18 quarter. Recent lows in the $101 area define important support to watch where further deterioration would raise concerns. A rebound above the 50 DMA line is needed for its outlook to improve. See the latest FSU analysis for more details and a new annotated graph.
>>> FEATURED STOCK ARTICLE : Violation of 50-Day Average Triggered Technical Sell Signal - 5/3/2018 |
View all notes |
Set NEW NOTE alert |
Company Profile |
SEC
News |
Chart |
Request a new note
C
A
S
I |
GRUB
-
NYSE
Grubhub Inc
COMPUTER SOFTWARE and SERVICES - Technical and System Software
|
$98.78
|
+1.99
2.06% |
$99.03
|
765,091
47.61% of 50 DAV
50 DAV is 1,607,000
|
$112.41
-12.13%
|
6/21/2017
|
$47.33
|
PP = $46.94
|
|
MB = $49.29
|
Most Recent Note - 5/1/2018 2:22:59 PM
G - Gapped down today after meeting resistance near its 50 DMA line ($101.81). Volume and volatility often increase near earnings news. Reported earnings +79% on +49% sales revenues for the Mar '18 quarter. See the latest FSU analysis for more details and an annotated graph.
>>> FEATURED STOCK ARTICLE : Consolidating Near 50 Day Average With Earnings News Due - 4/30/2018 |
View all notes |
Set NEW NOTE alert |
Company Profile |
SEC
News |
Chart |
Request a new note
C
A
S
I |
HQY
-
NASDAQ
Healthequity Inc
COMPUTER SOFTWARE and SERVICES - Healthcare Information Service
|
$69.34
|
+1.42
2.09% |
$70.00
|
629,550
92.31% of 50 DAV
50 DAV is 682,000
|
$68.75
0.86%
|
5/2/2018
|
$66.31
|
PP = $68.85
|
|
MB = $72.29
|
Most Recent Note - 5/2/2018 10:28:05 AM
Y - Volume totals have been below average while hovering in a tight range in recent weeks near its all-time high. Color code is changed to yellow with new pivot point cited based on its 3/22/18 high plus 10 cents. Subsequent volume-driven gains for new highs may trigger a new (or add-on) technical buy signal. Its 50 DMA line ($61.57) defines near term support above the recent low ($59.50 on 4/03/18).
>>> FEATURED STOCK ARTICLE : Perched Near All-Time High Building a Short New Base - 4/25/2018 |
View all notes |
Set NEW NOTE alert |
Company Profile |
SEC
News |
Chart |
Request a new note
C
A
S
I |
Symbol/Exchange
Company Name
Industry Group |
PRICE |
CHANGE
(%Change) |
Day High |
Volume
(% DAV)
(% 50 day avg vol) |
52 Wk Hi
% From Hi |
Featured
Date |
Price
Featured |
Pivot Featured |
|
Max Buy |
LOB
-
NASDAQ
Live Oak Bancshares Inc
Banks-Southeast
|
$28.50
|
+0.20
0.71% |
$28.75
|
106,153
79.22% of 50 DAV
50 DAV is 134,000
|
$30.05
-5.16%
|
3/16/2018
|
$28.63
|
PP = $28.30
|
|
MB = $29.72
|
Most Recent Note - 4/30/2018 6:10:15 PM
Y - Recently reported earnings +63% on +42% for the Mar '18 quarter. Consolidating above its 50 DMA line ($27.97) and prior lows where more damaging losses would raise greater concerns.
>>> FEATURED STOCK ARTICLE : Tested Support at 50-Day Moving Average After Breakout - 4/16/2018 |
View all notes |
Set NEW NOTE alert |
Company Profile |
SEC
News |
Chart |
Request a new note
C
A
S
I |
PYPL
-
NASDAQ
Paypal Holdings Inc
Finance-CrdtCard/PmtPr
|
$73.99
|
+0.54
0.74% |
$74.44
|
7,417,453
86.64% of 50 DAV
50 DAV is 8,561,000
|
$86.32
-14.28%
|
2/1/2018
|
$80.35
|
PP = $79.49
|
|
MB = $83.46
|
Most Recent Note - 5/2/2018 5:21:08 PM
G - Suffered a big loss today on more than 2 times average volume, testing its 200 DMA line ($71.84) and prior lows in the $71-72 area defining important support. More damaging losses would raise serious concerns. A rebound above the 50 DMA line ($77.88) is needed for its outlook to improve. Recently reported earnings +30% on +24% sales revenues for the Mar '18 quarter.
>>> FEATURED STOCK ARTICLE : Slumping Near Important Near-Term Support - 4/27/2018 |
View all notes |
Set NEW NOTE alert |
Company Profile |
SEC
News |
Chart |
Request a new note
C
A
S
I |
OLLI
-
NASDAQ
Ollie's Bargain Outlet
Retail-DiscountandVariety
|
$62.90
|
-0.10
-0.16% |
$63.50
|
469,803
71.51% of 50 DAV
50 DAV is 657,000
|
$64.45
-2.40%
|
4/10/2018
|
$62.05
|
PP = $62.15
|
|
MB = $65.26
|
Most Recent Note - 4/30/2018 6:11:56 PM
Y - Still quietly hovering near its all-time high with volume totals cooling. Confirming gains above the pivot point backed by at least +40% above average volume are needed to trigger a proper technical buy signal.
>>> FEATURED STOCK ARTICLE : Encountered Distribution, Finished Below Pivot Point After Early Gain - 4/11/2018 |
View all notes |
Set NEW NOTE alert |
Company Profile |
SEC
News |
Chart |
Request a new note
C
A
S
I |
NOVT
-
NASDAQ
Novanta Inc
Elec-Scientific/Msrng
|
$59.50
|
+1.40
2.41% |
$59.65
|
218,819
99.92% of 50 DAV
50 DAV is 219,000
|
$63.60
-6.45%
|
4/17/2018
|
$60.55
|
PP = $60.40
|
|
MB = $63.42
|
Most Recent Note - 5/2/2018 10:31:28 AM
Y - Undercut the prior high ($60.30 on 1/29/18) raising some concerns with recent losses. Stalled after recently rallying to new highs with an impressive streak of volume-driven gains. Prior highs in the $58 area define initial support to watch above its 50 DMA line ($55.97).
>>> FEATURED STOCK ARTICLE : Volume-Driven Gain Hit New All-Time High - 4/17/2018 |
View all notes |
Set NEW NOTE alert |
Company Profile |
SEC
News |
Chart |
Request a new note
C
A
S
I |
SEND
-
NYSE
Sendgrid Inc
INTERNET - Content
|
$26.37
|
+0.64
2.49% |
$26.53
|
379,788
93.77% of 50 DAV
50 DAV is 405,000
|
$32.03
-17.66%
|
3/6/2018
|
$28.00
|
PP = $28.37
|
|
MB = $29.79
|
Most Recent Note - 5/2/2018 5:24:04 PM
G - Violated its 50 DMA line ($27.96) today with a damaging volume-driven loss triggering a technical sell signal. Weak action came after it reported earnings +100% on +31% sales revenues for the Mar '18 quarter continuing its strong earnings track record. Completed a new Public Offering and Secondary Offering on 4/05/18.
>>> FEATURED STOCK ARTICLE : Earnings News Continues to be Strong - 5/1/2018 |
View all notes |
Set NEW NOTE alert |
Company Profile |
SEC
News |
Chart |
Request a new note
C
A
S
I |
Symbol/Exchange
Company Name
Industry Group |
PRICE |
CHANGE
(%Change) |
Day High |
Volume
(% DAV)
(% 50 day avg vol) |
52 Wk Hi
% From Hi |
Featured
Date |
Price
Featured |
Pivot Featured |
|
Max Buy |