You are not logged in.
This means you
CAN ONLY VIEW reports that were published prior to Wednesday, March 19, 2025.
You
MUST UPGRADE YOUR MEMBERSHIP if you want to see any current reports.
AFTER MARKET UPDATE - TUESDAY, MAY 1ST, 2018
Previous After Market Report Next After Market Report >>>
|
|
|
|
DOW |
-64.10 |
24,099.05 |
-0.27% |
|
Volume |
807,104,240 |
-20% |
|
Volume |
1,907,657,411 |
-4% |
|
NASDAQ |
+64.43 |
7,130.70 |
+0.91% |
|
Advancers |
1,561 |
53% |
|
Advancers |
1,676 |
60% |
|
S&P 500 |
+6.75 |
2,654.80 |
+0.25% |
|
Decliners |
1,386 |
47% |
|
Decliners |
1,136 |
40% |
|
Russell 2000 |
+8.44 |
1,550.33 |
+0.55% |
|
52 Wk Highs |
35 |
|
|
52 Wk Highs |
38 |
|
|
S&P 600 |
+4.37 |
951.88 |
+0.46% |
|
52 Wk Lows |
101 |
|
|
52 Wk Lows |
91 |
|
|
 |
Leadership Waned as Major Indices Ended Mixed
Kenneth J. Gruneisen - Passed the CAN SLIM® Master's Exam
Stocks finished mixed Tuesday. The Dow was down 64 points to 24099, while the S&P 500 added 6 points to 2654. The Nasdaq Composite gained 64 points to 7130. The volume totals reported were lighter than the prior session totals on the NYSE and on the Nasdaq exchange. Breadth was slightly positive as advancers led decliners by an 8-7 margin on the NYSE and by a 4-3 margin on the Nasdaq exchange. Leadership thinned as there were 14 high-ranked companies from the Leaders List that made new 52-week highs and were listed on the BreakOuts Page, versus the total of 35 on the prior session. New 52-week lows outnumbered new 52-week highs on the NYSE and on the Nasdaq exchange. The major indices (M criteria) have slumped as the latest confirmed rally has come under pressure. New buying efforts are justified only when all key criteria of the fact-based investment system are satisfied. The Featured Stocks Page provides the most timely analysis on high-ranked leaders. Charts used courtesy of www.stockcharts.com
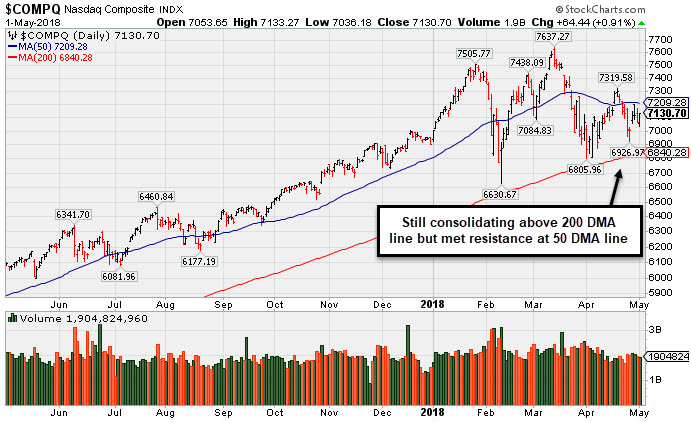 PICTURED: The Nasdaq Composite Index met resistance at its 50-day moving average (DMA) line recently. It is consolidating above the 200 DMA line and prior lows which define important near-term support.
The major averages rebounded from session lows as investors remain focused on corporate earnings. In central bank news, the Federal Reserve commenced their two-day policy summit and is expected to leave interest rates unchanged at the conclusion of the meeting tomorrow. On the data front, the ISM manufacturing index showed April manufacturing expanded at the slowest pace in nine months, while prices paid were the highest since April 2011. In a separate release, construction spending for the month of March unexpectedly fell 1.7% versus estimates of a 0.5% gain. Meanwhile, President Trump announced an extension of tariff exemptions for the EU, Canada and Mexico until June 1.
Six of 11 sectors in the S&P 500 finished lower. Consumer Staples and Energy led decliners. Tech outperformed with Apple (AAPL +2.32%) climbing ahead of its quarterly report after the close. In earnings, Merck (MRK -1.51%) fell despite reporting a 150% rise in sales of a key cancer drug, while Pfizer (PFE -3.31%) fell after missing revenue expectations.
Treasuries weakened, with the yield on the 10-year note gaining two basis points to 2.97%. In commodities, WTI crude fell 1.6% to $67.46/barrel. COMEX gold was down 1.0% to $1305.70/ounce amid a stronger dollar. |
 Kenneth J. Gruneisen started out as a licensed stockbroker in August 1987, a couple of months prior to the historic stock market crash that took the Dow Jones Industrial Average down -22.6% in a single day. He has published daily fact-based fundamental and technical analysis on high-ranked stocks online for two decades. Through FACTBASEDINVESTING.COM, Kenneth provides educational articles, news, market commentary, and other information regarding proven investment systems that work in good times and bad.
Comments contained in the body of this report are technical opinions only and are not necessarily those of Gruneisen Growth Corp. The material herein has been obtained from sources believed to be reliable and accurate, however, its accuracy and completeness cannot be guaranteed. Our firm, employees, and customers may effect transactions, including transactions contrary to any recommendation herein, or have positions in the securities mentioned herein or options with respect thereto. Any recommendation contained in this report may not be suitable for all investors and it is not to be deemed an offer or solicitation on our part with respect to the purchase or sale of any securities. |
|
 |
Biotech, Semiconductor, and Retail Indexes Rose
Kenneth J. Gruneisen - Passed the CAN SLIM® Master's Exam
On Tuesday the Retail Index ($RLX +0.29%) eked out a tiny gain while the Bank Index ($BKX +0.09%) and the Broker/Dealer Index ($XBD +0.08%) finished flat. The tech sector was mixed as the Biotech Index ($BTK +1.00%) and Semiconductor Index ($SOX +1.73%) each posted a solid gain but the Networking Index ($NWX -1.56%) ended lower. Energy-linked groups fell as the Integrated Oil Index ($XOI -0.55%) and the Oil Services Index ($OSX -1.30%) both ended lower, meanwhile the Gold & Silver Index ($XAU +0.34%) posted a small gain. Charts courtesy of www.stockcharts.com
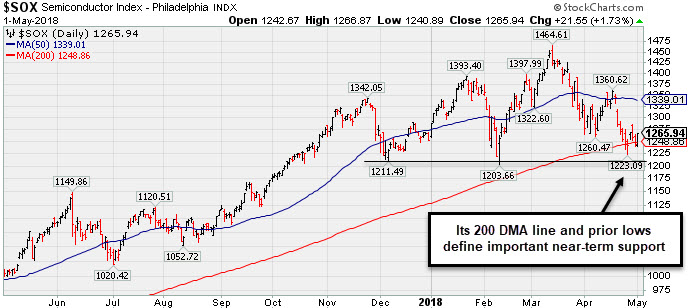 PICTURED: The Semiconductor Index ($SOX +1.73%) is consolidating above its 200-day moving average (DMA) line and prior lows defining important near-term support.
| Oil Services |
$OSX |
153.80 |
-2.03 |
-1.30% |
+2.84% |
| Integrated Oil |
$XOI |
1,464.10 |
-8.05 |
-0.55% |
+9.63% |
| Semiconductor |
$SOX |
1,265.94 |
+21.54 |
+1.73% |
+1.03% |
| Networking |
$NWX |
529.49 |
-8.41 |
-1.56% |
+7.94% |
| Broker/Dealer |
$XBD |
286.50 |
+0.22 |
+0.08% |
+8.01% |
| Retail |
$RLX |
2,029.41 |
+5.81 |
+0.29% |
+17.05% |
| Gold & Silver |
$XAU |
81.42 |
+0.27 |
+0.33% |
-4.52% |
| Bank |
$BKX |
107.10 |
+0.10 |
+0.09% |
+0.37% |
| Biotech |
$BTK |
4,519.80 |
+44.97 |
+1.00% |
+7.05% |
|
|
|
 |
Earnings News Continues to be Strong
Kenneth J. Gruneisen - Passed the CAN SLIM® Master's Exam
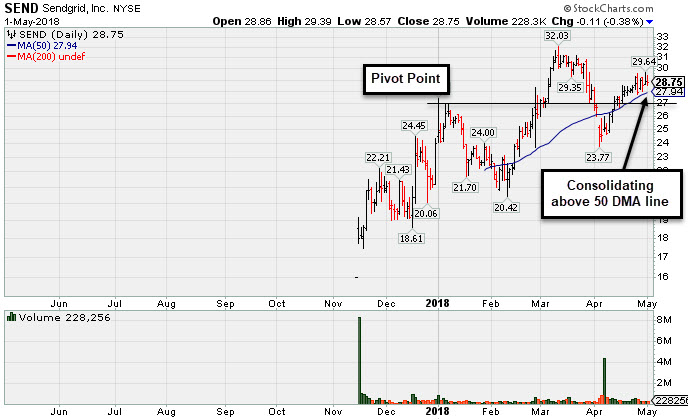
Sendgrid Inc (SEND -$0.11 or -0.38% to $28.75) has been quietly consolidating above its 50-day moving average DMA line ($27.94) with volume totals cooling. After Tuesday's close it reported earnings +100% on +31% sales revenues for the quarter ended March 31, 2018 versus the year ago period. Volume and volatility often increase near earnings news.
The company showed strong sales revenues and earnings increases in quarterly comparisons through Dec '17. It had a profitable FY '17 after years of shrinking losses of 29 cents per share in FY '14, a loss of 11 cents per share in FY '15, and a loss of 3 cents per share in FY '16. Some concerns remain due to its limited annual earnings (A criteria) history since its $16 IPO on 11/15/17.
SEND has shown resilience after it priced a new Public Offering and Secondary Offering on 4/05/18. It slumped back into the prior base, undercutting prior highs in the $27-28 area, raising concerns. Disciplined investors always limit losses by selling any stock that falls more than -7% from their purchase price. Any stock that was previously sold can always be bought back later if strength returns.
It was last shown in this FSU section on 4/03/18 under the headline , "Slumped Into Prior Base Testing 50-Day Average". It was highlighted in yellow with pivot point cited based on its 2/27/18 high in the 3/06/18 mid-day report (read here). There are only 41.4 million shares outstanding (S criteria). In Dec '17 102 top-rated funds reportedly own its shares,and that rose to 111 in Mar '18. Its current Up/Down Volume Ratio of 2.1 is an unbiased indication its shares have been under accumulation over the past 50 days. It has a Timeliness rating of A and a Sponsorship rating of B. |
|
|
Color Codes Explained :
Y - Better candidates highlighted by our
staff of experts.
G - Previously featured
in past reports as yellow but may no longer be buyable under the
guidelines.
***Last / Change / Volume data in this table is the closing quote data***
Symbol/Exchange
Company Name
Industry Group |
PRICE |
CHANGE
(%Change) |
Day High |
Volume
(% DAV)
(% 50 day avg vol) |
52 Wk Hi
% From Hi |
Featured
Date |
Price
Featured |
Pivot Featured |
|
Max Buy |
PFBC
-
NASDAQ
Preferred Bank Los Angls
BANKING - Regional - Pacific Banks
|
$63.25
|
-0.49
-0.77% |
$63.95
|
192,595
231.76% of 50 DAV
50 DAV is 83,100
|
$67.65
-6.50%
|
4/10/2018
|
$64.56
|
PP = $67.75
|
|
MB = $71.14
|
 Most Recent Note - 5/1/2018 1:05:56 PM
G - Color code is changed to green while slumping below its 50 DMA line ($64.84) this week and also undercutting the prior low, raising concerns and triggering technical sell signals. A prompt rebound above the 50 DMA line is needed for its outlook to improve.
>>> FEATURED STOCK ARTICLE : Bank Stock Hovering Within Striking Distance of Prior High - 4/10/2018 |
View all notes |
Set NEW NOTE alert |
Company Profile |
SEC
News |
Chart |
Request a new note
C
A
S
I |
SIVB
-
NASDAQ
S V B Financial Group
BANKING - Regional - Pacific Banks
|
$305.46
|
+5.85
1.95% |
$308.37
|
829,948
107.09% of 50 DAV
50 DAV is 775,000
|
$306.94
-0.48%
|
3/12/2018
|
$267.79
|
PP = $263.19
|
|
MB = $276.35
|
Most Recent Note - 4/27/2018 1:19:21 PM
Y - There was a big "breakaway gap" for a new high today after it reported financial results for the quarter ended March 31, 2018 and earnings rose +90% on +34% sales revenues versus the year ago period. Volume and volatility often increase near earnings news.
>>> FEATURED STOCK ARTICLE : Rebounded Above its 50-Day Moving Average - 4/12/2018 |
View all notes |
Set NEW NOTE alert |
Company Profile |
SEC
News |
Chart |
Request a new note
C
A
S
I |
V
-
NYSE
Visa Inc Cl A
DIVERSIFIED SERVICES - Business/Management Services
|
$127.51
|
+0.63
0.50% |
$127.57
|
6,391,488
79.79% of 50 DAV
50 DAV is 8,010,000
|
$127.90
-0.30%
|
4/26/2018
|
$126.68
|
PP = $126.98
|
|
MB = $133.33
|
Most Recent Note - 4/26/2018 7:12:26 PM
Y - Finished strong after highlighted in yellow with pivot point cited based on its 1/29/18 high plus 10 cents in the earlier mid-day report. Reported earnings +29% on +13% sales revenues for the Mar '18 quarter, and 3 of the past 4 quarterly comparisons were above the +25% minimum earnings guideline (C criteria). See the latest FSU analysis for more details and a new annotated graph.
>>> FEATURED STOCK ARTICLE : Volume-Driven Gain For New High Triggered Technical Buy Signal - 4/26/2018 |
View all notes |
Set NEW NOTE alert |
Company Profile |
SEC
News |
Chart |
Request a new note
C
A
S
I |
TPL
-
NYSE
Texas Pacific Land Trust
FINANCIAL SERVICES - Diversified Investments
|
$590.78
|
+45.90
8.42% |
$593.38
|
62,731
482.55% of 50 DAV
50 DAV is 13,000
|
$569.99
3.65%
|
4/13/2018
|
$547.85
|
PP = $552.10
|
|
MB = $579.71
|
Most Recent Note - 5/1/2018 1:17:34 PM
Y - Reported strong results for the Mar '18 quarter and gapped up today hitting a new all-time high with a considerable volume-driven gain, rallying above the pivot point cited based on its 2/28/18 high plus 10 cents. No resistance remains due to overhead supply. The 50 DMA line defines near-term support to watch above the recent lows ($480).
>>> FEATURED STOCK ARTICLE : Perched Near Prior High After Showing Resilience - 4/20/2018 |
View all notes |
Set NEW NOTE alert |
Company Profile |
SEC
News |
Chart |
Request a new note
C
A
S
I |
DPZ
-
NYSE
Dominos Pizza Inc
WHOLESALE - Food Wholesale
|
$247.68
|
+5.95
2.46% |
$248.83
|
642,063
72.30% of 50 DAV
50 DAV is 888,000
|
$255.00
-2.87%
|
2/20/2018
|
$224.86
|
PP = $222.01
|
|
MB = $233.11
|
Most Recent Note - 4/30/2018 6:18:16 PM
G - Pulled back today for a 2nd consecutive loss following a big 4/26/18 gap up for a new all-time high. Reported earnings +59% on +26% sales revenues for the Mar '18 quarter, continuing its strong earnings track record. Its 50 DMA line and recent lows define near-term support to watch on pullbacks.
>>> FEATURED STOCK ARTICLE : Earnings News Due From Pizza Firm - 4/23/2018 |
View all notes |
Set NEW NOTE alert |
Company Profile |
SEC
News |
Chart |
Request a new note
C
A
S
I |
Symbol/Exchange
Company Name
Industry Group |
PRICE |
CHANGE
(%Change) |
Day High |
Volume
(% DAV)
(% 50 day avg vol) |
52 Wk Hi
% From Hi |
Featured
Date |
Price
Featured |
Pivot Featured |
|
Max Buy |
FIVE
-
NASDAQ
Five Below Inc
Retail-DiscountandVariety
|
$70.50
|
-0.11
-0.16% |
$71.14
|
947,249
64.00% of 50 DAV
50 DAV is 1,480,000
|
$78.28
-9.94%
|
3/9/2018
|
$68.58
|
PP = $73.65
|
|
MB = $77.33
|
Most Recent Note - 4/30/2018 6:16:35 PM
Y - Fell below prior highs and into the prior base today raising concerns with a big loss on higher volume testing its 50 DMA line ($70.69). More damaging losses may trigger a more worrisome technical sell signal.
>>> FEATURED STOCK ARTICLE : Quietly Hovering Near All-Time High - 4/5/2018 |
View all notes |
Set NEW NOTE alert |
Company Profile |
SEC
News |
Chart |
Request a new note
C
A
S
I |
NVEE
-
NASDAQ
N V 5 Global Inc
Comml Svcs-Consulting
|
$58.75
|
-0.10
-0.17% |
$59.48
|
71,846
87.62% of 50 DAV
50 DAV is 82,000
|
$64.50
-8.91%
|
4/9/2018
|
$58.35
|
PP = $59.05
|
|
MB = $62.00
|
Most Recent Note - 4/26/2018 7:18:34 PM
Y - Color code is changed to yellow although a loss today on higher volume raised concerns while slumping below its pivot point and testing prior highs in the $58 area defining initial support.
>>> FEATURED STOCK ARTICLE : Perched Near High After 3 Strong Quarterly Comparisons - 4/9/2018 |
View all notes |
Set NEW NOTE alert |
Company Profile |
SEC
News |
Chart |
Request a new note
C
A
S
I |
QLYS
-
NASDAQ
Qualys Inc
Computer Sftwr-Security
|
$77.30
|
+0.35
0.45% |
$77.55
|
387,515
118.51% of 50 DAV
50 DAV is 327,000
|
$85.00
-9.06%
|
4/17/2018
|
$82.85
|
PP = $79.50
|
|
MB = $83.48
|
Most Recent Note - 4/25/2018 1:56:50 PM
Y - Color code is changed to yellow although now pulling back undercutting the prior high in the $79 area raising some concern. Today's 5th consecutive loss is testing its 50 DMA line ($75.80). Deterioration below the 50 DMA would raise concerns, and a violation of the prior low ($70.85 on 3/28/18) would trigger a more worrisome technical sell signal.
>>> FEATURED STOCK ARTICLE : Quickly Rallied More Than 5% Above Prior High - 4/18/2018 |
View all notes |
Set NEW NOTE alert |
Company Profile |
SEC
News |
Chart |
Request a new note
C
A
S
I |
SPLK
-
NASDAQ
Splunk Inc
Computer Sftwr-Database
|
$103.19
|
+0.54
0.53% |
$103.25
|
845,807
42.10% of 50 DAV
50 DAV is 2,009,000
|
$112.66
-8.41%
|
2/15/2018
|
$96.06
|
PP = $93.68
|
|
MB = $98.36
|
Most Recent Note - 4/25/2018 6:05:58 PM
G - Slumped below its 50 DMA line ($101.079) with a big loss today on +19% average volume doing more damage and triggering a technical sell signal. A subsequent loss on breach of the prior low ($94.39 on 4/04/18) would raise more serious concerns.
>>> FEATURED STOCK ARTICLE : Found Support Near 50-Day Average on Pullbacks - 4/19/2018 |
View all notes |
Set NEW NOTE alert |
Company Profile |
SEC
News |
Chart |
Request a new note
C
A
S
I |
SUPN
-
NASDAQ
Supernus Pharmaceuticals
Medical-Biomed/Biotech
|
$46.95
|
+0.05
0.11% |
$47.30
|
599,745
93.27% of 50 DAV
50 DAV is 643,000
|
$50.05
-6.18%
|
4/24/2018
|
$47.73
|
PP = $50.15
|
|
MB = $52.66
|
Most Recent Note - 5/1/2018 2:26:34 PM
Y - Still quietly hovering within close striking distance of its all-time high. Subsequent gains above the pivot point backed by at least +40% above average volume are needed to trigger a technical buy signal.
>>> FEATURED STOCK ARTICLE : Pharmaceutical Firm Perched Near Record High - 4/24/2018 |
View all notes |
Set NEW NOTE alert |
Company Profile |
SEC
News |
Chart |
Request a new note
C
A
S
I |
Symbol/Exchange
Company Name
Industry Group |
PRICE |
CHANGE
(%Change) |
Day High |
Volume
(% DAV)
(% 50 day avg vol) |
52 Wk Hi
% From Hi |
Featured
Date |
Price
Featured |
Pivot Featured |
|
Max Buy |
PAYC
-
NYSE
Paycom Software Inc
COMPUTER SOFTWARE and SERVICES - Application Software
|
$112.59
|
-1.62
-1.42% |
$114.00
|
1,684,718
255.26% of 50 DAV
50 DAV is 660,000
|
$118.45
-4.95%
|
2/15/2018
|
$95.01
|
PP = $93.61
|
|
MB = $98.29
|
Most Recent Note - 5/1/2018 1:02:30 PM
G - Due to report earnings news for the Mar '18 quarter after the close.It is extended from any sound base and perched near its all-time high, consolidating above its 50 DMA line ($108). Below that short term average the recent low ($101.55 on 4/04/18) defines important support to watch.
>>> FEATURED STOCK ARTICLE : Pulling Back After Negative Reversal at All-Time High Last Week - 4/4/2018 |
View all notes |
Set NEW NOTE alert |
Company Profile |
SEC
News |
Chart |
Request a new note
C
A
S
I |
GRUB
-
NYSE
Grubhub Inc
COMPUTER SOFTWARE and SERVICES - Technical and System Software
|
$92.65
|
-8.49
-8.39% |
$96.80
|
5,220,885
333.82% of 50 DAV
50 DAV is 1,564,000
|
$112.41
-17.58%
|
6/21/2017
|
$47.33
|
PP = $46.94
|
|
MB = $49.29
|
Most Recent Note - 5/1/2018 2:22:59 PM
G - Gapped down today after meeting resistance near its 50 DMA line ($101.81). Volume and volatility often increase near earnings news. Reported earnings +79% on +49% sales revenues for the Mar '18 quarter. See the latest FSU analysis for more details and an annotated graph.
>>> FEATURED STOCK ARTICLE : Consolidating Near 50 Day Average With Earnings News Due - 4/30/2018 |
View all notes |
Set NEW NOTE alert |
Company Profile |
SEC
News |
Chart |
Request a new note
C
A
S
I |
HQY
-
NASDAQ
Healthequity Inc
COMPUTER SOFTWARE and SERVICES - Healthcare Information Service
|
$66.03
|
+0.36
0.55% |
$66.17
|
354,049
50.22% of 50 DAV
50 DAV is 705,000
|
$68.75
-3.96%
|
2/20/2018
|
$56.37
|
PP = $55.41
|
|
MB = $58.18
|
Most Recent Note - 4/25/2018 5:58:26 PM
G - Volume totals have been cooling while hovering near its all-time high, possibly forming a short new flat base. Its 50 DMA line ($60.41) defines near term support above prior highs. See the latest FSU analysis for more details and a new annotated graph.
>>> FEATURED STOCK ARTICLE : Perched Near All-Time High Building a Short New Base - 4/25/2018 |
View all notes |
Set NEW NOTE alert |
Company Profile |
SEC
News |
Chart |
Request a new note
C
A
S
I |
LOB
-
NASDAQ
Live Oak Bancshares Inc
Banks-Southeast
|
$28.15
|
-0.10
-0.35% |
$28.25
|
113,936
85.67% of 50 DAV
50 DAV is 133,000
|
$30.05
-6.32%
|
3/16/2018
|
$28.63
|
PP = $28.30
|
|
MB = $29.72
|
Most Recent Note - 4/30/2018 6:10:15 PM
Y - Recently reported earnings +63% on +42% for the Mar '18 quarter. Consolidating above its 50 DMA line ($27.97) and prior lows where more damaging losses would raise greater concerns.
>>> FEATURED STOCK ARTICLE : Tested Support at 50-Day Moving Average After Breakout - 4/16/2018 |
View all notes |
Set NEW NOTE alert |
Company Profile |
SEC
News |
Chart |
Request a new note
C
A
S
I |
PYPL
-
NASDAQ
Paypal Holdings Inc
Finance-CrdtCard/PmtPr
|
$74.81
|
+0.20
0.27% |
$74.98
|
5,612,144
68.08% of 50 DAV
50 DAV is 8,243,000
|
$86.32
-13.33%
|
2/1/2018
|
$80.35
|
PP = $79.49
|
|
MB = $83.46
|
Most Recent Note - 5/1/2018 2:25:14 PM
G - Still lingering below its 50 DMA line ($77.97). Prior lows in the $71-72 area define important support. Recently reported earnings +30% on +24% sales revenues for the Mar '18 quarter.
>>> FEATURED STOCK ARTICLE : Slumping Near Important Near-Term Support - 4/27/2018 |
View all notes |
Set NEW NOTE alert |
Company Profile |
SEC
News |
Chart |
Request a new note
C
A
S
I |
Symbol/Exchange
Company Name
Industry Group |
PRICE |
CHANGE
(%Change) |
Day High |
Volume
(% DAV)
(% 50 day avg vol) |
52 Wk Hi
% From Hi |
Featured
Date |
Price
Featured |
Pivot Featured |
|
Max Buy |
OLLI
-
NASDAQ
Ollie's Bargain Outlet
Retail-DiscountandVariety
|
$62.50
|
+0.30
0.48% |
$62.65
|
331,111
49.42% of 50 DAV
50 DAV is 670,000
|
$64.45
-3.03%
|
4/10/2018
|
$62.05
|
PP = $62.15
|
|
MB = $65.26
|
Most Recent Note - 4/30/2018 6:11:56 PM
Y - Still quietly hovering near its all-time high with volume totals cooling. Confirming gains above the pivot point backed by at least +40% above average volume are needed to trigger a proper technical buy signal.
>>> FEATURED STOCK ARTICLE : Encountered Distribution, Finished Below Pivot Point After Early Gain - 4/11/2018 |
View all notes |
Set NEW NOTE alert |
Company Profile |
SEC
News |
Chart |
Request a new note
C
A
S
I |
NOVT
-
NASDAQ
Novanta Inc
Elec-Scientific/Msrng
|
$58.70
|
-0.10
-0.17% |
$58.85
|
276,064
125.48% of 50 DAV
50 DAV is 220,000
|
$63.60
-7.70%
|
4/17/2018
|
$60.55
|
PP = $60.40
|
|
MB = $63.42
|
Most Recent Note - 4/25/2018 1:51:07 PM
Y - Pulling back today for a 3rd consecutive small loss on light or near average volume. Stalled after recently rallying to new highs with an impressive streak of volume-driven gains. Prior highs in the $58-60 area define initial support to watch above its 50 DMA line.
>>> FEATURED STOCK ARTICLE : Volume-Driven Gain Hit New All-Time High - 4/17/2018 |
View all notes |
Set NEW NOTE alert |
Company Profile |
SEC
News |
Chart |
Request a new note
C
A
S
I |
SEND
-
NYSE
Sendgrid Inc
INTERNET - Content
|
$28.75
|
-0.11
-0.38% |
$29.39
|
191,464
49.73% of 50 DAV
50 DAV is 385,000
|
$32.03
-10.23%
|
3/6/2018
|
$28.00
|
PP = $28.37
|
|
MB = $29.79
|
Most Recent Note - 5/1/2018 5:53:58 PM
G - Reported earnings +100% on +31% sales revenues for the Mar '18 quarter continuing its strong earnings track record. It has been quietly consolidating above its 50 DMA line ($27.94). Showing resilience after it priced a new Public Offering and Secondary Offering on 4/05/18. See the latest FSU analysis for more details and a new annotated graph.
>>> FEATURED STOCK ARTICLE : Earnings News Continues to be Strong - 5/1/2018 |
View all notes |
Set NEW NOTE alert |
Company Profile |
SEC
News |
Chart |
Request a new note
C
A
S
I |
|
|
|
THESE ARE NOT BUY RECOMMENDATIONS!
Comments contained in the body of this report are technical
opinions only. The material herein has been obtained
from sources believed to be reliable and accurate, however,
its accuracy and completeness cannot be guaranteed.
This site is not an investment advisor, hence it does
not endorse or recommend any securities or other investments.
Any recommendation contained in this report may not
be suitable for all investors and it is not to be deemed
an offer or solicitation on our part with respect to
the purchase or sale of any securities. All trademarks,
service marks and trade names appearing in this report
are the property of their respective owners, and are
likewise used for identification purposes only.
This report is a service available
only to active Paid Premium Members.
You may opt-out of receiving report notifications
at any time. Questions or comments may be submitted
by writing to Premium Membership Services 665 S.E. 10 Street, Suite 201 Deerfield Beach, FL 33441-5634 or by calling 1-800-965-8307
or 954-785-1121.
|
|
|