You are not logged in.
This means you
CAN ONLY VIEW reports that were published prior to Wednesday, March 19, 2025.
You
MUST UPGRADE YOUR MEMBERSHIP if you want to see any current reports.
AFTER MARKET UPDATE - TUESDAY, DECEMBER 5TH, 2017
Previous After Market Report Next After Market Report >>>
|
|
|
|
DOW |
-109.41 |
24,180.64 |
-0.45% |
|
Volume |
886,531,120 |
-10% |
|
Volume |
2,073,261,130 |
-15% |
|
NASDAQ |
-13.16 |
6,762.21 |
-0.19% |
|
Advancers |
1,053 |
36% |
|
Advancers |
727 |
31% |
|
S&P 500 |
-9.87 |
2,629.57 |
-0.37% |
|
Decliners |
1,878 |
64% |
|
Decliners |
1,653 |
69% |
|
Russell 2000 |
-15.66 |
1,516.76 |
-1.02% |
|
52 Wk Highs |
80 |
|
|
52 Wk Highs |
73 |
|
|
S&P 600 |
-9.93 |
928.08 |
-1.06% |
|
52 Wk Lows |
39 |
|
|
52 Wk Lows |
59 |
|
|
 |
Leadership Waned and Major Indices Fell
Kenneth J. Gruneisen - Passed the CAN SLIM® Master's Exam
Stocks closed lower Tuesday. The Dow lost 109 points to 24180. The S&P 500 was down 9 points to 2629 and the Nasdaq Composite declined 13 points to 6762. Volume totals reported were lighter than the prior session totals on the NYSE and on the Nasdaq exchange. Breadth was negative as decliners led advancers by a 9-5 margin on the NYSE and by more than a 2-1 margin on the Nasdaq exchange. There were 31 high-ranked companies from the Leaders List that made new 52-week highs and were listed on the BreakOuts Page, down from the total of 106 on the prior session. New 52-week highs totals contracted yet still outnumbered new 52-week lows on both the NYSE and the Nasdaq exchange. The Featured Stocks Page provides the latest analysis on noteworthy high-ranked leaders. Charts used courtesy of www.stockcharts.com
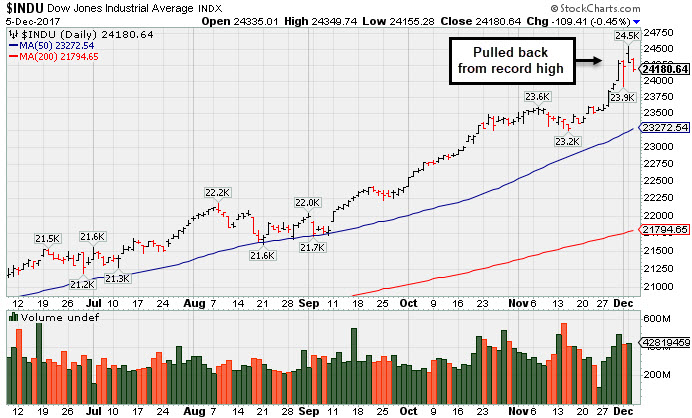 PICTURED: The Dow Jones Industrial Average pulled back from its record high with a loss on Tuesday.
The major averages (M criteria) are in a confirmed uptrend. Investors should only consider stocks meeting all key criteria of the fact-based investment system as they trigger technical buy signals.
The major averages finished lower as investors awaited further clarity on tax reform. GOP lawmakers announced on Tuesday that they anticipate both chambers of Congress will start the process of reconciling their tax measures this week. On the economic front, a report today showed the trade deficit widened to $48.7 billion in October from a revised $44.9 billion in September. A release from The Institute for Supply Management revealed the pace of activity in the service sector eased more than anticipated to a reading of 57.4 in November, but remains firmly in expansionary territory.
Ten of 11 S&P 500 sectors closed lower. Technology shares rebounded from their recent selloff, as Microsoft (MSFT +0.63%) and eBay(EBAY +3.14%) rose. Financials underperformed today, as JP Morgan Chase & Co (JPM -1.15%) fell. In earnings news, Homebuilder Toll Brothers (TOL -7.36%) fell after posting results below analyst estimates. In other news, McDonald’s (MCD +1.37%) rose on positive analyst commentary.
Treasuries finished higher with the yield on the 10-year note down three basis points to 2.35%. In commodities, NYMEX WTI crude added 0.3% to $57.62/barrel. COMEX gold fell 0.7% to $1268.40/ounce amid a stronger dollar. |
 Kenneth J. Gruneisen started out as a licensed stockbroker in August 1987, a couple of months prior to the historic stock market crash that took the Dow Jones Industrial Average down -22.6% in a single day. He has published daily fact-based fundamental and technical analysis on high-ranked stocks online for two decades. Through FACTBASEDINVESTING.COM, Kenneth provides educational articles, news, market commentary, and other information regarding proven investment systems that work in good times and bad.
Comments contained in the body of this report are technical opinions only and are not necessarily those of Gruneisen Growth Corp. The material herein has been obtained from sources believed to be reliable and accurate, however, its accuracy and completeness cannot be guaranteed. Our firm, employees, and customers may effect transactions, including transactions contrary to any recommendation herein, or have positions in the securities mentioned herein or options with respect thereto. Any recommendation contained in this report may not be suitable for all investors and it is not to be deemed an offer or solicitation on our part with respect to the purchase or sale of any securities. |
|
 |
Commodity-Linked Groups, Financials, and Tech Sector Fell
Kenneth J. Gruneisen - Passed the CAN SLIM® Master's Exam
The Bank Index ($BKX -0.90%) and the Broker/Dealer Index ($XBD -1.17%) both fell while the Retail Index ($RLX +0.15%) eked out a tiny gain on Tuesday. The Semiconductor Index ($SOX +0.05%) held its ground while the Biotechnology Index ($BTK -0.66%) and the Networking Index ($NWX -0.52%) both fell modestly. The Gold & Silver Index ($XAU -1.55%) and the Oil Services Index ($OSX -1.31%) both ended solidly lower while the Integrated Oil Index ($XOI +0.12%) held its ground. Charts courtesy www.stockcharts.com
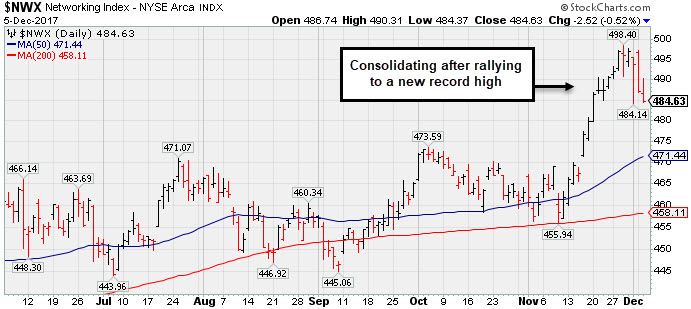 PICTURED: The Networking Index ($NWX -0.52%) is consolidating after rallying to a new record high.
| Oil Services |
$OSX |
135.85 |
-1.81 |
-1.31% |
-26.08% |
| Integrated Oil |
$XOI |
1,273.74 |
+1.57 |
+0.12% |
+0.45% |
| Semiconductor |
$SOX |
1,228.51 |
+0.66 |
+0.05% |
+35.53% |
| Networking |
$NWX |
484.63 |
-2.52 |
-0.52% |
+8.64% |
| Broker/Dealer |
$XBD |
260.52 |
-3.09 |
-1.17% |
+26.91% |
| Retail |
$RLX |
1,683.00 |
+2.49 |
+0.15% |
+25.32% |
| Gold & Silver |
$XAU |
77.51 |
-1.22 |
-1.55% |
-1.71% |
| Bank |
$BKX |
105.88 |
-0.96 |
-0.90% |
+15.35% |
| Biotech |
$BTK |
4,143.89 |
-27.51 |
-0.66% |
+34.76% |
|
|
|
 |
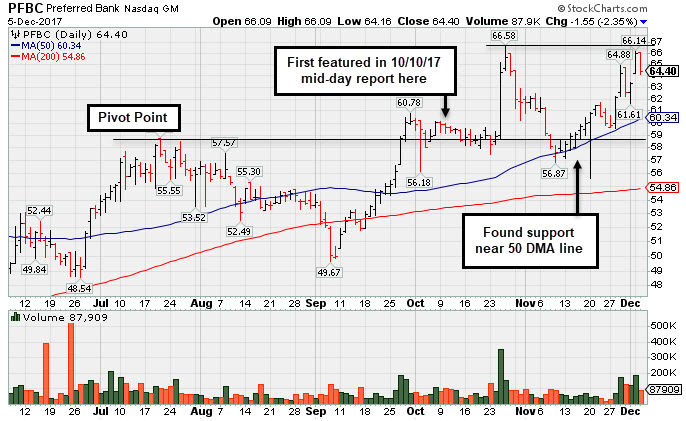
Challenged High After Finding Support at 50 Day Moving Average
Kenneth J. Gruneisen - Passed the CAN SLIM® Master's Exam
Preferred Bank Los Angeles (PFBC -$1.55 or -2.35% to $64.40) pulled back today. It challenged its prior high with a gap up gain on the prior session. It found prompt support at its 50-day moving average (DMA) line ($60.37) during its recent consolidation.
Its Relative Strength rank is currently 88, above the 80+ minimum guideline for buy candidates. Recently it reported earnings +36% on +33% sales revenues for the Sep '17 quarter, its 4th consecutive quarterly comparison above the +25% minimum guideline (C criteria). Its annual earnings (A criteria) history has been strong after a downturn in FY '12.
PFBC was first highlighted in yellow with pivot point cited based on its 7/20/17 high plus 10 cents in the 10/10/17 mid-day report (read here). It hit new 52-week highs with considerable volume-driven gains on 9/27 and 9/28. It was last shown in this FSU section on 11/08/17 with an annotated graph under the headline "Slump Back Into Prior Base Raised Concerns".
It currently has a Timeliness rating of A and a Sponsorship rating of B. The number of top-rated funds owning its shares rose from 262 in Dec '16 to 301 in Sep '17, a reassuring sign concerning the I criteria. Its current Up/Down Volume Ratio of 1.7 is an unbiased indication its shares have been under accumulation over the past 50 days.
|
|
|
Color Codes Explained :
Y - Better candidates highlighted by our
staff of experts.
G - Previously featured
in past reports as yellow but may no longer be buyable under the
guidelines.
***Last / Change / Volume data in this table is the closing quote data***
Symbol/Exchange
Company Name
Industry Group |
PRICE |
CHANGE
(%Change) |
Day High |
Volume
(% DAV)
(% 50 day avg vol) |
52 Wk Hi
% From Hi |
Featured
Date |
Price
Featured |
Pivot Featured |
|
Max Buy |
THO
-
NYSE
Thor Industries Inc
AUTOMOTIVE - Recreational Vehicles
|
$149.96
|
+1.29
0.87% |
$151.23
|
763,648
97.78% of 50 DAV
50 DAV is 781,000
|
$156.86
-4.40%
|
8/14/2017
|
$106.67
|
PP = $110.01
|
|
MB = $115.51
|
Most Recent Note - 12/4/2017 5:57:23 PM
G - Pulled back for a 3rd consecutive loss on average volume, retreating from its all-time high. It is extended from its prior base. Its 50 DMA line ($132.75) and recent low ($127.29 on 11/08/17) define near-term support to watch. Reported earnings +63% on +31% sales revenues for the Oct '17 quarter, continuing its strong earnings track record.
>>> FEATURED STOCK ARTICLE : Encountered Distributional Pressure After Getting Extended From Base - 11/10/2017 |
View all notes |
Set NEW NOTE alert |
Company Profile |
SEC
News |
Chart |
Request a new note
C
A
S
I |
PFBC
-
NASDAQ
Preferred Bank Los Angls
BANKING - Regional - Pacific Banks
|
$64.40
|
-1.55
-2.35% |
$66.09
|
87,909
107.21% of 50 DAV
50 DAV is 82,000
|
$66.58
-3.27%
|
10/10/2017
|
$59.38
|
PP = $59.08
|
|
MB = $62.03
|
 Most Recent Note - 12/5/2017 5:18:09 PM
G - Pulled back today after challenging its prior high with a gap up and volume-driven gain. Found prompt support at its 50 DMA line ($60.37) during its recent consolidation. See the latest FSU analysis for more details and a new annotated graph.
>>> FEATURED STOCK ARTICLE : Challenged High After Finding Support at 50 Day Moving Average - 12/5/2017 |
View all notes |
Set NEW NOTE alert |
Company Profile |
SEC
News |
Chart |
Request a new note
C
A
S
I |
AVGO
-
NASDAQ
Broadcom Limited
ELECTRONICS - Semiconductor - Broad Line
|
$261.65
|
-1.96
-0.74% |
$266.12
|
3,779,161
123.74% of 50 DAV
50 DAV is 3,054,000
|
$285.68
-8.41%
|
10/30/2017
|
$261.19
|
PP = $259.46
|
|
MB = $272.43
|
Most Recent Note - 12/4/2017 5:46:12 PM
G - Fell with above average volume for a 3rd time in the span of 4 sessions. Prior highs in the $259 area and its 50 DMA line ($257.38) define near-term support to watch. Due to report earnings on Wednesday, December 6, 2017 after the close of the market. Volume and volatility often increase near earnings news. Recently made bids to acquire Qualcomm Inc (QCOM).
>>> FEATURED STOCK ARTICLE : Consolidating Near Record High Following Volume-Driven Gains - 11/13/2017 |
View all notes |
Set NEW NOTE alert |
Company Profile |
SEC
News |
Chart |
Request a new note
C
A
S
I |
YY
-
NASDAQ
YY Inc Ads
INTERNET - Internet Service Providers
|
$100.68
|
-0.44
-0.44% |
$102.20
|
1,236,924
75.10% of 50 DAV
50 DAV is 1,647,000
|
$123.48
-18.46%
|
9/25/2017
|
$80.26
|
PP = $83.10
|
|
MB = $87.26
|
Most Recent Note - 12/5/2017 5:27:17 PM
G - Consolidating above its prior high ($97.59 on 10/16/17) which defines near-term support along with its 50 DMA line ($95.66). Abruptly retreated from its all-time high after getting very extended from any sound base. Fundamentals remain strong.
>>> FEATURED STOCK ARTICLE : Chinese Social Media Firm Reported Earnings - 11/14/2017 |
View all notes |
Set NEW NOTE alert |
Company Profile |
SEC
News |
Chart |
Request a new note
C
A
S
I |
HTHT
-
NASDAQ
China Lodging Group Ads
LEISURE - Lodging
|
$110.72
|
+0.80
0.73% |
$111.80
|
439,445
86.68% of 50 DAV
50 DAV is 507,000
|
$142.80
-22.46%
|
9/29/2016
|
$46.12
|
PP = $47.82
|
|
MB = $50.21
|
Most Recent Note - 12/5/2017 5:25:26 PM
G - Holding its ground for the past 4 sessions after damaging volume-driven losses triggered technical sell signals. A rebound above its 50 DMA line ($124.88) is needed for its outlook to improve. Fundamentals remain strong.
>>> FEATURED STOCK ARTICLE : Weak Technical Action Raises Concerns Despite Strong Fundamentals - 11/29/2017 |
View all notes |
Set NEW NOTE alert |
Company Profile |
SEC
News |
Chart |
Request a new note
C
A
S
I |
Symbol/Exchange
Company Name
Industry Group |
PRICE |
CHANGE
(%Change) |
Day High |
Volume
(% DAV)
(% 50 day avg vol) |
52 Wk Hi
% From Hi |
Featured
Date |
Price
Featured |
Pivot Featured |
|
Max Buy |
PATK
-
NASDAQ
Patrick Industries Inc
Bldg-Mobile/Mfg and RV
|
$97.60
|
-0.40
-0.41% |
$98.20
|
108,722
127.91% of 50 DAV
50 DAV is 85,000
|
$102.95
-5.20%
|
10/26/2017
|
$90.90
|
PP = $87.90
|
|
MB = $92.30
|
Most Recent Note - 12/5/2017 11:23:22 AM
G - Perched near its all-time high, extended from its prior base. Its 50 DMA line ($89.03) defines important near-term support to watch. Fundamentals remain strong.
>>> FEATURED STOCK ARTICLE : Best Ever Close After Pullback Found Support Near Prior High - 11/21/2017 |
View all notes |
Set NEW NOTE alert |
Company Profile |
SEC
News |
Chart |
Request a new note
C
A
S
I |
ESNT
-
NYSE
Essent Group Ltd
Finance-MrtgandRel Svc
|
$45.54
|
+0.02
0.04% |
$46.14
|
805,546
86.25% of 50 DAV
50 DAV is 934,000
|
$46.15
-1.32%
|
10/9/2017
|
$39.75
|
PP = $41.54
|
|
MB = $43.62
|
Most Recent Note - 12/4/2017 5:47:39 PM
G - Gapped up and quietly hit a new high today. Its 50 DMA line ($42.55) and recent low ($39.79 on 11/03/17) define important near-term support to watch on pullbacks. Fundamentals remain strong.
>>> FEATURED STOCK ARTICLE : Recent Consolidation Was Not a Sufficient Length New Base - 11/20/2017 |
View all notes |
Set NEW NOTE alert |
Company Profile |
SEC
News |
Chart |
Request a new note
C
A
S
I |
FIVE
-
NASDAQ
Five Below Inc
Retail-DiscountandVariety
|
$64.14
|
-0.86
-1.32% |
$65.49
|
1,301,386
138.74% of 50 DAV
50 DAV is 938,000
|
$65.48
-2.05%
|
10/6/2017
|
$57.13
|
PP = $54.23
|
|
MB = $56.94
|
Most Recent Note - 12/4/2017 5:49:00 PM
G - Hit another new all-time high today with additional volume-driven gains. It is extended from its prior base, and its 50 DMA line ($57.12) defines near-term support to watch. Reported earnings +80% on +29% sales revenues for the Oct '17 quarter, continuing its strong earnings track record.
>>> FEATURED STOCK ARTICLE : Getting Extended From Prior Base With Earnings News Due - 11/24/2017 |
View all notes |
Set NEW NOTE alert |
Company Profile |
SEC
News |
Chart |
Request a new note
C
A
S
I |
OLED
-
NASDAQ
Universal Display Corp
Elec-Misc Products
|
$166.00
|
-1.55
-0.93% |
$170.15
|
1,338,424
147.40% of 50 DAV
50 DAV is 908,000
|
$192.75
-13.88%
|
8/31/2017
|
$128.22
|
PP = $127.78
|
|
MB = $134.17
|
Most Recent Note - 12/5/2017 5:20:31 PM
G - Streak of losses marked by above average volume has been noted as indicative of distributional pressure. Still very extended from any sound base pattern. Its 50 DMA line ($152.27) and prior high in the $145 area define important near-term support to watch on pullbacks.
>>> FEATURED STOCK ARTICLE : Electronic Products Firm Perched at Record High - 11/17/2017 |
View all notes |
Set NEW NOTE alert |
Company Profile |
SEC
News |
Chart |
Request a new note
C
A
S
I |
ANET
-
NYSE
Arista Networks Inc
TELECOMMUNICATIONS - Communication Equipment
|
$211.05
|
+1.57
0.75% |
$218.64
|
1,263,410
157.53% of 50 DAV
50 DAV is 802,000
|
$245.65
-14.09%
|
10/27/2017
|
$195.65
|
PP = $196.37
|
|
MB = $206.19
|
Most Recent Note - 12/5/2017 11:50:29 AM
G - Pulled back from its high with 4 consecutive losses marked by volume after getting very extended from the previously noted base. Its 50 DMA line ($206.52) and prior highs in the $196 area define near-term support to watch where violations may trigger technical sell signals.
>>> FEATURED STOCK ARTICLE : Perched at Record High Following Volume-Driven Gains - 11/9/2017 |
View all notes |
Set NEW NOTE alert |
Company Profile |
SEC
News |
Chart |
Request a new note
C
A
S
I |
Symbol/Exchange
Company Name
Industry Group |
PRICE |
CHANGE
(%Change) |
Day High |
Volume
(% DAV)
(% 50 day avg vol) |
52 Wk Hi
% From Hi |
Featured
Date |
Price
Featured |
Pivot Featured |
|
Max Buy |
GRUB
-
NYSE
Grubhub Inc
COMPUTER SOFTWARE and SERVICES - Technical and System Software
|
$67.58
|
+0.64
0.96% |
$67.76
|
860,924
57.97% of 50 DAV
50 DAV is 1,485,000
|
$69.82
-3.21%
|
6/21/2017
|
$47.33
|
PP = $46.94
|
|
MB = $49.29
|
Most Recent Note - 12/5/2017 11:21:47 AM
G - Still very extended from any sound base after wedging higher with gains lacking great volume conviction. Its 50 DMA line ($58.91) and prior highs near $57 define support to watch on pullbacks. Reported Sep '17 quarterly earnings +22% on +32% sales revenues. The 2 latest quarters were below the +25% minimum earnings guideline (C criteria), raising fundamental concerns with regard to the fact-based investment system.
>>> FEATURED STOCK ARTICLE : Extended From Prior Highs After Gains on Light Volume - 11/22/2017 |
View all notes |
Set NEW NOTE alert |
Company Profile |
SEC
News |
Chart |
Request a new note
C
A
S
I |
IBP
-
NYSE
Installed Building Prod
DIVERSIFIED SERVICES - Business/Management Services
|
$74.35
|
-2.20
-2.87% |
$77.05
|
229,740
119.66% of 50 DAV
50 DAV is 192,000
|
$79.40
-6.36%
|
9/19/2017
|
$59.15
|
PP = $60.10
|
|
MB = $63.11
|
Most Recent Note - 12/1/2017 7:04:44 PM
G - Perched near its all-time high, extended from any sound base. The 50 DMA line ($66.79 and recent low ($59.84 on 11/08/17) define important near-term support to watch on pullbacks. See the latest FSU analysis for more details and a new annotated graph.
>>> FEATURED STOCK ARTICLE : Extended From Any Sound Base After Impressive Rebound and Rally - 12/1/2017 |
View all notes |
Set NEW NOTE alert |
Company Profile |
SEC
News |
Chart |
Request a new note
C
A
S
I |
HQY
-
NASDAQ
"HealthEquity, Inc"
COMPUTER SOFTWARE and SERVICES - Healthcare Information Service
|
$48.49
|
-0.37
-0.76% |
$49.51
|
512,058
127.85% of 50 DAV
50 DAV is 400,500
|
$55.31
-12.33%
|
11/6/2017
|
$54.63
|
PP = $52.87
|
|
MB = $55.51
|
Most Recent Note - 12/4/2017 5:41:41 PM
G - Fell below its 50 DMA line ($50.47) with a loss today on higher volume raising concerns and its color code is changed to green. Disciplined investors always limit losses by selling any stock that falls more than -7% from their purchase price. See the latest FSU analysis for more details and a new annotated graph.
>>> FEATURED STOCK ARTICLE : Sank Below 50-Day Moving Average With Loss on Higher Volume - 12/4/2017 |
View all notes |
Set NEW NOTE alert |
Company Profile |
SEC
News |
Chart |
Request a new note
C
A
S
I |
OLLI
-
NASDAQ
Ollie's Bargain Outlet
Retail-DiscountandVariety
|
$50.70
|
+1.10
2.22% |
$51.40
|
764,840
168.47% of 50 DAV
50 DAV is 454,000
|
$49.75
1.91%
|
11/21/2017
|
$46.78
|
PP = $47.00
|
|
MB = $49.35
|
Most Recent Note - 12/5/2017 5:22:53 PM
G - Hit yet another new high with above average volume behind today's 7th consecutive gain. Color code is changed to green after rallying above its "max buy" level. Its 50 DMA line ($45.64) and prior lows in the $42 area define important near-term support.
>>> FEATURED STOCK ARTICLE : Recently Stalled After Reaching a New High - 11/27/2017 |
View all notes |
Set NEW NOTE alert |
Company Profile |
SEC
News |
Chart |
Request a new note
C
A
S
I |
HLI
-
NYSE
Houlihan Lokey Inc Cl A
Finance-Invest Bnk/Bkrs
|
$44.20
|
-0.64
-1.43% |
$45.14
|
125,102
50.65% of 50 DAV
50 DAV is 247,000
|
$45.12
-2.04%
|
9/18/2017
|
$37.04
|
PP = $39.78
|
|
MB = $41.77
|
Most Recent Note - 12/4/2017 5:50:06 PM
G - Posted a quiet gain today for a best-ever close. Perched at its all-time high, extended from any sound base. Its 50 DMA line and prior lows define near-term support in the $41 area. On 10/26/17 it priced a Secondary Offering. Fundamentals remain strong.
>>> FEATURED STOCK ARTICLE : Holding Ground Near Record High - 11/16/2017 |
View all notes |
Set NEW NOTE alert |
Company Profile |
SEC
News |
Chart |
Request a new note
C
A
S
I |
Symbol/Exchange
Company Name
Industry Group |
PRICE |
CHANGE
(%Change) |
Day High |
Volume
(% DAV)
(% 50 day avg vol) |
52 Wk Hi
% From Hi |
Featured
Date |
Price
Featured |
Pivot Featured |
|
Max Buy |
|
|
|
THESE ARE NOT BUY RECOMMENDATIONS!
Comments contained in the body of this report are technical
opinions only. The material herein has been obtained
from sources believed to be reliable and accurate, however,
its accuracy and completeness cannot be guaranteed.
This site is not an investment advisor, hence it does
not endorse or recommend any securities or other investments.
Any recommendation contained in this report may not
be suitable for all investors and it is not to be deemed
an offer or solicitation on our part with respect to
the purchase or sale of any securities. All trademarks,
service marks and trade names appearing in this report
are the property of their respective owners, and are
likewise used for identification purposes only.
This report is a service available
only to active Paid Premium Members.
You may opt-out of receiving report notifications
at any time. Questions or comments may be submitted
by writing to Premium Membership Services 665 S.E. 10 Street, Suite 201 Deerfield Beach, FL 33441-5634 or by calling 1-800-965-8307
or 954-785-1121.
|
|
|