***Last / Change / Volume data in this table is the closing quote data***
Symbol/Exchange
Company Name
Industry Group |
PRICE |
CHANGE
(%Change) |
Day High |
Volume
(% DAV)
(% 50 day avg vol) |
52 Wk Hi
% From Hi |
Featured
Date |
Price
Featured |
Pivot Featured |
|
Max Buy |
PFBC
-
NASDAQ
Preferred Bank Los Angls
BANKING - Regional - Pacific Banks
|
$66.49
|
-0.41
-0.61% |
$67.14
|
74,543
89.81% of 50 DAV
50 DAV is 83,000
|
$67.65
-1.71%
|
4/10/2018
|
$64.56
|
PP = $67.75
|
|
MB = $71.14
|
 Most Recent Note - 4/25/2018 6:07:41 PM
Y - Perched within close striking distance of its 52-week high and previously cited pivot point. Subsequent volume-driven gains for new highs may trigger a technical buy signal. Consolidating above its 50 DMA line ($64.75) after holding its ground stubbornly in recent weeks.
>>> FEATURED STOCK ARTICLE : Bank Stock Hovering Within Striking Distance of Prior High - 4/10/2018 |
View all notes |
Set NEW NOTE alert |
Company Profile |
SEC
News |
Chart |
Request a new note
C
A
S
I |
SIVB
-
NASDAQ
S V B Financial Group
BANKING - Regional - Pacific Banks
|
$257.58
|
-0.03
-0.01% |
$259.84
|
471,602
64.96% of 50 DAV
50 DAV is 726,000
|
$271.79
-5.23%
|
3/12/2018
|
$267.79
|
PP = $263.19
|
|
MB = $276.35
|
Most Recent Note - 4/25/2018 6:03:19 PM
Y - Due to report its financial results for the quarter ended March 31, 2018, on Thursday, April 26, 2018 after the close. Volume and volatility often increase near earnings news. Consolidating above its 50 DMA line ($250.71). Found support when recently sputtering near the prior low ($226.61 on 2/06/18). More damaging losses would raise greater concerns and trigger a worrisome technical sell signal.
>>> FEATURED STOCK ARTICLE : Rebounded Above its 50-Day Moving Average - 4/12/2018 |
View all notes |
Set NEW NOTE alert |
Company Profile |
SEC
News |
Chart |
Request a new note
C
A
S
I |
TPL
-
NYSE
Texas Pacific Land Trust
FINANCIAL SERVICES - Diversified Investments
|
$541.91
|
+6.47
1.21% |
$548.01
|
13,922
107.09% of 50 DAV
50 DAV is 13,000
|
$569.99
-4.93%
|
4/13/2018
|
$547.85
|
PP = $552.10
|
|
MB = $579.71
|
Most Recent Note - 4/24/2018 1:09:19 PM
Y - Encountered distributional pressure on the prior session after challenging its all-time high. Recent gains lacked great volume conviction as it wedged up above the new pivot point cited based on its 2/28/18 high plus 10 cents. Gains above a stock's pivot point must have more than +40% above average volume to trigger a proper new (or add-on) technical buy signal. Very little resistance remains due to overhead supply up to the $569 level. The 50 DMA line defines near-term support to watch above the recent lows ($480).
>>> FEATURED STOCK ARTICLE : Perched Near Prior High After Showing Resilience - 4/20/2018 |
View all notes |
Set NEW NOTE alert |
Company Profile |
SEC
News |
Chart |
Request a new note
C
A
S
I |
LMAT
-
NASDAQ
Lemaitre Vascular Inc
Medical-Products
|
$39.01
|
+0.21
0.54% |
$39.06
|
151,957
112.56% of 50 DAV
50 DAV is 135,000
|
$41.28
-5.50%
|
3/19/2018
|
$36.77
|
PP = $39.98
|
|
MB = $41.98
|
Most Recent Note - 4/23/2018 6:28:48 PM
Y - Perched near its all-time high. Held its ground stubbornly since it triggered a technical buy signal on 4/11/18 . Found support recently near its 50 DMA line ($36.91).
>>> FEATURED STOCK ARTICLE : Gain With Heavy Volume Triggered Technical Buy Signal - 4/13/2018 |
View all notes |
Set NEW NOTE alert |
Company Profile |
SEC
News |
Chart |
Request a new note
C
A
S
I |
DPZ
-
NYSE
Dominos Pizza Inc
WHOLESALE - Food Wholesale
|
$233.53
|
+1.71
0.74% |
$235.21
|
842,664
94.58% of 50 DAV
50 DAV is 891,000
|
$243.81
-4.21%
|
2/20/2018
|
$224.86
|
PP = $222.01
|
|
MB = $233.11
|
Most Recent Note - 4/23/2018 6:23:38 PM
G - Earnings news is due on Thursday. Recently wedged above its "max buy" level with gains lacking great volume conviction. Its 50 DMA line and recent lows define near-term support to watch. See the latest FSU analysis for more details and a new annotated graph.
>>> FEATURED STOCK ARTICLE : Earnings News Due From Pizza Firm - 4/23/2018 |
View all notes |
Set NEW NOTE alert |
Company Profile |
SEC
News |
Chart |
Request a new note
C
A
S
I |
Symbol/Exchange
Company Name
Industry Group |
PRICE |
CHANGE
(%Change) |
Day High |
Volume
(% DAV)
(% 50 day avg vol) |
52 Wk Hi
% From Hi |
Featured
Date |
Price
Featured |
Pivot Featured |
|
Max Buy |
FIVE
-
NASDAQ
Five Below Inc
Retail-DiscountandVariety
|
$72.65
|
+0.01
0.01% |
$73.34
|
832,168
57.31% of 50 DAV
50 DAV is 1,452,000
|
$78.28
-7.19%
|
3/9/2018
|
$68.58
|
PP = $73.65
|
|
MB = $77.33
|
Most Recent Note - 4/24/2018 5:59:02 PM
Y - Fell for a 5th consecutive small loss on lighter volume since the noted "negative reversal" on 4/18/18 after hitting a new all-time high. Slumped near prior highs in the $73 area defining initial support above its 50 DMA line ($70.06). More damaging losses may raise concerns and trigger technical sell signals.
>>> FEATURED STOCK ARTICLE : Quietly Hovering Near All-Time High - 4/5/2018 |
View all notes |
Set NEW NOTE alert |
Company Profile |
SEC
News |
Chart |
Request a new note
C
A
S
I |
NVEE
-
NASDAQ
N V 5 Global Inc
Comml Svcs-Consulting
|
$61.50
|
+0.35
0.57% |
$62.45
|
77,831
96.09% of 50 DAV
50 DAV is 81,000
|
$64.50
-4.65%
|
4/9/2018
|
$58.35
|
PP = $59.05
|
|
MB = $62.00
|
Most Recent Note - 4/23/2018 6:31:05 PM
G - Consolidating just above its "max buy" level. Prior highs in the $58 area define initial support to watch on pullbacks. Hit a new all-time high with +95% above average volume behind its considerable 4/12/18 gain above the pivot point triggering a technical buy signal.
>>> FEATURED STOCK ARTICLE : Perched Near High After 3 Strong Quarterly Comparisons - 4/9/2018 |
View all notes |
Set NEW NOTE alert |
Company Profile |
SEC
News |
Chart |
Request a new note
C
A
S
I |
QLYS
-
NASDAQ
Qualys Inc
Computer Sftwr-Security
|
$77.20
|
-1.80
-2.28% |
$80.45
|
477,954
135.78% of 50 DAV
50 DAV is 352,000
|
$85.00
-9.18%
|
4/17/2018
|
$82.85
|
PP = $79.50
|
|
MB = $83.48
|
Most Recent Note - 4/25/2018 1:56:50 PM
Y - Color code is changed to yellow although now pulling back undercutting the prior high in the $79 area raising some concern. Today's 5th consecutive loss is testing its 50 DMA line ($75.80). Deterioration below the 50 DMA would raise concerns, and a violation of the prior low ($70.85 on 3/28/18) would trigger a more worrisome technical sell signal.
>>> FEATURED STOCK ARTICLE : Quickly Rallied More Than 5% Above Prior High - 4/18/2018 |
View all notes |
Set NEW NOTE alert |
Company Profile |
SEC
News |
Chart |
Request a new note
C
A
S
I |
SPLK
-
NASDAQ
Splunk Inc
Computer Sftwr-Database
|
$97.64
|
-2.72
-2.71% |
$101.22
|
2,410,864
118.94% of 50 DAV
50 DAV is 2,027,000
|
$112.66
-13.33%
|
2/15/2018
|
$96.06
|
PP = $93.68
|
|
MB = $98.36
|
Most Recent Note - 4/25/2018 6:05:58 PM
G - Slumped below its 50 DMA line ($101.079) with a big loss today on +19% average volume doing more damage and triggering a technical sell signal. A subsequent loss on breach of the prior low ($94.39 on 4/04/18) would raise more serious concerns.
>>> FEATURED STOCK ARTICLE : Found Support Near 50-Day Average on Pullbacks - 4/19/2018 |
View all notes |
Set NEW NOTE alert |
Company Profile |
SEC
News |
Chart |
Request a new note
C
A
S
I |
SUPN
-
NASDAQ
Supernus Pharmaceuticals
Medical-Biomed/Biotech
|
$47.35
|
+0.60
1.28% |
$47.70
|
633,402
99.12% of 50 DAV
50 DAV is 639,000
|
$50.05
-5.39%
|
4/24/2018
|
$47.73
|
PP = $50.15
|
|
MB = $52.66
|
Most Recent Note - 4/24/2018 1:01:49 PM
Y - Color code is changed to yellow with pivot point cited based on its 9/18/17 high plus 10 cents. Hovering within close striking distance of its all-time high. Subsequent gains above the pivot point backed by at least +40% above average volume are needed to trigger a technical buy signal. Sales revenues increases were in the +30-47% range while three of the past 4 quarterly earnings comparisons through Dec '17 were above the +25% minimum guideline (C criteria). Showed strong earnings growth since FY '15 after years of losses.
>>> FEATURED STOCK ARTICLE : Pharmaceutical Firm Perched Near Record High - 4/24/2018 |
View all notes |
Set NEW NOTE alert |
Company Profile |
SEC
News |
Chart |
Request a new note
C
A
S
I |
Symbol/Exchange
Company Name
Industry Group |
PRICE |
CHANGE
(%Change) |
Day High |
Volume
(% DAV)
(% 50 day avg vol) |
52 Wk Hi
% From Hi |
Featured
Date |
Price
Featured |
Pivot Featured |
|
Max Buy |
PAYC
-
NYSE
Paycom Software Inc
COMPUTER SOFTWARE and SERVICES - Application Software
|
$110.78
|
+0.23
0.21% |
$110.91
|
616,686
88.35% of 50 DAV
50 DAV is 698,000
|
$118.45
-6.48%
|
2/15/2018
|
$95.01
|
PP = $93.61
|
|
MB = $98.29
|
Most Recent Note - 4/24/2018 5:43:48 PM
G - Pulled back from its all-time high with 4 consecutive losses on ever increasing volume. Its 50 DMA line ($106) and recent low ($101.55 on 4/04/18) define important near-term support to watch on pullbacks. Due to report earnings news on 5/01/18.
>>> FEATURED STOCK ARTICLE : Pulling Back After Negative Reversal at All-Time High Last Week - 4/4/2018 |
View all notes |
Set NEW NOTE alert |
Company Profile |
SEC
News |
Chart |
Request a new note
C
A
S
I |
GRUB
-
NYSE
Grubhub Inc
COMPUTER SOFTWARE and SERVICES - Technical and System Software
|
$95.57
|
-2.46
-2.51% |
$97.35
|
2,165,619
135.44% of 50 DAV
50 DAV is 1,599,000
|
$112.41
-14.98%
|
6/21/2017
|
$47.33
|
PP = $46.94
|
|
MB = $49.29
|
Most Recent Note - 4/25/2018 12:56:12 PM
G - Big loss on the prior session violated the 50 DMA line ($101.42) triggering a technical sell signal. Today's weakness tested the recent low ($94.08 on 4/04/18) where further deterioration would raise more serious concerns.
>>> FEATURED STOCK ARTICLE : Very Extended and Enduring Distributional Pressure - 3/29/2018 |
View all notes |
Set NEW NOTE alert |
Company Profile |
SEC
News |
Chart |
Request a new note
C
A
S
I |
HQY
-
NASDAQ
Healthequity Inc
COMPUTER SOFTWARE and SERVICES - Healthcare Information Service
|
$65.56
|
+0.45
0.69% |
$65.81
|
202,213
27.29% of 50 DAV
50 DAV is 741,000
|
$68.75
-4.64%
|
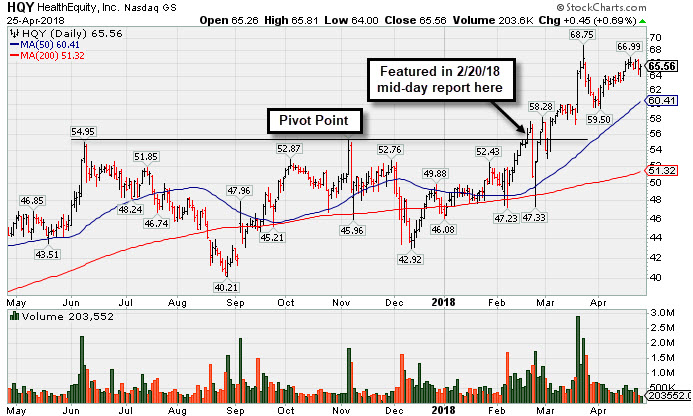
2/20/2018
|
$56.37
|
PP = $55.41
|
|
MB = $58.18
|
Most Recent Note - 4/25/2018 5:58:26 PM
G - Volume totals have been cooling while hovering near its all-time high, possibly forming a short new flat base. Its 50 DMA line ($60.41) defines near term support above prior highs. See the latest FSU analysis for more details and a new annotated graph.
>>> FEATURED STOCK ARTICLE : Perched Near All-Time High Building a Short New Base - 4/25/2018 |
View all notes |
Set NEW NOTE alert |
Company Profile |
SEC
News |
Chart |
Request a new note
C
A
S
I |
LOB
-
NASDAQ
Live Oak Bancshares Inc
Banks-Southeast
|
$28.55
|
-0.20
-0.70% |
$28.75
|
94,306
71.44% of 50 DAV
50 DAV is 132,000
|
$30.05
-4.99%
|
3/16/2018
|
$28.63
|
PP = $28.30
|
|
MB = $29.72
|
Most Recent Note - 4/23/2018 6:29:55 PM
Y - Earnings news is due on 4/25/18. Quietly consolidating above its pivot point after testing its 50 DMA line ($27.76). Subsequent damaging losses would raise greater concerns.
>>> FEATURED STOCK ARTICLE : Tested Support at 50-Day Moving Average After Breakout - 4/16/2018 |
View all notes |
Set NEW NOTE alert |
Company Profile |
SEC
News |
Chart |
Request a new note
C
A
S
I |
PYPL
-
NASDAQ
Paypal Holdings Inc
Finance-CrdtCard/PmtPr
|
$74.00
|
-1.28
-1.70% |
$75.58
|
10,732,989
132.54% of 50 DAV
50 DAV is 8,098,000
|
$86.32
-14.27%
|
2/1/2018
|
$80.35
|
PP = $79.49
|
|
MB = $83.46
|
Most Recent Note - 4/24/2018 6:07:47 PM
G - Slumped below its 50 DMA line ($78.20) with a big loss today raising concerns. Prior lows in the $71-72 area define important support. Due to report Mar '18 quarterly results on 4/25/18. Volume and volatility often increase near earnings news.
>>> FEATURED STOCK ARTICLE : Sputtering Below 50-Day Moving Average Again - 3/27/2018 |
View all notes |
Set NEW NOTE alert |
Company Profile |
SEC
News |
Chart |
Request a new note
C
A
S
I |
Symbol/Exchange
Company Name
Industry Group |
PRICE |
CHANGE
(%Change) |
Day High |
Volume
(% DAV)
(% 50 day avg vol) |
52 Wk Hi
% From Hi |
Featured
Date |
Price
Featured |
Pivot Featured |
|
Max Buy |
OLLI
-
NASDAQ
Ollie's Bargain Outlet
Retail-DiscountandVariety
|
$60.90
|
-0.85
-1.38% |
$61.95
|
468,606
70.89% of 50 DAV
50 DAV is 661,000
|
$64.45
-5.51%
|
4/10/2018
|
$62.05
|
PP = $62.15
|
|
MB = $65.26
|
Most Recent Note - 4/23/2018 6:32:14 PM
Y - Stalled since it encountered distributional pressure and finished unchanged on 4/11/18 after hitting a new all-time high. Confirming gains above the pivot point backed by at least +40% above average volume are needed to trigger a proper technical buy signal.
>>> FEATURED STOCK ARTICLE : Encountered Distribution, Finished Below Pivot Point After Early Gain - 4/11/2018 |
View all notes |
Set NEW NOTE alert |
Company Profile |
SEC
News |
Chart |
Request a new note
C
A
S
I |
WB
-
NASDAQ
Weibo Corp Cl A Ads
INTERNET - Content
|
$108.88
|
-5.25
-4.60% |
$113.73
|
2,374,901
124.80% of 50 DAV
50 DAV is 1,903,000
|
$142.12
-23.39%
|
1/16/2018
|
$126.33
|
PP = $122.21
|
|
MB = $128.32
|
Most Recent Note - 4/25/2018 1:45:55 PM
Testing prior lows in the $109 area and its 200 DMA line ($108.10) with losses this week. It will be dropped from the Featured Stocks list tonight. Subsequent gains above the 50 DMA line ($126.38) are needed for its outlook to improve.
>>> FEATURED STOCK ARTICLE : Quietly Slumping Near Prior Low - 4/6/2018 |
View all notes |
Set NEW NOTE alert |
Company Profile |
SEC
News |
Chart |
Request a new note
C
A
S
I |
NOVT
-
NASDAQ
Novanta Inc
Elec-Scientific/Msrng
|
$60.00
|
-1.30
-2.12% |
$61.20
|
426,721
193.96% of 50 DAV
50 DAV is 220,000
|
$63.60
-5.66%
|
4/17/2018
|
$60.55
|
PP = $60.40
|
|
MB = $63.42
|
Most Recent Note - 4/25/2018 1:51:07 PM
Y - Pulling back today for a 3rd consecutive small loss on light or near average volume. Stalled after recently rallying to new highs with an impressive streak of volume-driven gains. Prior highs in the $58-60 area define initial support to watch above its 50 DMA line.
>>> FEATURED STOCK ARTICLE : Volume-Driven Gain Hit New All-Time High - 4/17/2018 |
View all notes |
Set NEW NOTE alert |
Company Profile |
SEC
News |
Chart |
Request a new note
C
A
S
I |
SQ
-
NYSE
Square Inc Cl A
Finance-CrdtCard/PmtPr
|
$44.75
|
-1.26
-2.74% |
$46.90
|
15,957,649
114.81% of 50 DAV
50 DAV is 13,899,000
|
$58.46
-23.45%
|
3/5/2018
|
$49.70
|
PP = $49.66
|
|
MB = $52.14
|
Most Recent Note - 4/25/2018 2:12:37 PM
Today's loss undercut the prior low ($44.94 on 4/06/18) raising greater concerns. It will be dropped from the Featured Stocks list tonight. A big loss on the prior session with above average volume violated its 50 DMA line ($49.00) triggering a technical sell signal. A prompt rebound above the 50 DMA line is needed for its outlook to improve.
>>> FEATURED STOCK ARTICLE : Slumped Back Into Prior Base Testing 50-Day Average - 4/2/2018 |
View all notes |
Set NEW NOTE alert |
Company Profile |
SEC
News |
Chart |
Request a new note
C
A
S
I |
SEND
-
NYSE
Sendgrid Inc
INTERNET - Content
|
$27.96
|
-0.73
-2.54% |
$29.54
|
470,496
126.14% of 50 DAV
50 DAV is 373,000
|
$32.03
-12.70%
|
3/6/2018
|
$28.00
|
PP = $28.37
|
|
MB = $29.79
|
Most Recent Note - 4/25/2018 6:00:34 PM
G - Retreated near its 50 DMA line ($27.53) with a big loss today on near average volume. Due to report earnings news on 5/01/18 after the close. Showing resilience after it priced a new Public Offering and Secondary Offering on 4/05/18.
>>> FEATURED STOCK ARTICLE : Slumped Into Prior Base Testing 50-Day Average - 4/3/2018 |
View all notes |
Set NEW NOTE alert |
Company Profile |
SEC
News |
Chart |
Request a new note
C
A
S
I |
Symbol/Exchange
Company Name
Industry Group |
PRICE |
CHANGE
(%Change) |
Day High |
Volume
(% DAV)
(% 50 day avg vol) |
52 Wk Hi
% From Hi |
Featured
Date |
Price
Featured |
Pivot Featured |
|
Max Buy |