***Last / Change / Volume data in this table is the closing quote data***
Symbol/Exchange
Company Name
Industry Group |
PRICE |
CHANGE
(%Change) |
Day High |
Volume
(% DAV)
(% 50 day avg vol) |
52 Wk Hi
% From Hi |
Featured
Date |
Price
Featured |
Pivot Featured |
|
Max Buy |
PFBC
-
NASDAQ
Preferred Bank Los Angls
BANKING - Regional - Pacific Banks
|
$63.44
|
+0.18
0.28% |
$63.85
|
65,926
77.38% of 50 DAV
50 DAV is 85,200
|
$67.65
-6.22%
|
4/10/2018
|
$64.56
|
PP = $67.75
|
|
MB = $71.14
|
Most Recent Note - 5/8/2018 5:34:24 PM
G - Its Relative Strength rating has slumped below the 80+ minimum guideline to 73 while failing to rebound after slumping below its 50 DMA line and also briefly undercutting the prior low. A rebound above the 50 DMA line ($64.79) is needed for its outlook to improve.
>>> FEATURED STOCK ARTICLE : Bank Stock Hovering Within Striking Distance of Prior High - 4/10/2018 |
View all notes |
Set NEW NOTE alert |
Company Profile |
SEC
News |
Chart |
Request a new note
C
A
S
I |
SIVB
-
NASDAQ
S V B Financial Group
BANKING - Regional - Pacific Banks
|
$321.02
|
+0.74
0.23% |
$324.77
|
343,294
42.38% of 50 DAV
50 DAV is 810,000
|
$323.70
-0.83%
|
3/12/2018
|
$267.79
|
PP = $263.19
|
|
MB = $276.35
|
Most Recent Note - 5/8/2018 5:23:19 PM
G - Stubbornly holding its ground and quietly edging higher after a big "breakaway gap" for a new high on 4/27/18. Bullish action came after it reported financial results for the quarter ended March 31, 2018 and earnings rose +90% on +34% sales revenues versus the year ago period.
>>> FEATURED STOCK ARTICLE : Rebounded Above its 50-Day Moving Average - 4/12/2018 |
View all notes |
Set NEW NOTE alert |
Company Profile |
SEC
News |
Chart |
Request a new note
C
A
S
I |
EPAM
-
NYSE
Epam Systems Inc
COMPUTER SOFTWARE and SERVICES - Information Technology Service
|
$129.72
|
+1.63
1.27% |
$131.75
|
699,700
232.46% of 50 DAV
50 DAV is 301,000
|
$128.36
1.06%
|
5/9/2018
|
$120.34
|
PP = $125.98
|
|
MB = $132.28
|
 Most Recent Note - 5/11/2018 12:35:41 PM
Y - Hitting a new all-time high and challenging its "max buy" level with today's 3rd consecutive volume-driven gain. Gains above the pivot point this week triggered a technical buy signal. Prior highs define initial support to watch on pullbacks.
>>> FEATURED STOCK ARTICLE : Volume-Driven Gain Challenged Prior High Following Earnings - 5/9/2018 |
View all notes |
Set NEW NOTE alert |
Company Profile |
SEC
News |
Chart |
Request a new note
C
A
S
I |
MA
-
NYSE
Mastercard Inc Cl A
DIVERSIFIED SERVICES - Business/Management Services
|
$193.35
|
+0.30
0.16% |
$194.09
|
3,264,441
80.94% of 50 DAV
50 DAV is 4,033,000
|
$193.72
-0.19%
|
5/2/2018
|
$184.96
|
PP = $183.83
|
|
MB = $193.02
|
Most Recent Note - 5/9/2018 3:41:06 PM
Y - Holding its ground stubbornly and rising after breaking out on 5/02/18 from a riskier "late stage" base. Reported earnings +49% on +31% sales revenues for the Mar '18 quarter. Helping it better match the winning models of the fact-based investment system, sequential quarterly comparisons have shown encouraging sales revenues acceleration and earnings increases above the +25% minimum earnings guideline (C criteria). Annual earnings growth has been good.
>>> FEATURED STOCK ARTICLE : Gap Up and Volume Driven Gain for New High After Earnings - 5/2/2018 |
View all notes |
Set NEW NOTE alert |
Company Profile |
SEC
News |
Chart |
Request a new note
C
A
S
I |
V
-
NYSE
Visa Inc Cl A
DIVERSIFIED SERVICES - Business/Management Services
|
$131.82
|
+0.82
0.63% |
$132.09
|
5,427,030
67.69% of 50 DAV
50 DAV is 8,017,000
|
$131.75
0.05%
|
4/26/2018
|
$126.68
|
PP = $126.98
|
|
MB = $133.33
|
Most Recent Note - 5/9/2018 3:47:33 PM
Y - Inching to new highs with today's 5th consecutive small gain backed by below average volume. Held its ground stubbornly after a technical breakout noted in the 4/26/18 mid-day report. Reported earnings +29% on +13% sales revenues for the Mar '18 quarter, and 3 of the past 4 quarterly comparisons were above the +25% minimum earnings guideline (C criteria).
>>> FEATURED STOCK ARTICLE : Volume-Driven Gain For New High Triggered Technical Buy Signal - 4/26/2018 |
View all notes |
Set NEW NOTE alert |
Company Profile |
SEC
News |
Chart |
Request a new note
C
A
S
I |
Symbol/Exchange
Company Name
Industry Group |
PRICE |
CHANGE
(%Change) |
Day High |
Volume
(% DAV)
(% 50 day avg vol) |
52 Wk Hi
% From Hi |
Featured
Date |
Price
Featured |
Pivot Featured |
|
Max Buy |
TPL
-
NYSE
Texas Pacific Land Trust
FINANCIAL SERVICES - Diversified Investments
|
$645.80
|
-10.63
-1.62% |
$664.30
|
18,243
114.02% of 50 DAV
50 DAV is 16,000
|
$677.15
-4.63%
|
4/13/2018
|
$547.85
|
PP = $552.10
|
|
MB = $579.71
|
Most Recent Note - 5/8/2018 1:08:18 PM
G - Pulling back today from a new all-time high after a streak of 9 consecutive gains marked by heavy volume while getting very extended from the prior base. Reported earnings +130% on +97% sales revenues for the Mar '18 quarter and gapped up on 5/01/18 for a considerable volume-driven gain, rallying above the pivot point cited based on its 2/28/18 high plus 10 cents. Prior highs in the $569-552 area define initial support to watch above its 50 DMA line ($537).
>>> FEATURED STOCK ARTICLE : Perched Near Prior High After Showing Resilience - 4/20/2018 |
View all notes |
Set NEW NOTE alert |
Company Profile |
SEC
News |
Chart |
Request a new note
C
A
S
I |
STMP
-
NASDAQ
Stamps.com Inc
INTERNET - Internet Software and Services
|
$247.60
|
-1.20
-0.48% |
$249.65
|
319,487
98.61% of 50 DAV
50 DAV is 324,000
|
$250.00
-0.96%
|
5/4/2018
|
$234.15
|
PP = $233.23
|
|
MB = $244.89
|
Most Recent Note - 5/9/2018 3:55:22 PM
G - Color code is changed to green after quietly rising above its "max buy" level hitting another new all-time high today. Prior highs in the $233 area define initial support above its 50 DMA line.
>>> FEATURED STOCK ARTICLE : Volume-Driven Gain For New High - 5/4/2018 |
View all notes |
Set NEW NOTE alert |
Company Profile |
SEC
News |
Chart |
Request a new note
C
A
S
I |
DPZ
-
NYSE
Dominos Pizza Inc
WHOLESALE - Food Wholesale
|
$249.91
|
+0.19
0.08% |
$251.12
|
325,665
48.18% of 50 DAV
50 DAV is 676,000
|
$255.00
-2.00%
|
2/20/2018
|
$224.86
|
PP = $222.01
|
|
MB = $233.11
|
Most Recent Note - 5/7/2018 6:04:40 PM
G - Consolidating above prior highs following a big 4/26/18 gap up for a new all-time high. Bullish action came after it reported earnings +59% on +26% sales revenues for the Mar '18 quarter, continuing its strong earnings track record. Its 50 DMA line ($232) and recent lows define near-term support to watch on pullbacks.
>>> FEATURED STOCK ARTICLE : Earnings News Due From Pizza Firm - 4/23/2018 |
View all notes |
Set NEW NOTE alert |
Company Profile |
SEC
News |
Chart |
Request a new note
C
A
S
I |
FIVE
-
NASDAQ
Five Below Inc
Retail-DiscountandVariety
|
$71.01
|
-0.13
-0.18% |
$71.50
|
618,323
41.69% of 50 DAV
50 DAV is 1,483,000
|
$78.28
-9.29%
|
3/9/2018
|
$68.58
|
PP = $73.65
|
|
MB = $77.33
|
Most Recent Note - 5/7/2018 6:06:41 PM
Y - Slumped into the prior base recently raising concerns. Found support near its 50 DMA line ($71.14). Damaging losses may trigger a more worrisome technical sell signal. See the latest FSU analysis for more details and a new annotated graph.
>>> FEATURED STOCK ARTICLE : Trading Near 50-Day Average After Falling Into Prior Base - 5/7/2018 |
View all notes |
Set NEW NOTE alert |
Company Profile |
SEC
News |
Chart |
Request a new note
C
A
S
I |
NOW
-
NYSE
Servicenow Inc
Computer Sftwr-Enterprse
|
$178.87
|
-0.11
-0.06% |
$180.04
|
1,527,366
73.86% of 50 DAV
50 DAV is 2,068,000
|
$182.59
-2.03%
|
5/8/2018
|
$174.63
|
PP = $176.66
|
|
MB = $185.49
|
Most Recent Note - 5/8/2018 5:16:37 PM
Y - Finished flat after highlighted in yellow with pivot point cited based on its 3/14/18 high plus 10 cents. Gains backed by at least +40% above average volume while rising above the pivot point may trigger a technical buy signal. Rebounded above its 50 DMA line recently, and touched a new all-time high with a quiet gain on the prior session. Reported earnings +81% on +37% sales revenues for the Mar '18 quarter, and prior quarterly comparisons were above the +25% minimum earnings guideline (C criteria). See the latest FSU analysis for more details and a new annotated graph.
>>> FEATURED STOCK ARTICLE : High-Ranked Software - Enterprise Firm is Near Pivot Point - 5/8/2018 |
View all notes |
Set NEW NOTE alert |
Company Profile |
SEC
News |
Chart |
Request a new note
C
A
S
I |
Symbol/Exchange
Company Name
Industry Group |
PRICE |
CHANGE
(%Change) |
Day High |
Volume
(% DAV)
(% 50 day avg vol) |
52 Wk Hi
% From Hi |
Featured
Date |
Price
Featured |
Pivot Featured |
|
Max Buy |
NVEE
-
NASDAQ
N V 5 Global Inc
Comml Svcs-Consulting
|
$59.35
|
-0.20
-0.34% |
$60.90
|
54,473
57.95% of 50 DAV
50 DAV is 94,000
|
$71.90
-17.45%
|
4/9/2018
|
$58.35
|
PP = $59.05
|
|
MB = $62.00
|
Most Recent Note - 5/11/2018 5:47:34 PM
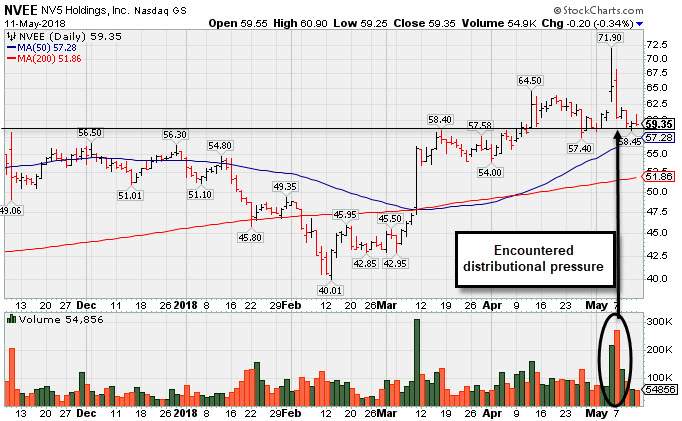
Y - Encountered distributional pressure recently, pulling back near prior highs defining initial support in the $58-59 area. Reported earnings +51% on +48% sales revenues for the Mar '18 quarter, continuing its strong earnings track record. See the latest FSU analysis for more details and an annotated graph.
>>> FEATURED STOCK ARTICLE : Encountered Distributional Pressure After Hitting New High - 5/11/2018 |
View all notes |
Set NEW NOTE alert |
Company Profile |
SEC
News |
Chart |
Request a new note
C
A
S
I |
QLYS
-
NASDAQ
Qualys Inc
Computer Sftwr-Security
|
$77.30
|
-1.30
-1.65% |
$79.00
|
140,913
42.83% of 50 DAV
50 DAV is 329,000
|
$85.00
-9.06%
|
4/17/2018
|
$82.85
|
PP = $79.50
|
|
MB = $83.48
|
Most Recent Note - 5/8/2018 5:21:54 PM
Y - Rebounded above its 50 DMA line ($76.61) and its color code is changed to yellow. Recently reported earnings +80% on +22% sales revenues for the Mar '18 quarter, continuing its strong earnings track record.
>>> FEATURED STOCK ARTICLE : Quickly Rallied More Than 5% Above Prior High - 4/18/2018 |
View all notes |
Set NEW NOTE alert |
Company Profile |
SEC
News |
Chart |
Request a new note
C
A
S
I |
SPLK
-
NASDAQ
Splunk Inc
Computer Sftwr-Database
|
$116.05
|
-0.79
-0.68% |
$117.86
|
1,022,547
51.57% of 50 DAV
50 DAV is 1,983,000
|
$117.86
-1.53%
|
5/8/2018
|
$113.14
|
PP = $112.76
|
|
MB = $118.40
|
Most Recent Note - 5/8/2018 5:27:34 PM
Y - Touched a new high with below average volume behind today's 4th consecutive gain. Color code is changed to yellow with new pivot point cited based on its 3/21/18 high plus 10 cents. Gains above a stock's pivot point must have at least +40% above average volume to trigger a proper technical buy signal. Found prompt support near its 50 DMA line ($103) during its ongoing ascent.
>>> FEATURED STOCK ARTICLE : Found Support Near 50-Day Average on Pullbacks - 4/19/2018 |
View all notes |
Set NEW NOTE alert |
Company Profile |
SEC
News |
Chart |
Request a new note
C
A
S
I |
SUPN
-
NASDAQ
Supernus Pharmaceuticals
Medical-Biomed/Biotech
|
$57.05
|
+7.15
14.33% |
$57.95
|
2,696,085
395.90% of 50 DAV
50 DAV is 681,000
|
$51.10
11.64%
|
4/24/2018
|
$47.73
|
PP = $50.15
|
|
MB = $52.66
|
Most Recent Note - 5/11/2018 12:59:46 PM
G - Gapped up and hit another new all-time high with today's 3rd consecutive big volume-driven gain, quickly rallying above the "max buy" level" and its color code was changed to green. Bullish action came after it reported earnings +158% on +57% sales revenues for the Mar '18 quarter, continuing its strong earnings track record.
>>> FEATURED STOCK ARTICLE : Pharmaceutical Firm Perched Near Record High - 4/24/2018 |
View all notes |
Set NEW NOTE alert |
Company Profile |
SEC
News |
Chart |
Request a new note
C
A
S
I |
PAYC
-
NYSE
Paycom Software Inc
COMPUTER SOFTWARE and SERVICES - Application Software
|
$107.38
|
-2.14
-1.95% |
$109.81
|
830,050
116.74% of 50 DAV
50 DAV is 711,000
|
$118.45
-9.35%
|
2/15/2018
|
$95.01
|
PP = $93.61
|
|
MB = $98.29
|
Most Recent Note - 5/9/2018 3:43:01 PM
G - Halted its slide and it has been consolidating near its 50 DMA line ($109.34). Reported earnings +56% on +29% sales revenues for the Mar '18 quarter. Recent lows in the $101 area define important support to watch where further deterioration would raise concerns.
>>> FEATURED STOCK ARTICLE : Violation of 50-Day Average Triggered Technical Sell Signal - 5/3/2018 |
View all notes |
Set NEW NOTE alert |
Company Profile |
SEC
News |
Chart |
Request a new note
C
A
S
I |
Symbol/Exchange
Company Name
Industry Group |
PRICE |
CHANGE
(%Change) |
Day High |
Volume
(% DAV)
(% 50 day avg vol) |
52 Wk Hi
% From Hi |
Featured
Date |
Price
Featured |
Pivot Featured |
|
Max Buy |
GRUB
-
NYSE
Grubhub Inc
COMPUTER SOFTWARE and SERVICES - Technical and System Software
|
$102.04
|
-2.36
-2.26% |
$104.57
|
964,262
61.38% of 50 DAV
50 DAV is 1,571,000
|
$112.41
-9.23%
|
6/21/2017
|
$47.33
|
PP = $46.94
|
|
MB = $49.29
|
Most Recent Note - 5/8/2018 5:31:04 PM
G - Consolidating near and quietly closing above its 50 DMA line ($101.96) today. Faces resistance due to overhead supply up to the $112 level. Recently reported earnings +79% on +49% sales revenues for the Mar '18 quarter.
>>> FEATURED STOCK ARTICLE : Consolidating Near 50 Day Average With Earnings News Due - 4/30/2018 |
View all notes |
Set NEW NOTE alert |
Company Profile |
SEC
News |
Chart |
Request a new note
C
A
S
I |
HQY
-
NASDAQ
Healthequity Inc
COMPUTER SOFTWARE and SERVICES - Healthcare Information Service
|
$71.48
|
+1.24
1.77% |
$71.62
|
297,015
48.53% of 50 DAV
50 DAV is 612,000
|
$70.89
0.83%
|
5/2/2018
|
$66.31
|
PP = $68.85
|
|
MB = $72.29
|
Most Recent Note - 5/9/2018 3:39:13 PM
Y - Volume totals have been below average while recently wedging into new all-time high territory. Color code was changed to yellow with new pivot point cited based on its 3/22/18 high plus 10 cents. Gains above a stock's pivot point must have at least +40% above average volume to trigger a new (or add-on) technical buy signal. Its 50 DMA line ($63.10) defines near term support above the recent low ($59.50 on 4/03/18).
>>> FEATURED STOCK ARTICLE : Perched Near All-Time High Building a Short New Base - 4/25/2018 |
View all notes |
Set NEW NOTE alert |
Company Profile |
SEC
News |
Chart |
Request a new note
C
A
S
I |
LOB
-
NASDAQ
Live Oak Bancshares Inc
Banks-Southeast
|
$29.05
|
-0.05
-0.17% |
$29.30
|
45,979
35.64% of 50 DAV
50 DAV is 129,000
|
$30.05
-3.33%
|
3/16/2018
|
$28.63
|
PP = $28.30
|
|
MB = $29.72
|
Most Recent Note - 5/7/2018 6:12:27 PM
Y - Consolidating above its 50 DMA line ($28.15) and prior lows where more damaging losses would raise greater concerns. Recently reported earnings +63% on +42% for the Mar '18 quarter.
>>> FEATURED STOCK ARTICLE : Tested Support at 50-Day Moving Average After Breakout - 4/16/2018 |
View all notes |
Set NEW NOTE alert |
Company Profile |
SEC
News |
Chart |
Request a new note
C
A
S
I |
PYPL
-
NASDAQ
Paypal Holdings Inc
Finance-CrdtCard/PmtPr
|
$79.20
|
+0.01
0.01% |
$79.39
|
9,540,301
111.92% of 50 DAV
50 DAV is 8,524,000
|
$86.32
-8.25%
|
2/1/2018
|
$80.35
|
PP = $79.49
|
|
MB = $83.46
|
Most Recent Note - 5/9/2018 3:45:12 PM
G - Posting a 5th consecutive gain after it found prompt support near its 200 DMA line and prior lows in the $71-72 area. More damaging losses would raise serious concerns. A rebound above the 50 DMA line ($77.52) is needed for its outlook to improve. Recently reported earnings +30% on +24% sales revenues for the Mar '18 quarter.
>>> FEATURED STOCK ARTICLE : Slumping Near Important Near-Term Support - 4/27/2018 |
View all notes |
Set NEW NOTE alert |
Company Profile |
SEC
News |
Chart |
Request a new note
C
A
S
I |
OLLI
-
NASDAQ
Ollie's Bargain Outlet
Retail-DiscountandVariety
|
$66.30
|
+1.25
1.92% |
$66.50
|
607,089
91.02% of 50 DAV
50 DAV is 667,000
|
$65.05
1.92%
|
4/10/2018
|
$62.05
|
PP = $62.15
|
|
MB = $65.26
|
Most Recent Note - 5/7/2018 6:10:56 PM
Y - Volume totals have cooled while hovering in a tight range near its all-time high. No resistance remains due to overhead supply.
>>> FEATURED STOCK ARTICLE : Encountered Distribution, Finished Below Pivot Point After Early Gain - 4/11/2018 |
View all notes |
Set NEW NOTE alert |
Company Profile |
SEC
News |
Chart |
Request a new note
C
A
S
I |
Symbol/Exchange
Company Name
Industry Group |
PRICE |
CHANGE
(%Change) |
Day High |
Volume
(% DAV)
(% 50 day avg vol) |
52 Wk Hi
% From Hi |
Featured
Date |
Price
Featured |
Pivot Featured |
|
Max Buy |
NOVT
-
NASDAQ
Novanta Inc
Elec-Scientific/Msrng
|
$63.05
|
-0.35
-0.55% |
$63.90
|
136,326
60.06% of 50 DAV
50 DAV is 227,000
|
$64.00
-1.48%
|
4/17/2018
|
$60.55
|
PP = $60.40
|
|
MB = $63.42
|
Most Recent Note - 5/8/2018 5:41:00 PM
Y - Posted a 5th consecutive gain backed by above average volume. Reported earnings +52% on +35% sales revenues for the Mar '18 quarter. Found support near prior highs in the $58 area and stayed above its 50 DMA line ($56.40) during the recent consolidation.
>>> FEATURED STOCK ARTICLE : Volume-Driven Gain Hit New All-Time High - 4/17/2018 |
View all notes |
Set NEW NOTE alert |
Company Profile |
SEC
News |
Chart |
Request a new note
C
A
S
I |
SEDG
-
NASDAQ
Solaredge Technologies
Energy-Solar
|
$64.30
|
-0.55
-0.85% |
$65.45
|
1,171,571
154.15% of 50 DAV
50 DAV is 760,000
|
$65.00
-1.08%
|
5/9/2018
|
$55.33
|
PP = $59.30
|
|
MB = $62.27
|
Most Recent Note - 5/11/2018 12:59:01 PM
G - Holding its ground today. Quickly rallied above the "max buy" level and its color code was changed to green. Bullish action came after it reported earnings +142% on +82% sales revenues for the Mar '18 quarter, continuing its strong track record. See the latest FSU analysis for more details and an annotated graph.
>>> FEATURED STOCK ARTICLE : Quickly Rallied Following Strong Earnings News - 5/10/2018 |
View all notes |
Set NEW NOTE alert |
Company Profile |
SEC
News |
Chart |
Request a new note
C
A
S
I |
SEND
-
NYSE
Sendgrid Inc
INTERNET - Content
|
$27.56
|
-0.55
-1.96% |
$28.45
|
264,321
65.43% of 50 DAV
50 DAV is 404,000
|
$32.03
-13.95%
|
3/6/2018
|
$28.00
|
PP = $28.37
|
|
MB = $29.79
|
Most Recent Note - 5/9/2018 3:53:11 PM
G - A rebound above the 50 DMA line ($28.06) is needed for its outlook to improve. Held its ground above the prior low ($23.77 on 4/04/18) after triggering a technical sell signal. Weak action followed news earnings rose +100% on +31% sales revenues for the Mar '18 quarter continuing its strong earnings track record. Completed a new Public Offering and Secondary Offering on 4/05/18.
>>> FEATURED STOCK ARTICLE : Earnings News Continues to be Strong - 5/1/2018 |
View all notes |
Set NEW NOTE alert |
Company Profile |
SEC
News |
Chart |
Request a new note
C
A
S
I |