You are not logged in.
This means you
CAN ONLY VIEW reports that were published prior to Wednesday, March 19, 2025.
You
MUST UPGRADE YOUR MEMBERSHIP if you want to see any current reports.
AFTER MARKET UPDATE - WEDNESDAY, MAY 2ND, 2018
Previous After Market Report Next After Market Report >>>
|
|
|
|
DOW |
-174.07 |
23,924.98 |
-0.72% |
|
Volume |
915,725,710 |
+13% |
|
Volume |
2,137,382,402 |
+12% |
|
NASDAQ |
-29.80 |
7,100.90 |
-0.42% |
|
Advancers |
1,407 |
48% |
|
Advancers |
1,504 |
54% |
|
S&P 500 |
-19.13 |
2,635.67 |
-0.72% |
|
Decliners |
1,518 |
52% |
|
Decliners |
1,282 |
46% |
|
Russell 2000 |
+4.70 |
1,555.04 |
+0.30% |
|
52 Wk Highs |
75 |
|
|
52 Wk Highs |
83 |
|
|
S&P 600 |
+1.53 |
953.41 |
+0.16% |
|
52 Wk Lows |
65 |
|
|
52 Wk Lows |
51 |
|
|
 |
Major Indices Ended Choppy Session Lower
Kenneth J. Gruneisen - Passed the CAN SLIM® Master's Exam
Stocks finished lower Wednesday. The Dow was down 174 points to 23924 while the S&P 500 lost 19 points to 2635. The Nasdaq Composite was off 29 points to 7100. The volume totals reported were higher than the prior session totals on the NYSE and on the Nasdaq exchange. Advancers led decliners by a 7-6 margin on the Nasdaq exchange while decliners held a small lead over advancers on the NYSE. There were 38 high-ranked companies from the Leaders List that made new 52-week highs and were listed on the BreakOuts Page, versus the total of 14 on the prior session. New 52-week highs outnumbered new 52-week lows on the NYSE and on the Nasdaq exchange. The major indices (M criteria) have slumped as the latest confirmed rally has come under pressure. New buying efforts are justified only when all key criteria of the fact-based investment system are satisfied. The Featured Stocks Page provides the most timely analysis on high-ranked leaders. Charts used courtesy of www.stockcharts.com
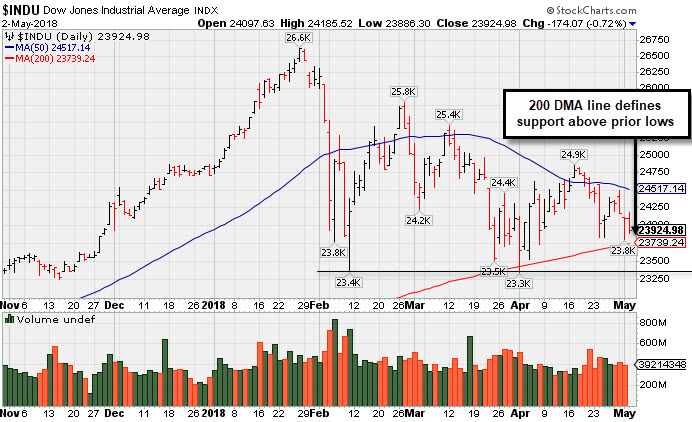 PICTURED: The Dow Jones Industrial Average met resistance near its 50-day moving average (DMA) line recently. It is consolidating above the 200 DMA line and prior lows which define important near-term support.
The major averages declined as investors turned their attention to the Fed. At the conclusion of the FOMC meeting today, the U.S. central bank unanimously voted to leave interest rates unchanged. The Fed noted that inflation is close to target, and expects that “economic conditions will evolve in a manner that will warrant further gradual increases in the federal funds rate”. On the data front, a report showed weekly mortgage applications fell 2.5%. A separate release from ADP showed that private payrolls increased 204,000 in April, above estimates of a 198,000 increase.
Ten of 11 S&P 500 sectors finished in negative territory as Consumer Staples lagged. In earnings news, Apple (AAPL + 4.42%) rose after topping analyst estimates and announcing a $100 billion stock buyback program. Gilead Sciences (GILD -7.86%) fell after missing Wall Street estimates on the top and bottom line. Humana (HUM -2.55%) fell despite topping profit projections. Meanwhile, Snap (SNAP -21.94%) tumbled after the social media company missed revenue projections and provided weak forward guidance.
Treasuries were mostly unchanged with the yield on the benchmark 10-year note steady at 2.97%. In commodities, WTI crude gained 0.6% to $67.67/barrel. COMEX gold lost 0.1% to $1305.50/ounce. |
 Kenneth J. Gruneisen started out as a licensed stockbroker in August 1987, a couple of months prior to the historic stock market crash that took the Dow Jones Industrial Average down -22.6% in a single day. He has published daily fact-based fundamental and technical analysis on high-ranked stocks online for two decades. Through FACTBASEDINVESTING.COM, Kenneth provides educational articles, news, market commentary, and other information regarding proven investment systems that work in good times and bad.
Comments contained in the body of this report are technical opinions only and are not necessarily those of Gruneisen Growth Corp. The material herein has been obtained from sources believed to be reliable and accurate, however, its accuracy and completeness cannot be guaranteed. Our firm, employees, and customers may effect transactions, including transactions contrary to any recommendation herein, or have positions in the securities mentioned herein or options with respect thereto. Any recommendation contained in this report may not be suitable for all investors and it is not to be deemed an offer or solicitation on our part with respect to the purchase or sale of any securities. |
|
 |
Commodity-Linked Groups Rose Amid Widespread Losses
Kenneth J. Gruneisen - Passed the CAN SLIM® Master's Exam
On Wednesday the Retail Index ($RLX -0.21%) and the Broker/Dealer Index ($XBD -0.10%) both edged lower while the Bank Index ($BKX -0.82%) suffered a larger loss. The tech sector had a negative bias as the Biotech Index ($BTK -1.20%) led decliners while the Semiconductor Index ($SOX -0.51%) and Networking Index ($NWX -0.21%) each ended slightly lower. Commodity-linked groups had a slightly positive bias as the Integrated Oil Index ($XOI +0.34%), Oil Services Index ($OSX +0.80%), and the Gold & Silver Index ($XAU +0.61%) each posted a modest gain. Charts courtesy of www.stockcharts.com
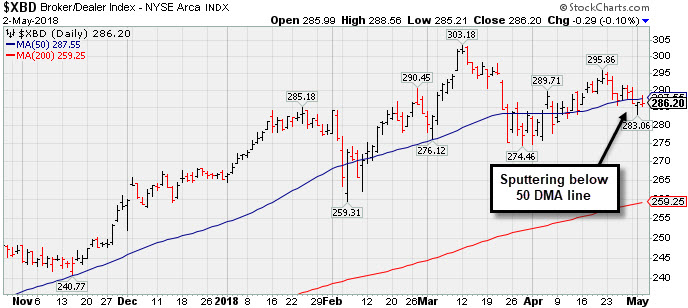 PICTURED: The Broker/Dealer Index ($XBD -0.10%) is sputtering below its 50-day moving average (DMA) line.
| Oil Services |
$OSX |
155.03 |
+1.23 |
+0.80% |
+3.66% |
| Integrated Oil |
$XOI |
1,469.14 |
+5.04 |
+0.34% |
+10.00% |
| Semiconductor |
$SOX |
1,259.42 |
-6.52 |
-0.52% |
+0.51% |
| Networking |
$NWX |
528.38 |
-1.10 |
-0.21% |
+7.72% |
| Broker/Dealer |
$XBD |
286.20 |
-0.29 |
-0.10% |
+7.90% |
| Retail |
$RLX |
2,025.16 |
-4.25 |
-0.21% |
+16.81% |
| Gold & Silver |
$XAU |
81.92 |
+0.50 |
+0.61% |
-3.93% |
| Bank |
$BKX |
106.23 |
-0.87 |
-0.81% |
-0.45% |
| Biotech |
$BTK |
4,465.52 |
-54.29 |
-1.20% |
+5.76% |
|
|
|
 |
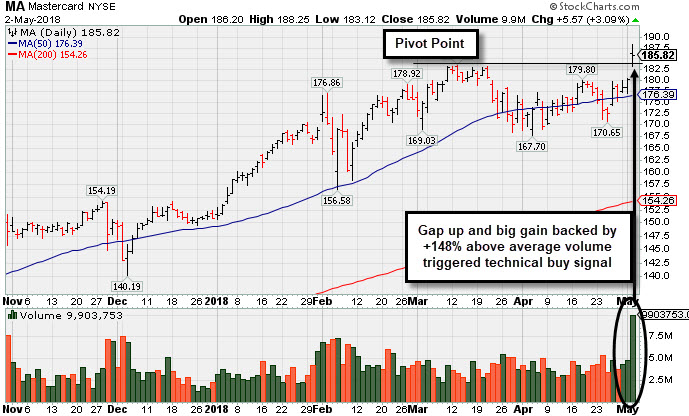
Gap Up and Volume Driven Gain for New High After Earnings
Kenneth J. Gruneisen - Passed the CAN SLIM® Master's Exam
Mastercard Inc Cl A (MA +$5.57 or +3.09% to $185.82) gapped up today as it powered to new all-time highs (N criteria) with a volume-driven gain that offered investors convincing proof of fresh institutional (I criteria) buying demand. It was highlighted in yellow in the earlier mid-day report (read here) as it rose above the pivot point cited based on its 3/13/18 high plus 10 cents with a big gain backed by +146% above average volume. It has been showing impressive acceleration in its sequential quarterly sales revenues and earnings increases. For the quarter ended March 31, 2018 it reported a +49% earnings increase on +31% sales revenues versus the year-ago period, above +25% minimum quarterly earnings increase needed to satisfy the C criteria. It reported earnings increases +15%,+24%, +33% and +49% in the Jun, Sep, Dec '17 and Mar '18 quarterly comparisons, respectively, with sales revenues increases of +13%, +18%, +20% and +31% during that span. It has also maintained a strong annual earnings (A criteria) history. The Finance - Credit Card/Payment Processing group has shown recent leadership (L criteria) that includes strong performing peers such as Visa Inc (V). The number of top-rated funds owning its shares rose from 2,802 in Jun '17 to 2,988 in Mar '18, however, it is already heavily owned by the institutional crowd (I criteria). It made impressive progress even though sales revenues and earnings increases were not a great match with the fact-based investment system's guidelines for much of the time since its last FSU appearance on 4/11/12 with an annotated graph under the headline, " Distributional Action Opposed to Fresh Institutional Buying Demand". |
|
|
Color Codes Explained :
Y - Better candidates highlighted by our
staff of experts.
G - Previously featured
in past reports as yellow but may no longer be buyable under the
guidelines.
***Last / Change / Volume data in this table is the closing quote data***
Symbol/Exchange
Company Name
Industry Group |
PRICE |
CHANGE
(%Change) |
Day High |
Volume
(% DAV)
(% 50 day avg vol) |
52 Wk Hi
% From Hi |
Featured
Date |
Price
Featured |
Pivot Featured |
|
Max Buy |
PFBC
-
NASDAQ
Preferred Bank Los Angls
BANKING - Regional - Pacific Banks
|
$63.04
|
-0.21
-0.33% |
$64.09
|
101,401
119.58% of 50 DAV
50 DAV is 84,800
|
$67.65
-6.81%
|
4/10/2018
|
$64.56
|
PP = $67.75
|
|
MB = $71.14
|
Most Recent Note - 5/1/2018 1:05:56 PM
G - Color code is changed to green while slumping below its 50 DMA line ($64.84) this week and also undercutting the prior low, raising concerns and triggering technical sell signals. A prompt rebound above the 50 DMA line is needed for its outlook to improve.
>>> FEATURED STOCK ARTICLE : Bank Stock Hovering Within Striking Distance of Prior High - 4/10/2018 |
View all notes |
Set NEW NOTE alert |
Company Profile |
SEC
News |
Chart |
Request a new note
C
A
S
I |
SIVB
-
NASDAQ
S V B Financial Group
BANKING - Regional - Pacific Banks
|
$306.01
|
+0.55
0.18% |
$309.40
|
834,567
106.45% of 50 DAV
50 DAV is 784,000
|
$308.37
-0.77%
|
3/12/2018
|
$267.79
|
PP = $263.19
|
|
MB = $276.35
|
 Most Recent Note - 5/2/2018 5:14:09 PM
G - Color code is changed to green. Holding its ground stubbornly following a big "breakaway gap" for a new high on 4/27/18. Bullish action came after it reported financial results for the quarter ended March 31, 2018 and earnings rose +90% on +34% sales revenues versus the year ago period.
>>> FEATURED STOCK ARTICLE : Rebounded Above its 50-Day Moving Average - 4/12/2018 |
View all notes |
Set NEW NOTE alert |
Company Profile |
SEC
News |
Chart |
Request a new note
C
A
S
I |
MA
-
NYSE
Mastercard Inc Cl A
DIVERSIFIED SERVICES - Business/Management Services
|
$185.82
|
+5.57
3.09% |
$188.25
|
9,897,244
248.18% of 50 DAV
50 DAV is 3,988,000
|
$183.73
1.14%
|
5/2/2018
|
$184.96
|
PP = $183.83
|
|
MB = $193.02
|
Most Recent Note - 5/2/2018 12:31:00 PM
Y - Color code is changed to yellow with pivot point cited based on its 3/13/18 high plus 10 cents. Gapped up today hitting a new all-time high, rising from a riskier "late stage" base. Reported earnings +49% on +31% sales revenues for the Mar '18 quarter. Helping it better match the winning models of the fact-based investment system, sequential quarterly comparisons have shown encouraging sales revenues acceleration and earnings increases above the +25% minimum earnings guideline (C criteria). Annual earnings growth has been good.
>>> FEATURED STOCK ARTICLE : Gap Up and Volume Driven Gain for New High After Earnings - 5/2/2018 |
View all notes |
Set NEW NOTE alert |
Company Profile |
SEC
News |
Chart |
Request a new note
C
A
S
I |
V
-
NYSE
Visa Inc Cl A
DIVERSIFIED SERVICES - Business/Management Services
|
$126.38
|
-1.13
-0.89% |
$128.10
|
8,476,533
105.82% of 50 DAV
50 DAV is 8,010,000
|
$127.90
-1.19%
|
4/26/2018
|
$126.68
|
PP = $126.98
|
|
MB = $133.33
|
Most Recent Note - 5/2/2018 5:16:00 PM
Y - Touched a new high today but reversed into the red. Finished strong after highlighted in yellow with pivot point cited based on its 1/29/18 high plus 10 cents in the 4/26/18 mid-day report. Reported earnings +29% on +13% sales revenues for the Mar '18 quarter, and 3 of the past 4 quarterly comparisons were above the +25% minimum earnings guideline (C criteria).
>>> FEATURED STOCK ARTICLE : Volume-Driven Gain For New High Triggered Technical Buy Signal - 4/26/2018 |
View all notes |
Set NEW NOTE alert |
Company Profile |
SEC
News |
Chart |
Request a new note
C
A
S
I |
TPL
-
NYSE
Texas Pacific Land Trust
FINANCIAL SERVICES - Diversified Investments
|
$620.24
|
+29.46
4.99% |
$623.00
|
28,214
201.53% of 50 DAV
50 DAV is 14,000
|
$593.38
4.53%
|
4/13/2018
|
$547.85
|
PP = $552.10
|
|
MB = $579.71
|
Most Recent Note - 5/2/2018 12:46:34 PM
G - Color code is changed to green after getting extended from the prior base. Reported strong results for the Mar '18 quarter and gapped up on the prior session hitting a new all-time high with a considerable volume-driven gain, rallying above the pivot point cited based on its 2/28/18 high plus 10 cents. No resistance remains due to overhead supply. The 50 DMA line defines near-term support to watch above the recent lows ($480).
>>> FEATURED STOCK ARTICLE : Perched Near Prior High After Showing Resilience - 4/20/2018 |
View all notes |
Set NEW NOTE alert |
Company Profile |
SEC
News |
Chart |
Request a new note
C
A
S
I |
Symbol/Exchange
Company Name
Industry Group |
PRICE |
CHANGE
(%Change) |
Day High |
Volume
(% DAV)
(% 50 day avg vol) |
52 Wk Hi
% From Hi |
Featured
Date |
Price
Featured |
Pivot Featured |
|
Max Buy |
DPZ
-
NYSE
Dominos Pizza Inc
WHOLESALE - Food Wholesale
|
$244.28
|
-3.40
-1.37% |
$246.98
|
521,287
59.71% of 50 DAV
50 DAV is 873,000
|
$255.00
-4.20%
|
2/20/2018
|
$224.86
|
PP = $222.01
|
|
MB = $233.11
|
Most Recent Note - 4/30/2018 6:18:16 PM
G - Pulled back today for a 2nd consecutive loss following a big 4/26/18 gap up for a new all-time high. Reported earnings +59% on +26% sales revenues for the Mar '18 quarter, continuing its strong earnings track record. Its 50 DMA line and recent lows define near-term support to watch on pullbacks.
>>> FEATURED STOCK ARTICLE : Earnings News Due From Pizza Firm - 4/23/2018 |
View all notes |
Set NEW NOTE alert |
Company Profile |
SEC
News |
Chart |
Request a new note
C
A
S
I |
FIVE
-
NASDAQ
Five Below Inc
Retail-DiscountandVariety
|
$70.90
|
+0.40
0.57% |
$71.29
|
1,049,006
71.12% of 50 DAV
50 DAV is 1,475,000
|
$78.28
-9.43%
|
3/9/2018
|
$68.58
|
PP = $73.65
|
|
MB = $77.33
|
Most Recent Note - 4/30/2018 6:16:35 PM
Y - Fell below prior highs and into the prior base today raising concerns with a big loss on higher volume testing its 50 DMA line ($70.69). More damaging losses may trigger a more worrisome technical sell signal.
>>> FEATURED STOCK ARTICLE : Quietly Hovering Near All-Time High - 4/5/2018 |
View all notes |
Set NEW NOTE alert |
Company Profile |
SEC
News |
Chart |
Request a new note
C
A
S
I |
NVEE
-
NASDAQ
N V 5 Global Inc
Comml Svcs-Consulting
|
$60.90
|
+2.15
3.66% |
$61.00
|
68,647
84.75% of 50 DAV
50 DAV is 81,000
|
$64.50
-5.58%
|
4/9/2018
|
$58.35
|
PP = $59.05
|
|
MB = $62.00
|
Most Recent Note - 5/2/2018 5:11:04 PM
Y - Consolidating above its pivot point after a pullback tested prior highs in the $58 area defining initial support. Due to report earnings after the close on Thursday, May 3rd. Volume and volatility often increase near earnings news.
>>> FEATURED STOCK ARTICLE : Perched Near High After 3 Strong Quarterly Comparisons - 4/9/2018 |
View all notes |
Set NEW NOTE alert |
Company Profile |
SEC
News |
Chart |
Request a new note
C
A
S
I |
QLYS
-
NASDAQ
Qualys Inc
Computer Sftwr-Security
|
$75.03
|
-2.28
-2.94% |
$75.40
|
796,221
244.99% of 50 DAV
50 DAV is 325,000
|
$85.00
-11.74%
|
4/17/2018
|
$82.85
|
PP = $79.50
|
|
MB = $83.48
|
Most Recent Note - 5/2/2018 12:40:59 PM
G - Reported earnings +80% on +22% sales revenues for the Mar '18 quarter. Gapped down today violating its 50 DMA line ($76.45) and also undercutting the prior low ($70.85 on 3/28/18) triggering technical sell signals. Its color code was changed to green. A rebound above the 50 DMA line is needed for its outlook to improve.
>>> FEATURED STOCK ARTICLE : Quickly Rallied More Than 5% Above Prior High - 4/18/2018 |
View all notes |
Set NEW NOTE alert |
Company Profile |
SEC
News |
Chart |
Request a new note
C
A
S
I |
SPLK
-
NASDAQ
Splunk Inc
Computer Sftwr-Database
|
$103.00
|
-0.19
-0.18% |
$104.48
|
732,680
37.00% of 50 DAV
50 DAV is 1,980,000
|
$112.66
-8.57%
|
2/15/2018
|
$96.06
|
PP = $93.68
|
|
MB = $98.36
|
Most Recent Note - 5/2/2018 10:34:07 AM
G - Found prompt support near its 50 DMA line ($102) last week, but it has not formed a sound base. Subsequent losses and a breach of the prior low ($94.39 on 4/04/18) would raise more serious concerns.
>>> FEATURED STOCK ARTICLE : Found Support Near 50-Day Average on Pullbacks - 4/19/2018 |
View all notes |
Set NEW NOTE alert |
Company Profile |
SEC
News |
Chart |
Request a new note
C
A
S
I |
Symbol/Exchange
Company Name
Industry Group |
PRICE |
CHANGE
(%Change) |
Day High |
Volume
(% DAV)
(% 50 day avg vol) |
52 Wk Hi
% From Hi |
Featured
Date |
Price
Featured |
Pivot Featured |
|
Max Buy |
SUPN
-
NASDAQ
Supernus Pharmaceuticals
Medical-Biomed/Biotech
|
$46.85
|
-0.10
-0.21% |
$47.70
|
466,920
72.28% of 50 DAV
50 DAV is 646,000
|
$50.05
-6.38%
|
4/24/2018
|
$47.73
|
PP = $50.15
|
|
MB = $52.66
|
Most Recent Note - 5/1/2018 2:26:34 PM
Y - Still quietly hovering within close striking distance of its all-time high. Subsequent gains above the pivot point backed by at least +40% above average volume are needed to trigger a technical buy signal.
>>> FEATURED STOCK ARTICLE : Pharmaceutical Firm Perched Near Record High - 4/24/2018 |
View all notes |
Set NEW NOTE alert |
Company Profile |
SEC
News |
Chart |
Request a new note
C
A
S
I |
PAYC
-
NYSE
Paycom Software Inc
COMPUTER SOFTWARE and SERVICES - Application Software
|
$104.38
|
-8.21
-7.29% |
$108.85
|
2,205,764
327.75% of 50 DAV
50 DAV is 673,000
|
$118.45
-11.88%
|
2/15/2018
|
$95.01
|
PP = $93.61
|
|
MB = $98.29
|
Most Recent Note - 5/2/2018 12:37:43 PM
G - Gapped down today and violated its 50 DMA line ($108.36) after it reported earnings +56% on +29% sales revenues for the Mar '18 quarter. Volume and volatility often increase near earnings news. Below the 50 DMA line its recent low ($101.55 on 4/04/18) defines the next important support to watch.
>>> FEATURED STOCK ARTICLE : Pulling Back After Negative Reversal at All-Time High Last Week - 4/4/2018 |
View all notes |
Set NEW NOTE alert |
Company Profile |
SEC
News |
Chart |
Request a new note
C
A
S
I |
GRUB
-
NYSE
Grubhub Inc
COMPUTER SOFTWARE and SERVICES - Technical and System Software
|
$95.56
|
+2.91
3.14% |
$97.49
|
2,281,251
139.78% of 50 DAV
50 DAV is 1,632,000
|
$112.41
-14.99%
|
6/21/2017
|
$47.33
|
PP = $46.94
|
|
MB = $49.29
|
Most Recent Note - 5/1/2018 2:22:59 PM
G - Gapped down today after meeting resistance near its 50 DMA line ($101.81). Volume and volatility often increase near earnings news. Reported earnings +79% on +49% sales revenues for the Mar '18 quarter. See the latest FSU analysis for more details and an annotated graph.
>>> FEATURED STOCK ARTICLE : Consolidating Near 50 Day Average With Earnings News Due - 4/30/2018 |
View all notes |
Set NEW NOTE alert |
Company Profile |
SEC
News |
Chart |
Request a new note
C
A
S
I |
HQY
-
NASDAQ
Healthequity Inc
COMPUTER SOFTWARE and SERVICES - Healthcare Information Service
|
$67.28
|
+1.25
1.89% |
$67.55
|
628,652
89.68% of 50 DAV
50 DAV is 701,000
|
$68.75
-2.14%
|
5/2/2018
|
$66.31
|
PP = $68.85
|
|
MB = $72.29
|
Most Recent Note - 5/2/2018 10:28:05 AM
Y - Volume totals have been below average while hovering in a tight range in recent weeks near its all-time high. Color code is changed to yellow with new pivot point cited based on its 3/22/18 high plus 10 cents. Subsequent volume-driven gains for new highs may trigger a new (or add-on) technical buy signal. Its 50 DMA line ($61.57) defines near term support above the recent low ($59.50 on 4/03/18).
>>> FEATURED STOCK ARTICLE : Perched Near All-Time High Building a Short New Base - 4/25/2018 |
View all notes |
Set NEW NOTE alert |
Company Profile |
SEC
News |
Chart |
Request a new note
C
A
S
I |
LOB
-
NASDAQ
Live Oak Bancshares Inc
Banks-Southeast
|
$28.55
|
+0.40
1.42% |
$28.70
|
105,845
79.58% of 50 DAV
50 DAV is 133,000
|
$30.05
-4.99%
|
3/16/2018
|
$28.63
|
PP = $28.30
|
|
MB = $29.72
|
Most Recent Note - 4/30/2018 6:10:15 PM
Y - Recently reported earnings +63% on +42% for the Mar '18 quarter. Consolidating above its 50 DMA line ($27.97) and prior lows where more damaging losses would raise greater concerns.
>>> FEATURED STOCK ARTICLE : Tested Support at 50-Day Moving Average After Breakout - 4/16/2018 |
View all notes |
Set NEW NOTE alert |
Company Profile |
SEC
News |
Chart |
Request a new note
C
A
S
I |
Symbol/Exchange
Company Name
Industry Group |
PRICE |
CHANGE
(%Change) |
Day High |
Volume
(% DAV)
(% 50 day avg vol) |
52 Wk Hi
% From Hi |
Featured
Date |
Price
Featured |
Pivot Featured |
|
Max Buy |
PYPL
-
NASDAQ
Paypal Holdings Inc
Finance-CrdtCard/PmtPr
|
$71.73
|
-3.08
-4.12% |
$75.71
|
17,637,897
216.07% of 50 DAV
50 DAV is 8,163,000
|
$86.32
-16.90%
|
2/1/2018
|
$80.35
|
PP = $79.49
|
|
MB = $83.46
|
Most Recent Note - 5/2/2018 5:21:08 PM
G - Suffered a big loss today on more than 2 times average volume, testing its 200 DMA line ($71.84) and prior lows in the $71-72 area defining important support. More damaging losses would raise serious concerns. A rebound above the 50 DMA line ($77.88) is needed for its outlook to improve. Recently reported earnings +30% on +24% sales revenues for the Mar '18 quarter.
>>> FEATURED STOCK ARTICLE : Slumping Near Important Near-Term Support - 4/27/2018 |
View all notes |
Set NEW NOTE alert |
Company Profile |
SEC
News |
Chart |
Request a new note
C
A
S
I |
OLLI
-
NASDAQ
Ollie's Bargain Outlet
Retail-DiscountandVariety
|
$63.05
|
+0.55
0.88% |
$63.25
|
308,462
46.04% of 50 DAV
50 DAV is 670,000
|
$64.45
-2.17%
|
4/10/2018
|
$62.05
|
PP = $62.15
|
|
MB = $65.26
|
Most Recent Note - 4/30/2018 6:11:56 PM
Y - Still quietly hovering near its all-time high with volume totals cooling. Confirming gains above the pivot point backed by at least +40% above average volume are needed to trigger a proper technical buy signal.
>>> FEATURED STOCK ARTICLE : Encountered Distribution, Finished Below Pivot Point After Early Gain - 4/11/2018 |
View all notes |
Set NEW NOTE alert |
Company Profile |
SEC
News |
Chart |
Request a new note
C
A
S
I |
NOVT
-
NASDAQ
Novanta Inc
Elec-Scientific/Msrng
|
$57.95
|
-0.75
-1.28% |
$59.45
|
198,029
90.01% of 50 DAV
50 DAV is 220,000
|
$63.60
-8.88%
|
4/17/2018
|
$60.55
|
PP = $60.40
|
|
MB = $63.42
|
Most Recent Note - 5/2/2018 10:31:28 AM
Y - Undercut the prior high ($60.30 on 1/29/18) raising some concerns with recent losses. Stalled after recently rallying to new highs with an impressive streak of volume-driven gains. Prior highs in the $58 area define initial support to watch above its 50 DMA line ($55.97).
>>> FEATURED STOCK ARTICLE : Volume-Driven Gain Hit New All-Time High - 4/17/2018 |
View all notes |
Set NEW NOTE alert |
Company Profile |
SEC
News |
Chart |
Request a new note
C
A
S
I |
SEND
-
NYSE
Sendgrid Inc
INTERNET - Content
|
$25.88
|
-2.87
-9.98% |
$29.59
|
644,421
166.52% of 50 DAV
50 DAV is 387,000
|
$32.03
-19.19%
|
3/6/2018
|
$28.00
|
PP = $28.37
|
|
MB = $29.79
|
Most Recent Note - 5/2/2018 5:24:04 PM
G - Violated its 50 DMA line ($27.96) today with a damaging volume-driven loss triggering a technical sell signal. Weak action came after it reported earnings +100% on +31% sales revenues for the Mar '18 quarter continuing its strong earnings track record. Completed a new Public Offering and Secondary Offering on 4/05/18.
>>> FEATURED STOCK ARTICLE : Earnings News Continues to be Strong - 5/1/2018 |
View all notes |
Set NEW NOTE alert |
Company Profile |
SEC
News |
Chart |
Request a new note
C
A
S
I |
|
|
|
THESE ARE NOT BUY RECOMMENDATIONS!
Comments contained in the body of this report are technical
opinions only. The material herein has been obtained
from sources believed to be reliable and accurate, however,
its accuracy and completeness cannot be guaranteed.
This site is not an investment advisor, hence it does
not endorse or recommend any securities or other investments.
Any recommendation contained in this report may not
be suitable for all investors and it is not to be deemed
an offer or solicitation on our part with respect to
the purchase or sale of any securities. All trademarks,
service marks and trade names appearing in this report
are the property of their respective owners, and are
likewise used for identification purposes only.
This report is a service available
only to active Paid Premium Members.
You may opt-out of receiving report notifications
at any time. Questions or comments may be submitted
by writing to Premium Membership Services 665 S.E. 10 Street, Suite 201 Deerfield Beach, FL 33441-5634 or by calling 1-800-965-8307
or 954-785-1121.
|
|
|