You are not logged in.
This means you
CAN ONLY VIEW reports that were published prior to Wednesday, March 19, 2025.
You
MUST UPGRADE YOUR MEMBERSHIP if you want to see any current reports.
AFTER MARKET UPDATE - THURSDAY, APRIL 26TH, 2018
Previous After Market Report Next After Market Report >>>
|
|
|
|
DOW |
+238.51 |
24,322.34 |
+0.99% |
|
Volume |
832,484,960 |
+6% |
|
Volume |
2,136,294,920 |
+6% |
|
NASDAQ |
+114.94 |
7,118.68 |
+1.64% |
|
Advancers |
2,000 |
67% |
|
Advancers |
1,724 |
61% |
|
S&P 500 |
+27.54 |
2,666.94 |
+1.04% |
|
Decliners |
981 |
33% |
|
Decliners |
1,080 |
39% |
|
Russell 2000 |
+7.43 |
1,557.89 |
+0.48% |
|
52 Wk Highs |
60 |
|
|
52 Wk Highs |
66 |
|
|
S&P 600 |
+3.67 |
958.70 |
+0.38% |
|
52 Wk Lows |
76 |
|
|
52 Wk Lows |
62 |
|
|
 |
Positive Breadth as Indices Rose and Leadership Improved
Kenneth J. Gruneisen - Passed the CAN SLIM® Master's Exam
Stocks finished higher Thursday. The Dow climbed 238 points to 24322 while the S&P 500 gained 27 points to 2666. The Nasdaq Composite was up 114 points to 7118. The volume totals reported were higher than the prior session totals on the NYSE and on the Nasdaq exchange, indicative of an increase in buying demand from large institutional investors. Breadth was positive as advancers led decliners by a 2-1 margin on the NYSE and by a 3-2 margin on the Nasdaq exchange. Leadership improved as there were 27 high-ranked companies from the Leaders List that made new 52-week highs and were listed on the BreakOuts Page, versus the total of 8 on the prior session. New 52-week lows outnumbered new 52-week highs on the NYSE, yet new highs managed to outnumber new lows on the Nasdaq exchange. The major indices (M criteria) have slumped as the latest confirmed rally has come under pressure. New buying efforts are justified only when all key criteria of the fact-based investment system are satisfied. The Featured Stocks Page provides the most timely analysis on high-ranked leaders. Charts used courtesy of www.stockcharts.com
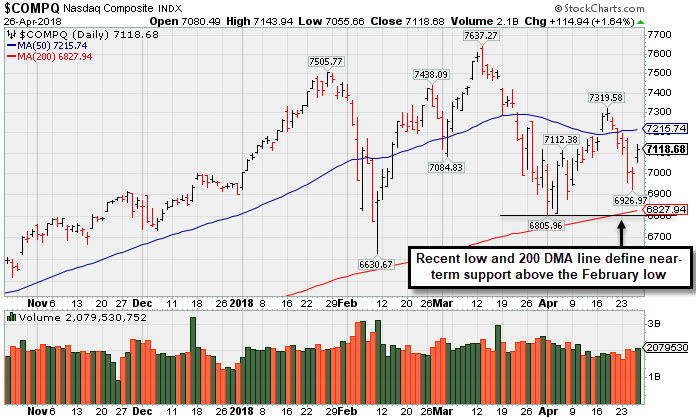 PICTURED: The Nasdaq Composite Index rose but remains below its 50-day moving average (DMA) line. It finished Thursday's session -6.8% off its record high. The 200 DMA line and prior lows define important near-term support for the benchmark index.
The major averages advanced into positive territory for the month of April amid several strong corporate earnings reports. On the data front, initial jobless claims declined to 209,000 in the prior week, well below consensus estimates of 230,000. A separate release showed durable goods orders rose 2.6% in March, above a 1.6% expected increase.
Nine of 11 sectors in the S&P 500 finished higher. Technology paced gains, with Facebook (FB +9.06%) advancing after topping analyst profit estimates. Advanced Micro Devices (AMD +13.70%) rose after its quarterly report revealed positive sales figures on its new products. In other earnings news, Chipotle Mexican Grill (CMG +24.44%) surged as the fast-casual chain bested earnings projections and was the subject of several analyst upgrades. Shares of O’Reilly Automotive (ORLY +13.06%) rose after the auto part retailer revealed revenue figures above consensus expectations. Telecom shares were notable decliners with AT&T (T -5.97%) after missing revenue and earnings estimates.
Treasuries strengthened with the yield on the benchmark 10-year note declining for the first time in nine days, falling four basis points to 2.98%. In commodities, WTI crude added 0.2% to $68.19/barrel. COMEX gold dipped 0.4% to $1316.30/ounce amid a stronger dollar.7003. |
 Kenneth J. Gruneisen started out as a licensed stockbroker in August 1987, a couple of months prior to the historic stock market crash that took the Dow Jones Industrial Average down -22.6% in a single day. He has published daily fact-based fundamental and technical analysis on high-ranked stocks online for two decades. Through FACTBASEDINVESTING.COM, Kenneth provides educational articles, news, market commentary, and other information regarding proven investment systems that work in good times and bad.
Comments contained in the body of this report are technical opinions only and are not necessarily those of Gruneisen Growth Corp. The material herein has been obtained from sources believed to be reliable and accurate, however, its accuracy and completeness cannot be guaranteed. Our firm, employees, and customers may effect transactions, including transactions contrary to any recommendation herein, or have positions in the securities mentioned herein or options with respect thereto. Any recommendation contained in this report may not be suitable for all investors and it is not to be deemed an offer or solicitation on our part with respect to the purchase or sale of any securities. |
|
 |
Retail, Energy, and Tech Groups Led Gainers
Kenneth J. Gruneisen - Passed the CAN SLIM® Master's Exam
On Thursday the Retail Index ($RLX +3.10%) posted a standout gain while the Broker/Dealer Index ($XBD +1.17%) posted a smaller gain but the Bank Index ($BKX -0.33%) ended slightly lower. The tech sector had a mostly positive bias as the Biotech Index ($BTK +1.88%) and the Semiconductor Index ($SOX +2.09%) both posted solid gains but the Networking Index ($NWX -0.36%) ended slightly lower. Energy-linked groups were higher as the Integrated Oil Index ($XOI +1.47%) and the Oil Services Index ($OSX +1.13%) both rose, meanwhile the mixed as the Gold & Silver Index ($XAU +0.07%) finished flat. Charts courtesy wwwstockcharts.com
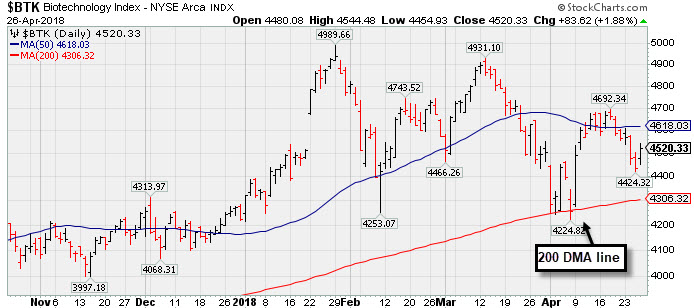 PICTURED: The Biotech Index ($BTK +1.88%) found support at its 200-day moving average (DMA) line recently, but it has been sputtering again.
| Oil Services |
$OSX |
157.77 |
+1.76 |
+1.13% |
+5.50% |
| Integrated Oil |
$XOI |
1,491.63 |
+21.59 |
+1.47% |
+11.69% |
| Semiconductor |
$SOX |
1,268.21 |
+26.02 |
+2.09% |
+1.21% |
| Networking |
$NWX |
539.90 |
-1.95 |
-0.36% |
+10.06% |
| Broker/Dealer |
$XBD |
290.55 |
+3.36 |
+1.17% |
+9.54% |
| Retail |
$RLX |
1,994.73 |
+59.95 |
+3.10% |
+15.05% |
| Gold & Silver |
$XAU |
82.52 |
+0.05 |
+0.06% |
-3.23% |
| Bank |
$BKX |
107.51 |
-0.36 |
-0.33% |
+0.75% |
| Biotech |
$BTK |
4,520.33 |
+83.62 |
+1.88% |
+7.06% |
|
|
|
 |
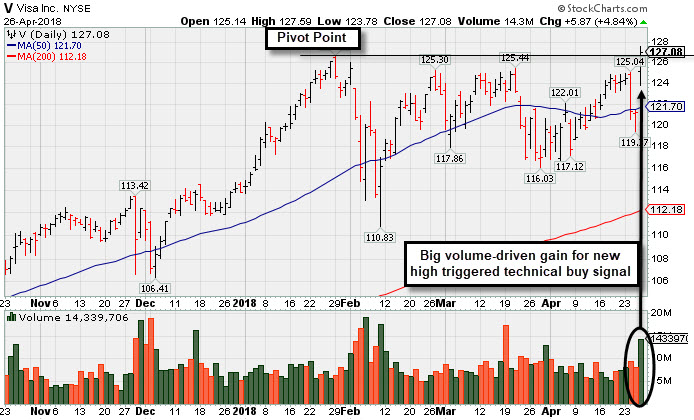
Volume-Driven Gain For New High Triggered Technical Buy Signal
Kenneth J. Gruneisen - Passed the CAN SLIM® Master's Exam
Visa Inc (V +$5.87 or +4.84% to $127.08) finished strong after highlighted in yellow with pivot point cited based on its 1/29/18 high plus 10 cents in the earlier mid-day report (read here). It gapped up today hitting a new all-time high closed above its pivot point with a big gain backed by +81% above average volume triggering a convincing technical buy signal. Reported earnings +29% on +13% sales revenues for the Mar '18 quarter, and 3 of the past 4 quarterly comparisons were above the +25% minimum earnings guideline (C criteria). Its strong and steady annual earnings history satisfies the A criteria. Over the past year it hadn't spent much time base building. Its fundamental and technical characteristics were not always a great match with the fact-based investment system's guidelines since its last appearance in this FSU section on 5/16/12 with an annotated graph under the headline, "Market Weakness Argues Against Tolerating Further Deterioration". Weak market conditions (the M criteria) at the time argued in favor of investors raising cash until a new rally was confirmed with a solid follow-through day from at least one of the major averages. The number of top-rated funds owning its shares rose from 3,624 in Jun '17 to 3,808 in Mar '18, a reassuring sign concerning the I criteria, however it is already well known by the institutional crowd.There are also 2.06 billion shares outstanding (S criteria), which can make it a less likely sprinter. Leadership shown by other firms in the Finance - Credit Card Payment Processing group (L criteria) has been a reassuring sign. Charts courtesy wwwstockcharts.com
 |
|
|
Color Codes Explained :
Y - Better candidates highlighted by our
staff of experts.
G - Previously featured
in past reports as yellow but may no longer be buyable under the
guidelines.
***Last / Change / Volume data in this table is the closing quote data***
Symbol/Exchange
Company Name
Industry Group |
PRICE |
CHANGE
(%Change) |
Day High |
Volume
(% DAV)
(% 50 day avg vol) |
52 Wk Hi
% From Hi |
Featured
Date |
Price
Featured |
Pivot Featured |
|
Max Buy |
PFBC
-
NASDAQ
Preferred Bank Los Angls
BANKING - Regional - Pacific Banks
|
$65.96
|
-0.53
-0.80% |
$66.99
|
43,828
52.18% of 50 DAV
50 DAV is 84,000
|
$67.65
-2.50%
|
4/10/2018
|
$64.56
|
PP = $67.75
|
|
MB = $71.14
|
Most Recent Note - 4/25/2018 6:07:41 PM
Y - Perched within close striking distance of its 52-week high and previously cited pivot point. Subsequent volume-driven gains for new highs may trigger a technical buy signal. Consolidating above its 50 DMA line ($64.75) after holding its ground stubbornly in recent weeks.
>>> FEATURED STOCK ARTICLE : Bank Stock Hovering Within Striking Distance of Prior High - 4/10/2018 |
View all notes |
Set NEW NOTE alert |
Company Profile |
SEC
News |
Chart |
Request a new note
C
A
S
I |
SIVB
-
NASDAQ
S V B Financial Group
BANKING - Regional - Pacific Banks
|
$257.37
|
-0.21
-0.08% |
$260.19
|
533,954
73.35% of 50 DAV
50 DAV is 728,000
|
$271.79
-5.31%
|
3/12/2018
|
$267.79
|
PP = $263.19
|
|
MB = $276.35
|
Most Recent Note - 4/25/2018 6:03:19 PM
Y - Due to report its financial results for the quarter ended March 31, 2018, on Thursday, April 26, 2018 after the close. Volume and volatility often increase near earnings news. Consolidating above its 50 DMA line ($250.71). Found support when recently sputtering near the prior low ($226.61 on 2/06/18). More damaging losses would raise greater concerns and trigger a worrisome technical sell signal.
>>> FEATURED STOCK ARTICLE : Rebounded Above its 50-Day Moving Average - 4/12/2018 |
View all notes |
Set NEW NOTE alert |
Company Profile |
SEC
News |
Chart |
Request a new note
C
A
S
I |
V
-
NYSE
Visa Inc Cl A
DIVERSIFIED SERVICES - Business/Management Services
|
$127.08
|
+5.87
4.84% |
$127.59
|
14,339,706
181.61% of 50 DAV
50 DAV is 7,896,000
|
$126.88
0.16%
|
4/26/2018
|
$126.68
|
PP = $126.98
|
|
MB = $133.33
|
 Most Recent Note - 4/26/2018 7:12:26 PM
Y - Finished strong after highlighted in yellow with pivot point cited based on its 1/29/18 high plus 10 cents in the earlier mid-day report. Reported earnings +29% on +13% sales revenues for the Mar '18 quarter, and 3 of the past 4 quarterly comparisons were above the +25% minimum earnings guideline (C criteria). See the latest FSU analysis for more details and a new annotated graph.
>>> FEATURED STOCK ARTICLE : Volume-Driven Gain For New High Triggered Technical Buy Signal - 4/26/2018 |
View all notes |
Set NEW NOTE alert |
Company Profile |
SEC
News |
Chart |
Request a new note
C
A
S
I |
TPL
-
NYSE
Texas Pacific Land Trust
FINANCIAL SERVICES - Diversified Investments
|
$542.00
|
+0.09
0.02% |
$556.88
|
10,959
84.30% of 50 DAV
50 DAV is 13,000
|
$569.99
-4.91%
|
4/13/2018
|
$547.85
|
PP = $552.10
|
|
MB = $579.71
|
Most Recent Note - 4/24/2018 1:09:19 PM
Y - Encountered distributional pressure on the prior session after challenging its all-time high. Recent gains lacked great volume conviction as it wedged up above the new pivot point cited based on its 2/28/18 high plus 10 cents. Gains above a stock's pivot point must have more than +40% above average volume to trigger a proper new (or add-on) technical buy signal. Very little resistance remains due to overhead supply up to the $569 level. The 50 DMA line defines near-term support to watch above the recent lows ($480).
>>> FEATURED STOCK ARTICLE : Perched Near Prior High After Showing Resilience - 4/20/2018 |
View all notes |
Set NEW NOTE alert |
Company Profile |
SEC
News |
Chart |
Request a new note
C
A
S
I |
LMAT
-
NASDAQ
Lemaitre Vascular Inc
Medical-Products
|
$32.36
|
-6.66
-17.06% |
$35.89
|
1,430,311
1,051.70% of 50 DAV
50 DAV is 136,000
|
$41.28
-21.62%
|
3/19/2018
|
$36.77
|
PP = $39.98
|
|
MB = $41.98
|
Most Recent Note - 4/26/2018 7:16:15 PM
G - Reported earnings +19% on +1% sales revenues for the Mar '18 quarter, below the +25% minimum guideline (C criteria) raising concerns. Gapped down today and suffered a damaging volume-driven loss violating its 50 and 200 DMA lines triggering technical sell signals. Color code is changed to green. A rebound above the 50 DMA line it needed for its outlook to improve.
>>> FEATURED STOCK ARTICLE : Gain With Heavy Volume Triggered Technical Buy Signal - 4/13/2018 |
View all notes |
Set NEW NOTE alert |
Company Profile |
SEC
News |
Chart |
Request a new note
C
A
S
I |
Symbol/Exchange
Company Name
Industry Group |
PRICE |
CHANGE
(%Change) |
Day High |
Volume
(% DAV)
(% 50 day avg vol) |
52 Wk Hi
% From Hi |
Featured
Date |
Price
Featured |
Pivot Featured |
|
Max Buy |
DPZ
-
NYSE
Dominos Pizza Inc
WHOLESALE - Food Wholesale
|
$250.61
|
+17.08
7.31% |
$255.00
|
1,708,107
192.14% of 50 DAV
50 DAV is 889,000
|
$243.81
2.79%
|
2/20/2018
|
$224.86
|
PP = $222.01
|
|
MB = $233.11
|
Most Recent Note - 4/26/2018 12:21:32 PM
G - Gapped up today hitting a new all-time high, getting more extended from the previously noted base. Reported earnings +59% on +26% sales revenues for the Mar '18 quarter, continuing its strong earnings track record. Its 50 DMA line and recent lows define near-term support to watch on pullbacks.
>>> FEATURED STOCK ARTICLE : Earnings News Due From Pizza Firm - 4/23/2018 |
View all notes |
Set NEW NOTE alert |
Company Profile |
SEC
News |
Chart |
Request a new note
C
A
S
I |
FIVE
-
NASDAQ
Five Below Inc
Retail-DiscountandVariety
|
$73.26
|
+0.61
0.84% |
$74.15
|
988,627
68.23% of 50 DAV
50 DAV is 1,449,000
|
$78.28
-6.41%
|
3/9/2018
|
$68.58
|
PP = $73.65
|
|
MB = $77.33
|
Most Recent Note - 4/24/2018 5:59:02 PM
Y - Fell for a 5th consecutive small loss on lighter volume since the noted "negative reversal" on 4/18/18 after hitting a new all-time high. Slumped near prior highs in the $73 area defining initial support above its 50 DMA line ($70.06). More damaging losses may raise concerns and trigger technical sell signals.
>>> FEATURED STOCK ARTICLE : Quietly Hovering Near All-Time High - 4/5/2018 |
View all notes |
Set NEW NOTE alert |
Company Profile |
SEC
News |
Chart |
Request a new note
C
A
S
I |
NVEE
-
NASDAQ
N V 5 Global Inc
Comml Svcs-Consulting
|
$58.20
|
-3.30
-5.37% |
$61.70
|
130,397
160.98% of 50 DAV
50 DAV is 81,000
|
$64.50
-9.77%
|
4/9/2018
|
$58.35
|
PP = $59.05
|
|
MB = $62.00
|
Most Recent Note - 4/26/2018 7:18:34 PM
Y - Color code is changed to yellow although a loss today on higher volume raised concerns while slumping below its pivot point and testing prior highs in the $58 area defining initial support.
>>> FEATURED STOCK ARTICLE : Perched Near High After 3 Strong Quarterly Comparisons - 4/9/2018 |
View all notes |
Set NEW NOTE alert |
Company Profile |
SEC
News |
Chart |
Request a new note
C
A
S
I |
QLYS
-
NASDAQ
Qualys Inc
Computer Sftwr-Security
|
$78.85
|
+1.65
2.14% |
$79.80
|
200,271
57.88% of 50 DAV
50 DAV is 346,000
|
$85.00
-7.24%
|
4/17/2018
|
$82.85
|
PP = $79.50
|
|
MB = $83.48
|
Most Recent Note - 4/25/2018 1:56:50 PM
Y - Color code is changed to yellow although now pulling back undercutting the prior high in the $79 area raising some concern. Today's 5th consecutive loss is testing its 50 DMA line ($75.80). Deterioration below the 50 DMA would raise concerns, and a violation of the prior low ($70.85 on 3/28/18) would trigger a more worrisome technical sell signal.
>>> FEATURED STOCK ARTICLE : Quickly Rallied More Than 5% Above Prior High - 4/18/2018 |
View all notes |
Set NEW NOTE alert |
Company Profile |
SEC
News |
Chart |
Request a new note
C
A
S
I |
SPLK
-
NASDAQ
Splunk Inc
Computer Sftwr-Database
|
$100.92
|
+3.28
3.36% |
$101.49
|
1,384,356
67.40% of 50 DAV
50 DAV is 2,054,000
|
$112.66
-10.42%
|
2/15/2018
|
$96.06
|
PP = $93.68
|
|
MB = $98.36
|
Most Recent Note - 4/25/2018 6:05:58 PM
G - Slumped below its 50 DMA line ($101.079) with a big loss today on +19% average volume doing more damage and triggering a technical sell signal. A subsequent loss on breach of the prior low ($94.39 on 4/04/18) would raise more serious concerns.
>>> FEATURED STOCK ARTICLE : Found Support Near 50-Day Average on Pullbacks - 4/19/2018 |
View all notes |
Set NEW NOTE alert |
Company Profile |
SEC
News |
Chart |
Request a new note
C
A
S
I |
Symbol/Exchange
Company Name
Industry Group |
PRICE |
CHANGE
(%Change) |
Day High |
Volume
(% DAV)
(% 50 day avg vol) |
52 Wk Hi
% From Hi |
Featured
Date |
Price
Featured |
Pivot Featured |
|
Max Buy |
SUPN
-
NASDAQ
Supernus Pharmaceuticals
Medical-Biomed/Biotech
|
$47.60
|
+0.25
0.53% |
$48.05
|
421,276
65.52% of 50 DAV
50 DAV is 643,000
|
$50.05
-4.89%
|
4/24/2018
|
$47.73
|
PP = $50.15
|
|
MB = $52.66
|
Most Recent Note - 4/24/2018 1:01:49 PM
Y - Color code is changed to yellow with pivot point cited based on its 9/18/17 high plus 10 cents. Hovering within close striking distance of its all-time high. Subsequent gains above the pivot point backed by at least +40% above average volume are needed to trigger a technical buy signal. Sales revenues increases were in the +30-47% range while three of the past 4 quarterly earnings comparisons through Dec '17 were above the +25% minimum guideline (C criteria). Showed strong earnings growth since FY '15 after years of losses.
>>> FEATURED STOCK ARTICLE : Pharmaceutical Firm Perched Near Record High - 4/24/2018 |
View all notes |
Set NEW NOTE alert |
Company Profile |
SEC
News |
Chart |
Request a new note
C
A
S
I |
PAYC
-
NYSE
Paycom Software Inc
COMPUTER SOFTWARE and SERVICES - Application Software
|
$113.40
|
+2.62
2.37% |
$114.21
|
447,524
64.76% of 50 DAV
50 DAV is 691,000
|
$118.45
-4.26%
|
2/15/2018
|
$95.01
|
PP = $93.61
|
|
MB = $98.29
|
Most Recent Note - 4/24/2018 5:43:48 PM
G - Pulled back from its all-time high with 4 consecutive losses on ever increasing volume. Its 50 DMA line ($106) and recent low ($101.55 on 4/04/18) define important near-term support to watch on pullbacks. Due to report earnings news on 5/01/18.
>>> FEATURED STOCK ARTICLE : Pulling Back After Negative Reversal at All-Time High Last Week - 4/4/2018 |
View all notes |
Set NEW NOTE alert |
Company Profile |
SEC
News |
Chart |
Request a new note
C
A
S
I |
GRUB
-
NYSE
Grubhub Inc
COMPUTER SOFTWARE and SERVICES - Technical and System Software
|
$98.53
|
+2.96
3.10% |
$99.16
|
856,516
54.00% of 50 DAV
50 DAV is 1,586,000
|
$112.41
-12.35%
|
6/21/2017
|
$47.33
|
PP = $46.94
|
|
MB = $49.29
|
Most Recent Note - 4/25/2018 12:56:12 PM
G - Big loss on the prior session violated the 50 DMA line ($101.42) triggering a technical sell signal. Today's weakness tested the recent low ($94.08 on 4/04/18) where further deterioration would raise more serious concerns.
>>> FEATURED STOCK ARTICLE : Very Extended and Enduring Distributional Pressure - 3/29/2018 |
View all notes |
Set NEW NOTE alert |
Company Profile |
SEC
News |
Chart |
Request a new note
C
A
S
I |
HQY
-
NASDAQ
Healthequity Inc
COMPUTER SOFTWARE and SERVICES - Healthcare Information Service
|
$66.50
|
+0.94
1.43% |
$66.71
|
282,037
38.90% of 50 DAV
50 DAV is 725,000
|
$68.75
-3.27%
|
2/20/2018
|
$56.37
|
PP = $55.41
|
|
MB = $58.18
|
Most Recent Note - 4/25/2018 5:58:26 PM
G - Volume totals have been cooling while hovering near its all-time high, possibly forming a short new flat base. Its 50 DMA line ($60.41) defines near term support above prior highs. See the latest FSU analysis for more details and a new annotated graph.
>>> FEATURED STOCK ARTICLE : Perched Near All-Time High Building a Short New Base - 4/25/2018 |
View all notes |
Set NEW NOTE alert |
Company Profile |
SEC
News |
Chart |
Request a new note
C
A
S
I |
LOB
-
NASDAQ
Live Oak Bancshares Inc
Banks-Southeast
|
$28.00
|
-0.55
-1.93% |
$29.90
|
151,495
114.77% of 50 DAV
50 DAV is 132,000
|
$30.05
-6.82%
|
3/16/2018
|
$28.63
|
PP = $28.30
|
|
MB = $29.72
|
Most Recent Note - 4/23/2018 6:29:55 PM
Y - Earnings news is due on 4/25/18. Quietly consolidating above its pivot point after testing its 50 DMA line ($27.76). Subsequent damaging losses would raise greater concerns.
>>> FEATURED STOCK ARTICLE : Tested Support at 50-Day Moving Average After Breakout - 4/16/2018 |
View all notes |
Set NEW NOTE alert |
Company Profile |
SEC
News |
Chart |
Request a new note
C
A
S
I |
Symbol/Exchange
Company Name
Industry Group |
PRICE |
CHANGE
(%Change) |
Day High |
Volume
(% DAV)
(% 50 day avg vol) |
52 Wk Hi
% From Hi |
Featured
Date |
Price
Featured |
Pivot Featured |
|
Max Buy |
PYPL
-
NASDAQ
Paypal Holdings Inc
Finance-CrdtCard/PmtPr
|
$76.03
|
+2.03
2.74% |
$77.62
|
13,606,794
167.82% of 50 DAV
50 DAV is 8,108,000
|
$86.32
-11.92%
|
2/1/2018
|
$80.35
|
PP = $79.49
|
|
MB = $83.46
|
Most Recent Note - 4/24/2018 6:07:47 PM
G - Slumped below its 50 DMA line ($78.20) with a big loss today raising concerns. Prior lows in the $71-72 area define important support. Due to report Mar '18 quarterly results on 4/25/18. Volume and volatility often increase near earnings news.
>>> FEATURED STOCK ARTICLE : Sputtering Below 50-Day Moving Average Again - 3/27/2018 |
View all notes |
Set NEW NOTE alert |
Company Profile |
SEC
News |
Chart |
Request a new note
C
A
S
I |
OLLI
-
NASDAQ
Ollie's Bargain Outlet
Retail-DiscountandVariety
|
$62.20
|
+1.30
2.13% |
$62.40
|
484,641
73.43% of 50 DAV
50 DAV is 660,000
|
$64.45
-3.49%
|
4/10/2018
|
$62.05
|
PP = $62.15
|
|
MB = $65.26
|
Most Recent Note - 4/23/2018 6:32:14 PM
Y - Stalled since it encountered distributional pressure and finished unchanged on 4/11/18 after hitting a new all-time high. Confirming gains above the pivot point backed by at least +40% above average volume are needed to trigger a proper technical buy signal.
>>> FEATURED STOCK ARTICLE : Encountered Distribution, Finished Below Pivot Point After Early Gain - 4/11/2018 |
View all notes |
Set NEW NOTE alert |
Company Profile |
SEC
News |
Chart |
Request a new note
C
A
S
I |
NOVT
-
NASDAQ
Novanta Inc
Elec-Scientific/Msrng
|
$59.60
|
-0.40
-0.67% |
$60.45
|
224,543
100.24% of 50 DAV
50 DAV is 224,000
|
$63.60
-6.29%
|
4/17/2018
|
$60.55
|
PP = $60.40
|
|
MB = $63.42
|
Most Recent Note - 4/25/2018 1:51:07 PM
Y - Pulling back today for a 3rd consecutive small loss on light or near average volume. Stalled after recently rallying to new highs with an impressive streak of volume-driven gains. Prior highs in the $58-60 area define initial support to watch above its 50 DMA line.
>>> FEATURED STOCK ARTICLE : Volume-Driven Gain Hit New All-Time High - 4/17/2018 |
View all notes |
Set NEW NOTE alert |
Company Profile |
SEC
News |
Chart |
Request a new note
C
A
S
I |
SEND
-
NYSE
Sendgrid Inc
INTERNET - Content
|
$28.98
|
+1.02
3.65% |
$29.16
|
205,098
53.97% of 50 DAV
50 DAV is 380,000
|
$32.03
-9.51%
|
3/6/2018
|
$28.00
|
PP = $28.37
|
|
MB = $29.79
|
Most Recent Note - 4/25/2018 6:00:34 PM
G - Retreated near its 50 DMA line ($27.53) with a big loss today on near average volume. Due to report earnings news on 5/01/18 after the close. Showing resilience after it priced a new Public Offering and Secondary Offering on 4/05/18.
>>> FEATURED STOCK ARTICLE : Slumped Into Prior Base Testing 50-Day Average - 4/3/2018 |
View all notes |
Set NEW NOTE alert |
Company Profile |
SEC
News |
Chart |
Request a new note
C
A
S
I |
|
|
|
THESE ARE NOT BUY RECOMMENDATIONS!
Comments contained in the body of this report are technical
opinions only. The material herein has been obtained
from sources believed to be reliable and accurate, however,
its accuracy and completeness cannot be guaranteed.
This site is not an investment advisor, hence it does
not endorse or recommend any securities or other investments.
Any recommendation contained in this report may not
be suitable for all investors and it is not to be deemed
an offer or solicitation on our part with respect to
the purchase or sale of any securities. All trademarks,
service marks and trade names appearing in this report
are the property of their respective owners, and are
likewise used for identification purposes only.
This report is a service available
only to active Paid Premium Members.
You may opt-out of receiving report notifications
at any time. Questions or comments may be submitted
by writing to Premium Membership Services 665 S.E. 10 Street, Suite 201 Deerfield Beach, FL 33441-5634 or by calling 1-800-965-8307
or 954-785-1121.
|
|
|

