You are not logged in.
This means you
CAN ONLY VIEW reports that were published prior to Wednesday, March 19, 2025.
You
MUST UPGRADE YOUR MEMBERSHIP if you want to see any current reports.
AFTER MARKET UPDATE - TUESDAY, APRIL 10TH, 2018
Previous After Market Report Next After Market Report >>>
|
|
|
|
DOW |
+428.90 |
24,408.00 |
+1.79% |
|
Volume |
886,763,730 |
+11% |
|
Volume |
2,232,856,560 |
+7% |
|
NASDAQ |
+143.96 |
7,094.30 |
+2.07% |
|
Advancers |
2,266 |
76% |
|
Advancers |
2,353 |
80% |
|
S&P 500 |
+43.71 |
2,656.87 |
+1.67% |
|
Decliners |
707 |
24% |
|
Decliners |
594 |
20% |
|
Russell 2000 |
+28.97 |
1,543.43 |
+1.91% |
|
52 Wk Highs |
51 |
|
|
52 Wk Highs |
61 |
|
|
S&P 600 |
+17.80 |
949.63 |
+1.91% |
|
52 Wk Lows |
29 |
|
|
52 Wk Lows |
28 |
|
|
 |
New Rally Gets Solid Follow-Through-Day of Big Gains
Kenneth J. Gruneisen - Passed the CAN SLIM® Master's Exam
Stocks closed firmly higher on Tuesday. The Dow jumped 428 points to 24408. The S&P 500 climbed 43 points to 2656 while the Nasdaq Composite added 143 points to 7094. The volume totals reported were higher than the prior session totals on the NYSE and on the Nasdaq exchange, indicative of greater institutional buying demand. Advancers solidly outnumbered decliners by nearly 4-1 on the Nasdaq exchange and by more than 3-1 on the NYSE. There were 19 high-ranked companies from the Leaders List that made new 52-week highs and were listed on the BreakOuts Page, versus the total of 5 on the prior session. Leadership improved as new 52-week higher totals outnumbered new 52-week lows totals on both the NYSE and the Nasdaq exchange. Tuesday's big gains for all three major indices (M criteria) came with higher volume totals coupled with more stocks hitting new highs. The strong action met the definition of a follow-through day on Day 6 of the rally effort. With the new confirmed rally, buying efforts are justified when all key criteria of the fact-based investment system are satisfied. The Featured Stocks Page provides the most timely analysis on high-ranked leaders. Charts used courtesy of www.stockcharts.com
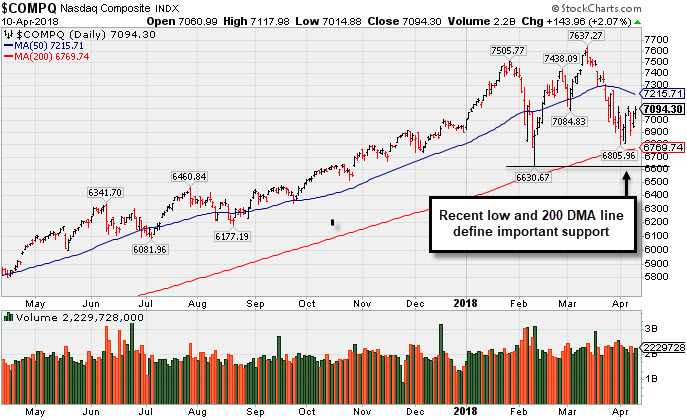 PICTURED: The Nasdaq Composite Index 200-day moving average (DMA) line and prior low define important near-term support. Technically, more damaging losses would signal for investors to reduce market exposure.
The major averages soared as trade tensions that heated up last week between the U.S and China appear to be easing. In a speech overnight at the Boao Forum, Chinese President Xi Jinping struck a perceived conciliatory tone as he spoke about opening up the Chinese economy. On the data front, the core Producer Price Index, excluding food and energy, rose 2.7% year-over-year in March, topping the prior month’s 2.5% gain. Separately, NFIB Small Business optimism cooled slightly in March.
Nine of 11 S&P 500 sectors closed higher. Energy shares paced gains as Exxon Mobil (XOM +2.94%) and Halliburton (HAL +4.85%) rose in sympathy with oil prices. Technology companies also outperformed as NVIDIA Corp (NVDA +5.80%) and Seagate Technology (STX +5.44%) rose after both firms were upgraded by analysts. Boeing (BA +3.83%) and Caterpillar (CAT +3.50%) were the two top performing stocks in the Dow.
Treasuries weakened with the yield on the benchmark 10-year note up two basis points to 2.80%. In commodities, NYMEX WTI crude climbed 3.7% to $65.77/barrel. COMEX Gold added 0.4% to $1342.00/ounce. |
 Kenneth J. Gruneisen started out as a licensed stockbroker in August 1987, a couple of months prior to the historic stock market crash that took the Dow Jones Industrial Average down -22.6% in a single day. He has published daily fact-based fundamental and technical analysis on high-ranked stocks online for two decades. Through FACTBASEDINVESTING.COM, Kenneth provides educational articles, news, market commentary, and other information regarding proven investment systems that work in good times and bad.
Comments contained in the body of this report are technical opinions only and are not necessarily those of Gruneisen Growth Corp. The material herein has been obtained from sources believed to be reliable and accurate, however, its accuracy and completeness cannot be guaranteed. Our firm, employees, and customers may effect transactions, including transactions contrary to any recommendation herein, or have positions in the securities mentioned herein or options with respect thereto. Any recommendation contained in this report may not be suitable for all investors and it is not to be deemed an offer or solicitation on our part with respect to the purchase or sale of any securities. |
|
 |
Tech, Retail, Financial, and Commodity-Linked Groups Rose
Kenneth J. Gruneisen - Passed the CAN SLIM® Master's Exam
On Tuesday the Broker/Dealer Index ($XBD +1.43%) and the Bank Index ($BKX +1.59%) rose along with the Retail Index ($RLX +1.72%). The major indices got a boost from strength in the tech sector too, with big gains for the Biotech Index ($BTK +2.46%), Semiconductor Index ($SOX +3.20%), and the Networking Index ($NWX +1.86%). The Oil Services Index ($OSX +5.41%) was a standout gainer while the Integrated Oil Index ($XOI +2.85%) and the Gold & Silver Index ($XAU +1.09%) also rose. Charts courtesy wwwstockcharts.com
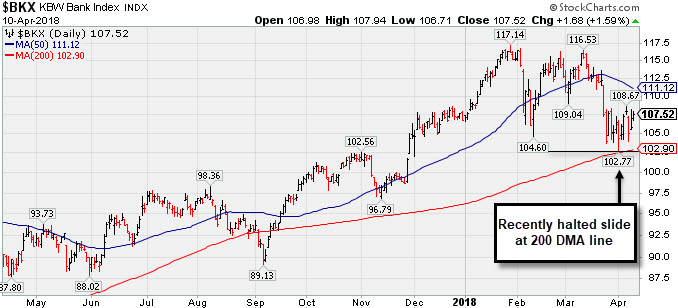 PICTURED: The Bank Index ($BKX +1.59%) recently halted its slide near its 200-day moving average (DMA) line. A rebound above the 50 DMA line still is needed for its outlook to improve.
| Oil Services |
$OSX |
143.68 |
+7.37 |
+5.41% |
-3.93% |
| Integrated Oil |
$XOI |
1,383.88 |
+38.37 |
+2.85% |
+3.62% |
| Semiconductor |
$SOX |
1,314.54 |
+40.74 |
+3.20% |
+4.91% |
| Networking |
$NWX |
532.56 |
+9.71 |
+1.86% |
+8.57% |
| Broker/Dealer |
$XBD |
285.04 |
+4.02 |
+1.43% |
+7.47% |
| Retail |
$RLX |
1,920.36 |
+32.46 |
+1.72% |
+10.76% |
| Gold & Silver |
$XAU |
81.94 |
+0.89 |
+1.10% |
-3.91% |
| Bank |
$BKX |
107.52 |
+1.68 |
+1.59% |
+0.76% |
| Biotech |
$BTK |
4,600.54 |
+110.54 |
+2.46% |
+8.96% |
|
|
|
 |
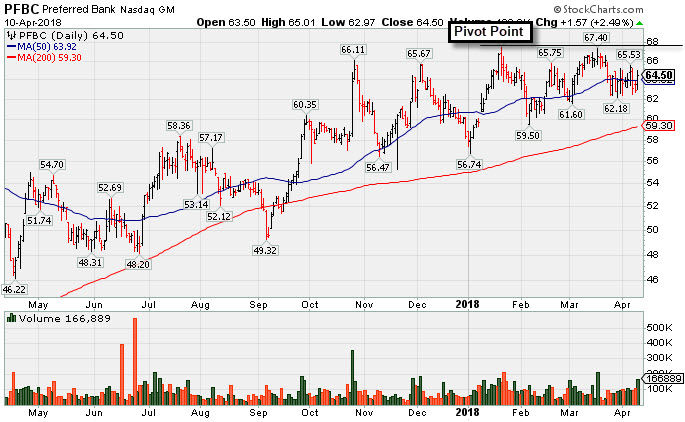
Bank Stock Hovering Within Striking Distance of Prior High
Kenneth J. Gruneisen - Passed the CAN SLIM® Master's Exam
Preferred Bank Los Angeles (PFBC +$1.57 or +2.49% to $64.50) was highlighted yellow with pivot point cited based on its 1/22/18 high plus 10 cents in the earlier mid-day report (read here). Subsequent volume-driven gains for new highs may trigger a technical buy signal.
It has been consolidating near its 50-day moving average (DMA) line ($64.12). It made gradual progress since dropped from the Featured Stocks list on 1/03/18. It was last shown in this FSU section on 12/28/17 with an annotated graph under the headline "Concerns Raised by Relative Strength and 50 DMA Line Breach".
Fundamentals through Dec '17 have remained strong. It reported earnings +33% on +23% sales revenues for the Dec '17 quarter, its 5th consecutive quarterly comparison above the +25% minimum guideline (C criteria). Its annual earnings (A criteria) history has been strong after a downturn in FY '12. PFBC was first highlighted in yellow with pivot point cited based on its 7/20/17 high plus 10 cents in the 10/10/17 mid-day report (read here).
It currently has a Timeliness rating of A and a Sponsorship rating of B. The number of top-rated funds owning its shares rose from 262 in Dec '16 to 299 in Dec '17, a reassuring sign concerning the I criteria. Its current Up/Down Volume Ratio of 1.5 is an unbiased indication its shares have been under accumulation over the past 50 days.
|
|
|
Color Codes Explained :
Y - Better candidates highlighted by our
staff of experts.
G - Previously featured
in past reports as yellow but may no longer be buyable under the
guidelines.
***Last / Change / Volume data in this table is the closing quote data***
Symbol/Exchange
Company Name
Industry Group |
PRICE |
CHANGE
(%Change) |
Day High |
Volume
(% DAV)
(% 50 day avg vol) |
52 Wk Hi
% From Hi |
Featured
Date |
Price
Featured |
Pivot Featured |
|
Max Buy |
PFBC
-
NASDAQ
Preferred Bank Los Angls
BANKING - Regional - Pacific Banks
|
$64.50
|
+1.57
2.49% |
$65.01
|
165,821
195.08% of 50 DAV
50 DAV is 85,000
|
$67.65
-4.66%
|
4/10/2018
|
$64.56
|
PP = $67.75
|
|
MB = $71.14
|
 Most Recent Note - 4/10/2018 1:13:30 PM
Y - Color code is changed to yellow with pivot point cited based on its 1/22/18 high plus 10 cents. Subsequent volume-driven gains for new highs may trigger a technical buy signal. Fundamentals through Dec '17 have remained strong. Consolidating near its 50 DMA line ($64.12). It made gradual progress since dropped from the Featured Stocks list on 1/03/18.
>>> FEATURED STOCK ARTICLE : Bank Stock Hovering Within Striking Distance of Prior High - 4/10/2018 |
View all notes |
Set NEW NOTE alert |
Company Profile |
SEC
News |
Chart |
Request a new note
C
A
S
I |
SIVB
-
NASDAQ
S V B Financial Group
BANKING - Regional - Pacific Banks
|
$245.66
|
+8.55
3.61% |
$246.62
|
659,369
89.71% of 50 DAV
50 DAV is 735,000
|
$271.79
-9.61%
|
3/12/2018
|
$267.79
|
PP = $263.19
|
|
MB = $276.35
|
Most Recent Note - 4/10/2018 5:39:21 PM
G - Found support when recently sputtering near the prior low ($226.61 on 2/06/18). A rebound above the downward sloping 50 DMA line ($249.25) is needed to help its outlook improve.
>>> FEATURED STOCK ARTICLE : Endured Distributional Pressure After Wedging Higher - 3/12/2018 |
View all notes |
Set NEW NOTE alert |
Company Profile |
SEC
News |
Chart |
Request a new note
C
A
S
I |
TPL
-
NYSE
Texas Pacific Land Trust
FINANCIAL SERVICES - Diversified Investments
|
$520.97
|
-0.37
-0.07% |
$526.16
|
15,667
111.91% of 50 DAV
50 DAV is 14,000
|
$569.99
-8.60%
|
2/20/2018
|
$517.00
|
PP = $569.99
|
|
MB = $598.49
|
Most Recent Note - 4/10/2018 5:40:43 PM
G - Rebounded above the 50 DMA line ($515.75) helping its outlook to improve. Recent lows ($480) define important support where damaging losses may trigger a worrisome technical sell signal.
>>> FEATURED STOCK ARTICLE : Slump Under 50-Day Average Line Hurt Near Term Outlook - 3/23/2018 |
View all notes |
Set NEW NOTE alert |
Company Profile |
SEC
News |
Chart |
Request a new note
C
A
S
I |
LMAT
-
NASDAQ
Lemaitre Vascular Inc
Medical-Products
|
$38.21
|
+0.01
0.03% |
$38.55
|
115,288
84.77% of 50 DAV
50 DAV is 136,000
|
$39.88
-4.19%
|
3/19/2018
|
$36.77
|
PP = $39.98
|
|
MB = $41.98
|
Most Recent Note - 4/4/2018 5:44:32 PM
Y - Posted a solid gain today with above average volume, rising within striking distance of the new pivot point cited based on its 10/20/17 high plus 10 cents. Subsequent volume-driven gains for new highs are needed to trigger a technical buy signal. Found support recently near its 50 DMA line ($35.56).
>>> FEATURED STOCK ARTICLE : Rebounding Near High After Choppy Consolidation - 3/19/2018 |
View all notes |
Set NEW NOTE alert |
Company Profile |
SEC
News |
Chart |
Request a new note
C
A
S
I |
DPZ
-
NYSE
Dominos Pizza Inc
WHOLESALE - Food Wholesale
|
$231.70
|
-0.73
-0.31% |
$234.67
|
437,217
44.25% of 50 DAV
50 DAV is 988,000
|
$236.93
-2.21%
|
2/20/2018
|
$224.86
|
PP = $222.01
|
|
MB = $233.11
|
Most Recent Note - 4/4/2018 10:03:47 AM
Y - Gapped down today. There was a "negative reversal" on 4/02/18 after touching a new all-time high. Stalled soon after highlighted in the 2/20/18 mid-day report with pivot point cited based on its 1/25/18 high plus 10 cents. Its 50 DMA line ($222) defines near-term support to watch.
>>> FEATURED STOCK ARTICLE : Popular Pizza Firm Perched Near All Time High - 3/21/2018 |
View all notes |
Set NEW NOTE alert |
Company Profile |
SEC
News |
Chart |
Request a new note
C
A
S
I |
Symbol/Exchange
Company Name
Industry Group |
PRICE |
CHANGE
(%Change) |
Day High |
Volume
(% DAV)
(% 50 day avg vol) |
52 Wk Hi
% From Hi |
Featured
Date |
Price
Featured |
Pivot Featured |
|
Max Buy |
FIVE
-
NASDAQ
Five Below Inc
Retail-DiscountandVariety
|
$74.09
|
+2.65
3.71% |
$74.35
|
1,393,436
117.39% of 50 DAV
50 DAV is 1,187,000
|
$73.86
0.31%
|
3/9/2018
|
$68.58
|
PP = $73.65
|
|
MB = $77.33
|
Most Recent Note - 4/10/2018 5:46:40 PM
Y - Hit a new all-time high with today's big gain backed by +18% above average volume. New pivot point recently was cited based on its 1/05/18 high plus 10 cents as it was noted. "Subsequent volume-driven gains above the pivot point may trigger a new (or add-on) technical buy signal." See the latest FSU analysis for more details and an annotated graph.
>>> FEATURED STOCK ARTICLE : Quietly Hovering Near All-Time High - 4/5/2018 |
View all notes |
Set NEW NOTE alert |
Company Profile |
SEC
News |
Chart |
Request a new note
C
A
S
I |
NVEE
-
NASDAQ
N V 5 Global Inc
Comml Svcs-Consulting
|
$58.88
|
+1.58
2.75% |
$59.65
|
124,511
161.70% of 50 DAV
50 DAV is 77,000
|
$58.95
-0.13%
|
4/9/2018
|
$58.35
|
PP = $59.05
|
|
MB = $62.00
|
Most Recent Note - 4/10/2018 5:53:20 PM
Y - Posted a 2nd consecutive gain today with above average volume and it hit a new high. Highlighted in yellow with new pivot point cited based on its 10/31/17 high plus 10 cents in the 4/09/18 mid-day report. Subsequent gains for a new all-time high backed by at least +40% above average volume may trigger a technical buy signal. See the latest FSU analysis for more details and an annotated graph.
>>> FEATURED STOCK ARTICLE : Perched Near High After 3 Strong Quarterly Comparisons - 4/9/2018 |
View all notes |
Set NEW NOTE alert |
Company Profile |
SEC
News |
Chart |
Request a new note
C
A
S
I |
SPLK
-
NASDAQ
Splunk Inc
Computer Sftwr-Database
|
$101.79
|
+3.78
3.86% |
$102.30
|
2,172,435
106.75% of 50 DAV
50 DAV is 2,035,000
|
$112.66
-9.65%
|
2/15/2018
|
$96.06
|
PP = $93.68
|
|
MB = $98.36
|
Most Recent Note - 4/10/2018 5:30:18 PM
G - Found prompt support near its 50 DMA ($97.93) line and the prior high in the $97 area. More damaging losses would raise greater concerns. It has not formed a sound base.
>>> FEATURED STOCK ARTICLE : Extended After Rallying from Secondary Buy Point - 3/20/2018 |
View all notes |
Set NEW NOTE alert |
Company Profile |
SEC
News |
Chart |
Request a new note
C
A
S
I |
PAYC
-
NYSE
Paycom Software Inc
COMPUTER SOFTWARE and SERVICES - Application Software
|
$111.04
|
+3.25
3.02% |
$111.57
|
435,924
56.69% of 50 DAV
50 DAV is 769,000
|
$115.48
-3.84%
|
2/15/2018
|
$95.01
|
PP = $93.61
|
|
MB = $98.29
|
Most Recent Note - 4/10/2018 5:44:14 PM
G - Its 50 DMA line ($100.78) defines near-term support above prior highs in the $93 area. Fundamentals remain strong.
>>> FEATURED STOCK ARTICLE : Pulling Back After Negative Reversal at All-Time High Last Week - 4/4/2018 |
View all notes |
Set NEW NOTE alert |
Company Profile |
SEC
News |
Chart |
Request a new note
C
A
S
I |
GRUB
-
NYSE
Grubhub Inc
COMPUTER SOFTWARE and SERVICES - Technical and System Software
|
$99.87
|
+2.79
2.87% |
$100.66
|
1,138,480
56.30% of 50 DAV
50 DAV is 2,022,000
|
$112.41
-11.16%
|
6/21/2017
|
$47.33
|
PP = $46.94
|
|
MB = $49.29
|
Most Recent Note - 4/10/2018 5:42:47 PM
G - Found support at its 50 DMA line ($96.06) recently. More damaging losses below the 50 DMA line and recent low ($94.08 on 4/04/18) would raise greater concerns.
>>> FEATURED STOCK ARTICLE : Very Extended and Enduring Distributional Pressure - 3/29/2018 |
View all notes |
Set NEW NOTE alert |
Company Profile |
SEC
News |
Chart |
Request a new note
C
A
S
I |
Symbol/Exchange
Company Name
Industry Group |
PRICE |
CHANGE
(%Change) |
Day High |
Volume
(% DAV)
(% 50 day avg vol) |
52 Wk Hi
% From Hi |
Featured
Date |
Price
Featured |
Pivot Featured |
|
Max Buy |
HQY
-
NASDAQ
Healthequity Inc
COMPUTER SOFTWARE and SERVICES - Healthcare Information Service
|
$63.83
|
+0.76
1.21% |
$64.01
|
293,327
37.65% of 50 DAV
50 DAV is 779,000
|
$68.75
-7.16%
|
2/20/2018
|
$56.37
|
PP = $55.41
|
|
MB = $58.18
|
Most Recent Note - 4/10/2018 5:37:17 PM
G - Volume totals have been cooling while still hovering near its all-time high, extended from any sound base. Its 50 DMA line ($57.30) defines near term support above prior highs.
>>> FEATURED STOCK ARTICLE : Bullish Action Followed Latest Earnings Report - 3/22/2018 |
View all notes |
Set NEW NOTE alert |
Company Profile |
SEC
News |
Chart |
Request a new note
C
A
S
I |
LOB
-
NASDAQ
Live Oak Bancshares Inc
Banks-Southeast
|
$28.90
|
+0.30
1.05% |
$29.00
|
57,869
40.19% of 50 DAV
50 DAV is 144,000
|
$30.05
-3.83%
|
3/16/2018
|
$28.63
|
PP = $28.30
|
|
MB = $29.72
|
Most Recent Note - 4/5/2018 5:10:05 PM
Y - Posted a 3rd consecutive gain today with +25% above average volume, rising above its pivot point. After testing its 50 DMA line ($27.24) any more damaging losses would raise greater concerns.
>>> FEATURED STOCK ARTICLE : Tallied Volume-Driven Gain for New High - 3/16/2018 |
View all notes |
Set NEW NOTE alert |
Company Profile |
SEC
News |
Chart |
Request a new note
C
A
S
I |
PYPL
-
NASDAQ
Paypal Holdings Inc
Finance-CrdtCard/PmtPr
|
$76.79
|
+1.60
2.13% |
$77.31
|
5,843,028
55.94% of 50 DAV
50 DAV is 10,445,000
|
$86.32
-11.04%
|
2/1/2018
|
$80.35
|
PP = $79.49
|
|
MB = $83.46
|
Most Recent Note - 4/5/2018 5:08:17 PM
G - Gapped up today, however a rebound above its 50 DMA line ($78.75) is still needed for its outlook to improve. Halted its slide above the prior low ($71.63 on 2/09/18) which defines the next important support level.
>>> FEATURED STOCK ARTICLE : Sputtering Below 50-Day Moving Average Again - 3/27/2018 |
View all notes |
Set NEW NOTE alert |
Company Profile |
SEC
News |
Chart |
Request a new note
C
A
S
I |
OLLI
-
NASDAQ
Ollie's Bargain Outlet
Retail-DiscountandVariety
|
$62.05
|
+2.05
3.42% |
$62.55
|
1,020,820
165.99% of 50 DAV
50 DAV is 615,000
|
$62.05
0.00%
|
4/10/2018
|
$62.05
|
PP = $62.15
|
|
MB = $65.26
|
Most Recent Note - 4/10/2018 5:50:40 PM
Y - Posted a big gain for a new high backed by +66% above average volume. Color code is changed to yellow and new pivot point cited based on its 3/06/18 high. Found prompt support after undercutting its 50 DMA line ($58.19) and nearly testing the prior low ($54.44 on 3/09/18). Reported earnings +31% on +26% sales revenues for the Jan '18 quarter, continuing its strong earnings track record.
>>> FEATURED STOCK ARTICLE : Bargain Outlet's Shares Perched Near All-Time Price High - 3/13/2018 |
View all notes |
Set NEW NOTE alert |
Company Profile |
SEC
News |
Chart |
Request a new note
C
A
S
I |
WB
-
NASDAQ
Weibo Corp Cl A Ads
INTERNET - Content
|
$123.57
|
+6.43
5.49% |
$124.97
|
2,161,795
106.49% of 50 DAV
50 DAV is 2,030,000
|
$142.12
-13.05%
|
1/16/2018
|
$126.33
|
PP = $122.21
|
|
MB = $128.32
|
Most Recent Note - 4/10/2018 5:35:02 PM
G - Stayed well above the 200 DMA line. It has rebounded toward its 50 DMA line ($127.30), but gains above that short-term average are still needed for its outlook to improve. See the latest FSU analysis for more details and an annotated graph.
>>> FEATURED STOCK ARTICLE : Quietly Slumping Near Prior Low - 4/6/2018 |
View all notes |
Set NEW NOTE alert |
Company Profile |
SEC
News |
Chart |
Request a new note
C
A
S
I |
Symbol/Exchange
Company Name
Industry Group |
PRICE |
CHANGE
(%Change) |
Day High |
Volume
(% DAV)
(% 50 day avg vol) |
52 Wk Hi
% From Hi |
Featured
Date |
Price
Featured |
Pivot Featured |
|
Max Buy |
SQ
-
NYSE
Square Inc Cl A
Finance-CrdtCard/PmtPr
|
$47.80
|
+1.91
4.16% |
$47.88
|
8,658,452
58.18% of 50 DAV
50 DAV is 14,882,000
|
$58.46
-18.23%
|
3/5/2018
|
$49.70
|
PP = $49.66
|
|
MB = $52.14
|
Most Recent Note - 4/10/2018 5:32:06 PM
G - Quietly rebounded above the 50 DMA line ($47.67) today helping its outlook improve. It has not formed a sound base.
>>> FEATURED STOCK ARTICLE : Slumped Back Into Prior Base Testing 50-Day Average - 4/2/2018 |
View all notes |
Set NEW NOTE alert |
Company Profile |
SEC
News |
Chart |
Request a new note
C
A
S
I |
SEND
-
NYSE
Sendgrid Inc
INTERNET - Content
|
$26.12
|
+1.43
5.79% |
$26.22
|
384,167
114.34% of 50 DAV
50 DAV is 336,000
|
$32.03
-18.44%
|
3/6/2018
|
$28.00
|
PP = $28.37
|
|
MB = $29.79
|
Most Recent Note - 4/10/2018 5:27:26 PM
G - Rebounded near its 50 DMA line ($26.33) with a big gain today on average volume. Priced a new Public Offering and Secondary Offering on 4/05/18.
>>> FEATURED STOCK ARTICLE : Slumped Into Prior Base Testing 50-Day Average - 4/3/2018 |
View all notes |
Set NEW NOTE alert |
Company Profile |
SEC
News |
Chart |
Request a new note
C
A
S
I |
|
|
|
THESE ARE NOT BUY RECOMMENDATIONS!
Comments contained in the body of this report are technical
opinions only. The material herein has been obtained
from sources believed to be reliable and accurate, however,
its accuracy and completeness cannot be guaranteed.
This site is not an investment advisor, hence it does
not endorse or recommend any securities or other investments.
Any recommendation contained in this report may not
be suitable for all investors and it is not to be deemed
an offer or solicitation on our part with respect to
the purchase or sale of any securities. All trademarks,
service marks and trade names appearing in this report
are the property of their respective owners, and are
likewise used for identification purposes only.
This report is a service available
only to active Paid Premium Members.
You may opt-out of receiving report notifications
at any time. Questions or comments may be submitted
by writing to Premium Membership Services 665 S.E. 10 Street, Suite 201 Deerfield Beach, FL 33441-5634 or by calling 1-800-965-8307
or 954-785-1121.
|
|
|