You are not logged in.
This means you
CAN ONLY VIEW reports that were published prior to Wednesday, March 19, 2025.
You
MUST UPGRADE YOUR MEMBERSHIP if you want to see any current reports.
AFTER MARKET UPDATE - WEDNESDAY, APRIL 18TH, 2018
Previous After Market Report Next After Market Report >>>
|
|
|
|
DOW |
-38.56 |
24,748.07 |
-0.16% |
|
Volume |
770,195,110 |
+7% |
|
Volume |
1,892,462,786 |
-2% |
|
NASDAQ |
+14.14 |
7,295.24 |
+0.19% |
|
Advancers |
1,626 |
55% |
|
Advancers |
1,508 |
52% |
|
S&P 500 |
+2.25 |
2,708.64 |
+0.08% |
|
Decliners |
1,309 |
45% |
|
Decliners |
1,386 |
48% |
|
Russell 2000 |
+3.76 |
1,583.56 |
+0.24% |
|
52 Wk Highs |
150 |
|
|
52 Wk Highs |
124 |
|
|
S&P 600 |
+2.91 |
975.10 |
+0.30% |
|
52 Wk Lows |
55 |
|
|
52 Wk Lows |
30 |
|
|
 |
Major Indices Were Mixed as Earnings News Rolled In
Kenneth J. Gruneisen - Passed the CAN SLIM® Master's Exam
Stocks were mostly higher Wednesday. The Dow fell 38 points to 24748. The S&P 500 climbed 2 points to 2708 and the Nasdaq Composite advanced 14 points to 7295. The volume totals reported were mixed, higher than the prior session total on the NYSE and lower on the Nasdaq exchange. Advancers led decliners by a narrow margin on the NYSE and on the Nasdaq exchange. There were 67 high-ranked companies from the Leaders List that made new 52-week highs and were listed on the BreakOuts Page, just above the total of 66 on the prior session. New 52-week highs outnumbered new 52-week lows totals on both the Nasdaq exchange and the NYSE. Last Tuesday's big gains for all three major indices (M criteria) came with higher volume totals coupled with more stocks hitting new highs. The strong action met the definition of a follow-through day on Day 6 of the rally effort. With the new confirmed rally, buying efforts are justified when all key criteria of the fact-based investment system are satisfied. The Featured Stocks Page provides the most timely analysis on high-ranked leaders. Charts used courtesy of www.stockcharts.com
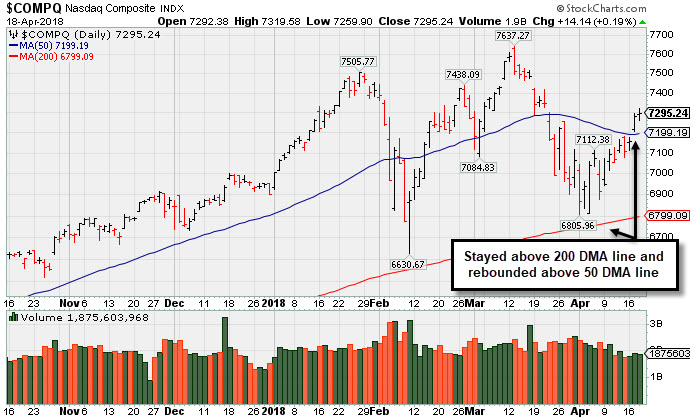 PICTURED: The Nasdaq Composite Index has rebounded above its 50-day moving average (DMA) line, along with the other major averages, helping the market outlook improve. The 200 DMA line and prior low define important near-term support.
The major averages traded in a narrow range on Wednesday amid a flurry of corporate earnings reports. On the data front, a report this morning showed weekly mortgage applications jumped 4.9% in the most recent week. In Fed news, the Beige Book revealed economic growth remained at a “modest to moderate pace”. However, the release also stated tariffs and global trade disputes have to potential to negatively impact future growth.
Six of 11 S&P 500 sectors finished lower. Energy shares were up the most in sympathy with oil prices. Industrials also outperformed as CSX Corp (CSX +7.85%) hit a new record high, and United Continental (UAL +4.81%) rose, after both firms topped earnings estimates. In Financials, Morgan Stanley (MS +0.04%) was little changed after revealing a record profit in the first quarter. Shares of Intuitive Surgical (ISRG +8.17%) as its profits topped forecasts. IBM (IBM -7.53%) gapped down and was a notable decliner after providing disappointing forward guidance.
Treasuries finished lower with the yield on the benchmark 10-year note up five basis points to 2.87%. In commodities, WTI crude climbed 3.5% to $68.87/barrel, its highest level in three years. COMEX gold added 0.3% to $1351.20/ounce. |
 Kenneth J. Gruneisen started out as a licensed stockbroker in August 1987, a couple of months prior to the historic stock market crash that took the Dow Jones Industrial Average down -22.6% in a single day. He has published daily fact-based fundamental and technical analysis on high-ranked stocks online for two decades. Through FACTBASEDINVESTING.COM, Kenneth provides educational articles, news, market commentary, and other information regarding proven investment systems that work in good times and bad.
Comments contained in the body of this report are technical opinions only and are not necessarily those of Gruneisen Growth Corp. The material herein has been obtained from sources believed to be reliable and accurate, however, its accuracy and completeness cannot be guaranteed. Our firm, employees, and customers may effect transactions, including transactions contrary to any recommendation herein, or have positions in the securities mentioned herein or options with respect thereto. Any recommendation contained in this report may not be suitable for all investors and it is not to be deemed an offer or solicitation on our part with respect to the purchase or sale of any securities. |
|
 |
Commodity-Linked Groups and Retail Index Rose
Kenneth J. Gruneisen - Passed the CAN SLIM® Master's Exam
On Wednesday commodity-linked groups had a positive bias as the Gold & Silver Index ($XAU +1.19%), Integrated Oil Index ($XOI +1.65%), and the Oil Services Index ($OSX +2.87%) rose. The Retail Index ($RLX +1.16%) was also among the gainers, meanwhile the Broker/Dealer Index ($XBD -0.41%) and the Bank Index ($BKX -0.55%) both fell. The Semiconductor Index ($SOX -1.03%) fell as the Networking Index ($NWX +0.08%) and Biotech Index ($BTK -0.10%) both finished flat. Charts courtesy wwwstockcharts.com
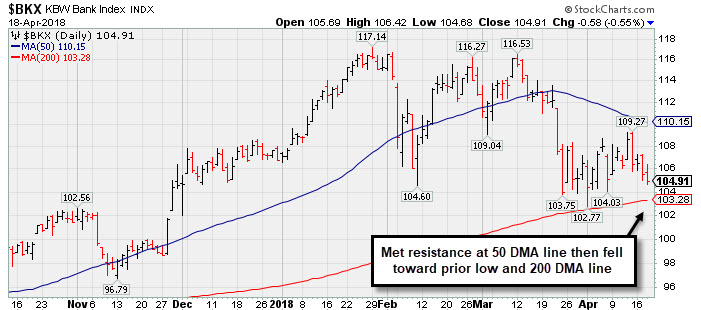 PICTURED: The Bank Index ($BKX -0.55%) met resistance when rebounding near its 50-day moving average (DMA) line, then has slumped toward its prior low and 200 DMA line. Subsequent damaging losses below the 200 DMA line would be an ominous sign for the overall market outlook, since financial groups have proven to be reliable leading indicators.
| Oil Services |
$OSX |
154.83 |
+4.31 |
+2.86% |
+3.53% |
| Integrated Oil |
$XOI |
1,461.56 |
+23.66 |
+1.65% |
+9.44% |
| Semiconductor |
$SOX |
1,343.78 |
-13.94 |
-1.03% |
+7.24% |
| Networking |
$NWX |
552.58 |
+0.42 |
+0.08% |
+12.65% |
| Broker/Dealer |
$XBD |
289.54 |
-1.18 |
-0.41% |
+9.16% |
| Retail |
$RLX |
2,008.13 |
+22.99 |
+1.16% |
+15.82% |
| Gold & Silver |
$XAU |
85.21 |
+1.00 |
+1.19% |
-0.07% |
| Bank |
$BKX |
104.91 |
-0.58 |
-0.55% |
-1.69% |
| Biotech |
$BTK |
4,661.47 |
-4.77 |
-0.10% |
+10.40% |
|
|
|
 |
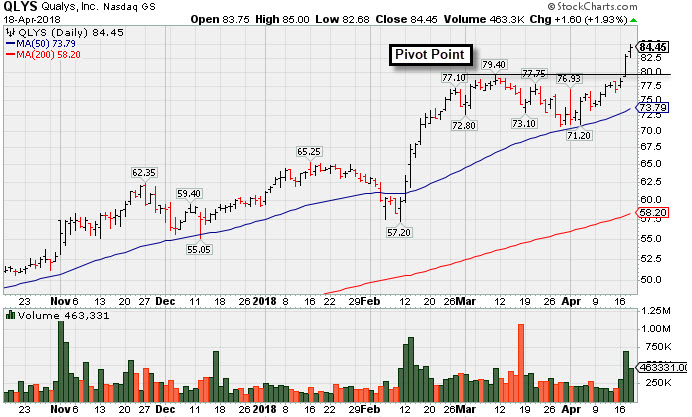
Quickly Rallied More Than 5% Above Prior High
Kenneth J. Gruneisen - Passed the CAN SLIM® Master's Exam
Qualys Inc (QLYS +$1.60 or +1.93% to $84.45) quickly rose above its "max buy" level, getting extended from the prior base, and its color code was changed to green. It finished strong after highlighted in yellow with pivot point cited based on its 3/09/18 high plus 10 cents in the 4/17/18 mid-day report (read here). It hit a new all-time high (N criteria) with a considerable gap up and gain backed by +108% above average volume, rising from a "late stage" base. It found support at its 50-day moving average (DMA) line as it formed a flat base pattern. Recently it reported Dec '17 earnings +39% on +20% sales revenues, its 3rd consecutive quarter above the +25% minimum earnings guideline (C criteria). Annual earnings history (A criteria) has been strong. It went through a deep consolidation since dropped from the Featured Stocks list on 5/06/15. QLYS was last shown in this FSU section on 4/29/15 with annotated graphs under the headline, "Quiet Consolidation Within 5% of Prior Pivot Point". The number of top-rated funds owning its shares rose from 294 in Jun '17 to 354 in Mar '18, a reassuring sign concerning the I criteria. Its small supply of only 30.5 million shares (S criteria) in the public float can contribute to great volatility in the event of institutional buying or selling. The Computer Software - Security group has a 95 Group Relative Strength Rating, and leadership (L criteria) in the industry group is another favorable factor with respect to the fact-based investment system. |
|
|
Color Codes Explained :
Y - Better candidates highlighted by our
staff of experts.
G - Previously featured
in past reports as yellow but may no longer be buyable under the
guidelines.
***Last / Change / Volume data in this table is the closing quote data***
Symbol/Exchange
Company Name
Industry Group |
PRICE |
CHANGE
(%Change) |
Day High |
Volume
(% DAV)
(% 50 day avg vol) |
52 Wk Hi
% From Hi |
Featured
Date |
Price
Featured |
Pivot Featured |
|
Max Buy |
PFBC
-
NASDAQ
Preferred Bank Los Angls
BANKING - Regional - Pacific Banks
|
$65.26
|
-0.11
-0.17% |
$65.75
|
72,345
87.16% of 50 DAV
50 DAV is 83,000
|
$67.65
-3.53%
|
4/10/2018
|
$64.56
|
PP = $67.75
|
|
MB = $71.14
|
Most Recent Note - 4/16/2018 1:00:46 PM
Y - Quietly consolidating near its 50 DMA line ($64.13), holding its ground within striking distance of the new pivot point cited based on its 1/22/18 high plus 10 cents. Subsequent volume-driven gains for new highs may trigger a technical buy signal. Due to report results for the first quarter ended March 31, 2018 after the close of the market on Thursday, April 19, 2018. Volume and volatility often increase near earnings news.
>>> FEATURED STOCK ARTICLE : Bank Stock Hovering Within Striking Distance of Prior High - 4/10/2018 |
View all notes |
Set NEW NOTE alert |
Company Profile |
SEC
News |
Chart |
Request a new note
C
A
S
I |
SIVB
-
NASDAQ
S V B Financial Group
BANKING - Regional - Pacific Banks
|
$242.72
|
-1.89
-0.77% |
$247.00
|
575,849
78.56% of 50 DAV
50 DAV is 733,000
|
$271.79
-10.70%
|
3/12/2018
|
$267.79
|
PP = $263.19
|
|
MB = $276.35
|
Most Recent Note - 4/12/2018 5:15:48 PM
Y - Color code is changed to yellow after rebounding above the downward sloping 50 DMA line ($249.19) helping its outlook improve. Found support when recently sputtering near the prior low ($226.61 on 2/06/18). See the latest FSU analysis for more details and a new annotated graph.
>>> FEATURED STOCK ARTICLE : Rebounded Above its 50-Day Moving Average - 4/12/2018 |
View all notes |
Set NEW NOTE alert |
Company Profile |
SEC
News |
Chart |
Request a new note
C
A
S
I |
TPL
-
NYSE
Texas Pacific Land Trust
FINANCIAL SERVICES - Diversified Investments
|
$544.71
|
+9.70
1.81% |
$547.36
|
12,802
91.44% of 50 DAV
50 DAV is 14,000
|
$569.99
-4.44%
|
4/13/2018
|
$547.85
|
PP = $552.10
|
|
MB = $579.71
|
Most Recent Note - 4/13/2018 1:14:03 PM
Y - Color code is changed to yellow with new pivot point cited based on its 2/28/18 high plus 10 cents. Subsequent gains above the pivot point with more than+40% above average volume may trigger a new (or add-on) technical buy signal. Very little resistance remains due to overhead supply up to the $569 level. Recent lows ($480) define important support where damaging losses may trigger a worrisome technical sell signal.
>>> FEATURED STOCK ARTICLE : Slump Under 50-Day Average Line Hurt Near Term Outlook - 3/23/2018 |
View all notes |
Set NEW NOTE alert |
Company Profile |
SEC
News |
Chart |
Request a new note
C
A
S
I |
LMAT
-
NASDAQ
Lemaitre Vascular Inc
Medical-Products
|
$40.72
|
-0.03
-0.07% |
$41.25
|
90,329
65.46% of 50 DAV
50 DAV is 138,000
|
$41.19
-1.15%
|
3/19/2018
|
$36.77
|
PP = $39.98
|
|
MB = $41.98
|
Most Recent Note - 4/16/2018 5:49:40 PM
Y - Posted a gain on light volume today for a new all-time high. Triggered a technical buy signal as it posted a solid gain on 4/11/18 with +87% above average volume, rising above the new pivot point cited based on its 10/20/17 high plus 10 cents. Found support recently near its 50 DMA line ($36.28). See the latest FSU analysis for more details and an annotated graph.
>>> FEATURED STOCK ARTICLE : Gain With Heavy Volume Triggered Technical Buy Signal - 4/13/2018 |
View all notes |
Set NEW NOTE alert |
Company Profile |
SEC
News |
Chart |
Request a new note
C
A
S
I |
DPZ
-
NYSE
Dominos Pizza Inc
WHOLESALE - Food Wholesale
|
$238.19
|
+1.03
0.43% |
$239.21
|
394,434
41.43% of 50 DAV
50 DAV is 952,000
|
$238.92
-0.31%
|
2/20/2018
|
$224.86
|
PP = $222.01
|
|
MB = $233.11
|
Most Recent Note - 4/16/2018 12:41:59 PM
Y - Volume totals have been cooling in recent weeks while hovering in a tight trading range near its all-time high. Made limited headway since highlighted in the 2/20/18 mid-day report with pivot point cited based on its 1/25/18 high plus 10 cents. Its 50 DMA line ($224.48) defines near-term support to watch.
>>> FEATURED STOCK ARTICLE : Popular Pizza Firm Perched Near All Time High - 3/21/2018 |
View all notes |
Set NEW NOTE alert |
Company Profile |
SEC
News |
Chart |
Request a new note
C
A
S
I |
Symbol/Exchange
Company Name
Industry Group |
PRICE |
CHANGE
(%Change) |
Day High |
Volume
(% DAV)
(% 50 day avg vol) |
52 Wk Hi
% From Hi |
Featured
Date |
Price
Featured |
Pivot Featured |
|
Max Buy |
FIVE
-
NASDAQ
Five Below Inc
Retail-DiscountandVariety
|
$76.06
|
-0.79
-1.03% |
$78.28
|
8,676,564
702.56% of 50 DAV
50 DAV is 1,235,000
|
$77.30
-1.60%
|
3/9/2018
|
$68.58
|
PP = $73.65
|
|
MB = $77.33
|
 Most Recent Note - 4/18/2018 5:37:37 PM
Y - There was a "negative reversal" today for a loss on heavy volume after briefly trading above its "max buy" level and hitting a new all-time high. Prior highs in the $73 area define initial support to watch on pullbacks.
>>> FEATURED STOCK ARTICLE : Quietly Hovering Near All-Time High - 4/5/2018 |
View all notes |
Set NEW NOTE alert |
Company Profile |
SEC
News |
Chart |
Request a new note
C
A
S
I |
NVEE
-
NASDAQ
N V 5 Global Inc
Comml Svcs-Consulting
|
$63.35
|
+1.50
2.43% |
$63.45
|
98,823
120.52% of 50 DAV
50 DAV is 82,000
|
$64.50
-1.78%
|
4/9/2018
|
$58.35
|
PP = $59.05
|
|
MB = $62.00
|
Most Recent Note - 4/16/2018 3:12:05 PM
G - Color code is changed to green after gapping up and rising above its "max buy" level with today's big gain. Prior highs in the $58 area define initial support to watch on pullbacks. Hit a new all-time high with +95% above average volume behind its considerable 4/12/18 gain above the pivot point triggering a technical buy signal.
>>> FEATURED STOCK ARTICLE : Perched Near High After 3 Strong Quarterly Comparisons - 4/9/2018 |
View all notes |
Set NEW NOTE alert |
Company Profile |
SEC
News |
Chart |
Request a new note
C
A
S
I |
QLYS
-
NASDAQ
Qualys Inc
Computer Sftwr-Security
|
$84.45
|
+1.60
1.93% |
$85.00
|
460,491
135.04% of 50 DAV
50 DAV is 341,000
|
$83.30
1.38%
|
4/17/2018
|
$82.85
|
PP = $79.50
|
|
MB = $83.48
|
Most Recent Note - 4/18/2018 5:34:04 PM
G - Color code was changed to green after quickly rising above its "max buy" level. Prior high in the $79 area defines initial support to watch on pullbacks. See the latest FSU analysis for more details and an annotated graph.
>>> FEATURED STOCK ARTICLE : Quickly Rallied More Than 5% Above Prior High - 4/18/2018 |
View all notes |
Set NEW NOTE alert |
Company Profile |
SEC
News |
Chart |
Request a new note
C
A
S
I |
SPLK
-
NASDAQ
Splunk Inc
Computer Sftwr-Database
|
$106.80
|
-0.78
-0.73% |
$107.78
|
1,116,887
52.91% of 50 DAV
50 DAV is 2,111,000
|
$112.66
-5.20%
|
2/15/2018
|
$96.06
|
PP = $93.68
|
|
MB = $98.36
|
Most Recent Note - 4/17/2018 7:28:40 PM
G - Posted a big gain today with lighter volume. recently found support near its 50 DMA ($99.25) line and prior high in the $97 area. More damaging losses would raise greater concerns. It has not formed a sound base.
>>> FEATURED STOCK ARTICLE : Extended After Rallying from Secondary Buy Point - 3/20/2018 |
View all notes |
Set NEW NOTE alert |
Company Profile |
SEC
News |
Chart |
Request a new note
C
A
S
I |
PAYC
-
NYSE
Paycom Software Inc
COMPUTER SOFTWARE and SERVICES - Application Software
|
$117.62
|
+1.59
1.37% |
$118.45
|
678,554
88.47% of 50 DAV
50 DAV is 767,000
|
$117.00
0.53%
|
2/15/2018
|
$95.01
|
PP = $93.61
|
|
MB = $98.29
|
Most Recent Note - 4/17/2018 1:01:04 PM
G - Hitting a new all-time high today after a brief consolidation. Its 50 DMA line ($102.92) and recent low ($101.55 on 4/04/18) define important near-term support to watch on pullbacks.
>>> FEATURED STOCK ARTICLE : Pulling Back After Negative Reversal at All-Time High Last Week - 4/4/2018 |
View all notes |
Set NEW NOTE alert |
Company Profile |
SEC
News |
Chart |
Request a new note
C
A
S
I |
Symbol/Exchange
Company Name
Industry Group |
PRICE |
CHANGE
(%Change) |
Day High |
Volume
(% DAV)
(% 50 day avg vol) |
52 Wk Hi
% From Hi |
Featured
Date |
Price
Featured |
Pivot Featured |
|
Max Buy |
GRUB
-
NYSE
Grubhub Inc
COMPUTER SOFTWARE and SERVICES - Technical and System Software
|
$103.07
|
-0.65
-0.63% |
$104.24
|
1,518,405
77.12% of 50 DAV
50 DAV is 1,969,000
|
$112.41
-8.31%
|
6/21/2017
|
$47.33
|
PP = $46.94
|
|
MB = $49.29
|
Most Recent Note - 4/17/2018 12:42:56 PM
G - Rallying today after finding support at its 50 DMA line ($98.75) in recent weeks. Subsequent losses below the 50 DMA line and recent low ($94.08 on 4/04/18) would raise more serious concerns and trigger technical sell signals.
>>> FEATURED STOCK ARTICLE : Very Extended and Enduring Distributional Pressure - 3/29/2018 |
View all notes |
Set NEW NOTE alert |
Company Profile |
SEC
News |
Chart |
Request a new note
C
A
S
I |
HQY
-
NASDAQ
Healthequity Inc
COMPUTER SOFTWARE and SERVICES - Healthcare Information Service
|
$66.09
|
+0.18
0.27% |
$66.64
|
408,698
52.00% of 50 DAV
50 DAV is 786,000
|
$68.75
-3.87%
|
2/20/2018
|
$56.37
|
PP = $55.41
|
|
MB = $58.18
|
Most Recent Note - 4/16/2018 12:49:40 PM
G - Volume totals have been cooling in recent weeks while hovering near its all-time high. It is extended from any sound base. Its 50 DMA line ($58.33) defines near term support above prior highs.
>>> FEATURED STOCK ARTICLE : Bullish Action Followed Latest Earnings Report - 3/22/2018 |
View all notes |
Set NEW NOTE alert |
Company Profile |
SEC
News |
Chart |
Request a new note
C
A
S
I |
LOB
-
NASDAQ
Live Oak Bancshares Inc
Banks-Southeast
|
$28.40
|
+0.10
0.35% |
$28.65
|
91,958
67.62% of 50 DAV
50 DAV is 136,000
|
$30.05
-5.49%
|
3/16/2018
|
$28.63
|
PP = $28.30
|
|
MB = $29.72
|
Most Recent Note - 4/16/2018 5:47:18 PM
Y - Quietly consolidating above its pivot point after testing its 50 DMA line ($27.56). Subsequent damaging losses would raise greater concerns. See the latest FSU analysis for more details and a new annotated graph.
>>> FEATURED STOCK ARTICLE : Tested Support at 50-Day Moving Average After Breakout - 4/16/2018 |
View all notes |
Set NEW NOTE alert |
Company Profile |
SEC
News |
Chart |
Request a new note
C
A
S
I |
PYPL
-
NASDAQ
Paypal Holdings Inc
Finance-CrdtCard/PmtPr
|
$80.34
|
+0.31
0.39% |
$80.89
|
5,904,576
65.48% of 50 DAV
50 DAV is 9,018,000
|
$86.32
-6.93%
|
2/1/2018
|
$80.35
|
PP = $79.49
|
|
MB = $83.46
|
Most Recent Note - 4/12/2018 5:17:20 PM
G - Rebounded near its 50 DMA line ($77.92), but a gain above that short-term average is still needed for its outlook to improve. Halted its slide above the prior low ($71.63 on 2/09/18) which defines the next important support level.
>>> FEATURED STOCK ARTICLE : Sputtering Below 50-Day Moving Average Again - 3/27/2018 |
View all notes |
Set NEW NOTE alert |
Company Profile |
SEC
News |
Chart |
Request a new note
C
A
S
I |
OLLI
-
NASDAQ
Ollie's Bargain Outlet
Retail-DiscountandVariety
|
$63.60
|
+1.00
1.60% |
$64.45
|
942,132
145.39% of 50 DAV
50 DAV is 648,000
|
$63.75
-0.24%
|
4/10/2018
|
$62.05
|
PP = $62.15
|
|
MB = $65.26
|
Most Recent Note - 4/16/2018 12:55:15 PM
Y - Encountered distributional pressure and finished unchanged on 4/11/18 after hitting a new all-time high. Confirming gains above the pivot point backed by at least +40% above average volume are needed to trigger a proper technical buy signal.
>>> FEATURED STOCK ARTICLE : Encountered Distribution, Finished Below Pivot Point After Early Gain - 4/11/2018 |
View all notes |
Set NEW NOTE alert |
Company Profile |
SEC
News |
Chart |
Request a new note
C
A
S
I |
Symbol/Exchange
Company Name
Industry Group |
PRICE |
CHANGE
(%Change) |
Day High |
Volume
(% DAV)
(% 50 day avg vol) |
52 Wk Hi
% From Hi |
Featured
Date |
Price
Featured |
Pivot Featured |
|
Max Buy |
WB
-
NASDAQ
Weibo Corp Cl A Ads
INTERNET - Content
|
$118.38
|
-2.00
-1.66% |
$122.50
|
1,472,872
73.20% of 50 DAV
50 DAV is 2,012,000
|
$142.12
-16.70%
|
1/16/2018
|
$126.33
|
PP = $122.21
|
|
MB = $128.32
|
Most Recent Note - 4/13/2018 1:24:02 PM
G - Pulling back on higher volume today. Met resistance near its 50 DMA line ($126.72), but gains above that short-term average are still needed for its outlook to improve. Prior lows in the $109 area define near-term support above its 200 DMA line ($106).
>>> FEATURED STOCK ARTICLE : Quietly Slumping Near Prior Low - 4/6/2018 |
View all notes |
Set NEW NOTE alert |
Company Profile |
SEC
News |
Chart |
Request a new note
C
A
S
I |
NOVT
-
NASDAQ
Novanta Inc
Elec-Scientific/Msrng
|
$62.95
|
+1.25
2.03% |
$63.60
|
437,248
193.47% of 50 DAV
50 DAV is 226,000
|
$62.25
1.12%
|
4/17/2018
|
$60.55
|
PP = $60.40
|
|
MB = $63.42
|
Most Recent Note - 4/18/2018 1:30:37 PM
Y - Tallying a 7th consecutive gain today, hitting another new high and approaching its "max buy" level. Finished strong after highlighted in yellow with pivot point cited based on its 1/29/18 high plus 10 cents in the 4/17/18 mid-day report. The big gain above the stock's pivot point backed by +67% above average volume triggered a technical buy signal. Reported earnings +26% on +49% sales revenues for the Dec '17 quarter. and 3 of the past 4 quarterly earnings comparisons were above the +25% minimum guideline (C criteria). Sales revenues growth has shown encouraging acceleration. See the latest FSU analysis for more details and an annotated graph.
>>> FEATURED STOCK ARTICLE : Volume-Driven Gain Hit New All-Time High - 4/17/2018 |
View all notes |
Set NEW NOTE alert |
Company Profile |
SEC
News |
Chart |
Request a new note
C
A
S
I |
SQ
-
NYSE
Square Inc Cl A
Finance-CrdtCard/PmtPr
|
$51.38
|
+2.25
4.58% |
$51.68
|
10,906,202
75.36% of 50 DAV
50 DAV is 14,472,000
|
$58.46
-12.11%
|
3/5/2018
|
$49.70
|
PP = $49.66
|
|
MB = $52.14
|
Most Recent Note - 4/17/2018 7:29:45 PM
G - Posted a gain with lighter than average volume today and closed above its 50 DMA line ($47.98) helping its outlook improve. It has not formed a sound base.
>>> FEATURED STOCK ARTICLE : Slumped Back Into Prior Base Testing 50-Day Average - 4/2/2018 |
View all notes |
Set NEW NOTE alert |
Company Profile |
SEC
News |
Chart |
Request a new note
C
A
S
I |
SEND
-
NYSE
Sendgrid Inc
INTERNET - Content
|
$28.07
|
+0.27
0.97% |
$28.42
|
217,139
60.32% of 50 DAV
50 DAV is 360,000
|
$32.03
-12.35%
|
3/6/2018
|
$28.00
|
PP = $28.37
|
|
MB = $29.79
|
Most Recent Note - 4/12/2018 5:22:04 PM
G - Rebounded above its 50 DMA line ($26.47) with today's 3rd consecutive gain on near average volume. Priced a new Public Offering and Secondary Offering on 4/05/18.
>>> FEATURED STOCK ARTICLE : Slumped Into Prior Base Testing 50-Day Average - 4/3/2018 |
View all notes |
Set NEW NOTE alert |
Company Profile |
SEC
News |
Chart |
Request a new note
C
A
S
I |
|
|
|
THESE ARE NOT BUY RECOMMENDATIONS!
Comments contained in the body of this report are technical
opinions only. The material herein has been obtained
from sources believed to be reliable and accurate, however,
its accuracy and completeness cannot be guaranteed.
This site is not an investment advisor, hence it does
not endorse or recommend any securities or other investments.
Any recommendation contained in this report may not
be suitable for all investors and it is not to be deemed
an offer or solicitation on our part with respect to
the purchase or sale of any securities. All trademarks,
service marks and trade names appearing in this report
are the property of their respective owners, and are
likewise used for identification purposes only.
This report is a service available
only to active Paid Premium Members.
You may opt-out of receiving report notifications
at any time. Questions or comments may be submitted
by writing to Premium Membership Services 665 S.E. 10 Street, Suite 201 Deerfield Beach, FL 33441-5634 or by calling 1-800-965-8307
or 954-785-1121.
|
|
|