You are not logged in.
This means you
CAN ONLY VIEW reports that were published prior to Wednesday, March 19, 2025.
You
MUST UPGRADE YOUR MEMBERSHIP if you want to see any current reports.
AFTER MARKET UPDATE - MONDAY, APRIL 30TH, 2018
Previous After Market Report Next After Market Report >>>
|
|
|
|
DOW |
-148.04 |
24,163.15 |
-0.61% |
|
Volume |
1,009,254,700 |
+39% |
|
Volume |
1,983,067,470 |
-3% |
|
NASDAQ |
-53.53 |
7,066.27 |
-0.75% |
|
Advancers |
1,086 |
37% |
|
Advancers |
953 |
33% |
|
S&P 500 |
-21.86 |
2,648.05 |
-0.82% |
|
Decliners |
1,844 |
63% |
|
Decliners |
1,897 |
67% |
|
Russell 2000 |
-14.35 |
1,541.88 |
-0.92% |
|
52 Wk Highs |
71 |
|
|
52 Wk Highs |
58 |
|
|
S&P 600 |
-8.67 |
947.51 |
-0.91% |
|
52 Wk Lows |
50 |
|
|
52 Wk Lows |
45 |
|
|
 |
Breadth Negative and Volume Higher as Major Indices Fell
Kenneth J. Gruneisen - Passed the CAN SLIM® Master's Exam
Stocks finished lower Monday. The Dow was down 148 points to 24163, and the S&P 500 was off 21 points to 2648. The Nasdaq Composite declined 53 points to 7066. The volume totals reported were mixed, higher than the prior session total on the NYSE and lower on the Nasdaq exchange. Breadth was negative as decliners led decliners by a 9-5 margin on the NYSE and by nearly a 2-1 margin on the Nasdaq exchange. There were 35 high-ranked companies from the Leaders List that made new 52-week highs and were listed on the BreakOuts Page, versus the total of 32 on the prior session. New 52-week highs outnumbered new 52-week lows on the NYSE and on the Nasdaq exchange. The major indices (M criteria) have slumped as the latest confirmed rally has come under pressure. New buying efforts are justified only when all key criteria of the fact-based investment system are satisfied. The Featured Stocks Page provides the most timely analysis on high-ranked leaders. Charts used courtesy of www.stockcharts.com
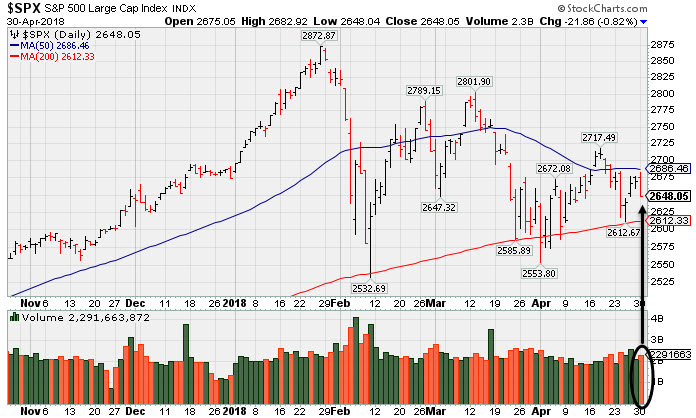 PICTURED: The S&P 500 Index met resistance at its 50-day moving average (DMA) line and fell Monday on sligtly higher volume. The 200 DMA line and prior lows define important near-term support.
The major averages ended lower amid a day of earnings and M&A news, but posted their first monthly gains in three months. For the month of April, the Dow rose 0.2%, the S&P 500 advanced 0.3% and the Nasdaq Composite gained less than 0.1%. On the data front, personal income and personal spending both advanced last month. In a separate release, the Core PCE Deflator, which is the Fed’s preferred gauge of inflation, rose 1.9% year-over-year in March. The release comes ahead of this week’s FOMC two-day policy meeting, in which the Fed is not expected to hike interest rates.
All 11 sectors of the S&P 500 finished in negative territory. Telecom shares lagged as T-Mobile (TMUS -6.22%) after announcing its planned acquisition of Sprint (S -13.69%) for $26.5 billion. Meanwhile, Oil refiner Andeavor (ANDV +13.03%) rose after agreeing to be acquired by rival Marathon Petroleum (MPC -8.01%) for over $20 billion. In earnings news, McDonald’s (MCD +5.77%) rose after posting profits above consensus estimates. Allergan (AGN -5.18%) despite topping analyst projections.
Treasuries strengthened, as the yield on the 10-year note fell one basis point to 2.95%. In commodities, WTI crude gained 0.5% to $68.42/barrel. COMEX gold lost 0.5% to $1316.40/ounce amid a stronger dollar. |
 Kenneth J. Gruneisen started out as a licensed stockbroker in August 1987, a couple of months prior to the historic stock market crash that took the Dow Jones Industrial Average down -22.6% in a single day. He has published daily fact-based fundamental and technical analysis on high-ranked stocks online for two decades. Through FACTBASEDINVESTING.COM, Kenneth provides educational articles, news, market commentary, and other information regarding proven investment systems that work in good times and bad.
Comments contained in the body of this report are technical opinions only and are not necessarily those of Gruneisen Growth Corp. The material herein has been obtained from sources believed to be reliable and accurate, however, its accuracy and completeness cannot be guaranteed. Our firm, employees, and customers may effect transactions, including transactions contrary to any recommendation herein, or have positions in the securities mentioned herein or options with respect thereto. Any recommendation contained in this report may not be suitable for all investors and it is not to be deemed an offer or solicitation on our part with respect to the purchase or sale of any securities. |
|
 |
Broad Based Weakness Weighed on All Groups
Kenneth J. Gruneisen - Passed the CAN SLIM® Master's Exam
On Monday the Retail Index ($RLX -0.54%), Bank Index ($BKX -1.24%), and the Broker/Dealer Index ($XBD -1.02%) ended lower. The tech sector had a negative bias as the Biotech Index ($BTK -1.77%), Semiconductor Index ($SOX -1.09%), and the Networking Index ($NWX -0.38%) ended lower. The Gold & Silver Index ($XAU -2.15%) was a standout decliners while energy-linked groups including the Integrated Oil Index ($XOI -0.24%) and the Oil Services Index ($OSX -0.47%) edged lower. 5arts courtesy wwwstockcharts.com
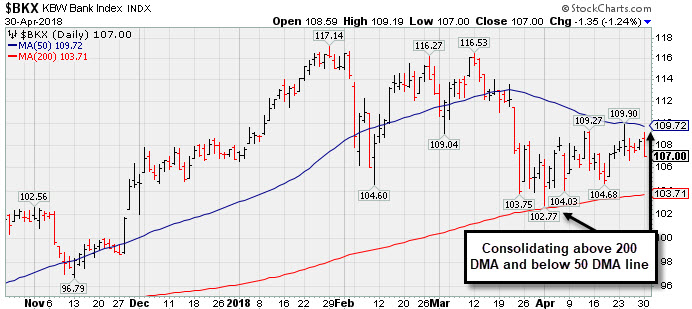 PICTURED: The Bank Index ($BKX -1.24%) is consolidating above support at its 200-day moving average (DMA) line, but it has recently met resistance at its 50 DMA line while trying to rebound toward the prior high.
| Oil Services |
$OSX |
155.83 |
-0.73 |
-0.47% |
+4.20% |
| Integrated Oil |
$XOI |
1,472.14 |
-3.54 |
-0.24% |
+10.23% |
| Semiconductor |
$SOX |
1,244.40 |
-13.71 |
-1.09% |
-0.69% |
| Networking |
$NWX |
537.90 |
-2.03 |
-0.38% |
+9.66% |
| Broker/Dealer |
$XBD |
286.28 |
-2.96 |
-1.02% |
+7.93% |
| Retail |
$RLX |
2,023.60 |
-11.52 |
-0.57% |
+16.72% |
| Gold & Silver |
$XAU |
81.15 |
-1.78 |
-2.15% |
-4.83% |
| Bank |
$BKX |
107.00 |
-1.35 |
-1.25% |
+0.27% |
| Biotech |
$BTK |
4,474.83 |
-80.56 |
-1.77% |
+5.98% |
|
|
|
 |
Consolidating Near 50 Day Average With Earnings News Due
Kenneth J. Gruneisen - Passed the CAN SLIM® Master's Exam
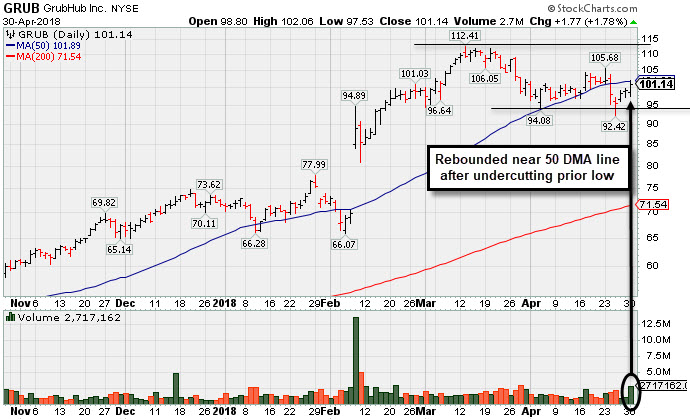
Grubhub Inc (GRUB +$1.77 or +1.78% to $101.14) rebounded near its 50-day moving average (DMA) line ($101.89). The recent low ($92.42 on 4/25/18) defines where further deterioration would raise more serious concerns. Before the open tomorrow the company is due to report earnings news for the latest quarter. Volume and volatility often increase near earnings news.
It reported earnings +61% on +49% sales revenues for the Dec '17 quarter and what followed was bullish action including a big "breakaway gap" on 2/08/18. It was last shown in this FSU section on 3/29/18 with an annotated graph under the headline, "Very Extended and Enduring Distributional Pressure".
GRUB traded up as much as +154% since first highlighted in yellow with pivot point cited based on its 9/29/16 high plus 10 cents in the 4/28/17 mid-day report (read here). Its annual earnings (A criteria) history has been very strong since the high ranked Internet Content firm completed a new Public Offering on 9/03/14.
It has earned a current Timeliness rating of A and a Sponsorship rating of B, and its Accumulation/Distribution rating is C. The number of top-rated funds owning its shares rose from 376 in Mar '17 to 489 in Mar '18, a reassuring sign concerning the I criteria. The current Up/Down Volume Ratio of 1.1 is an unbiased indication its shares have been under only slight accumulation over the past 50 days. It has a fairly small supply of only 87.2 million shares (S criteria) outstanding, which can contribute to greater price volatility in the event of institutional buying or selling.
|
|
|
Color Codes Explained :
Y - Better candidates highlighted by our
staff of experts.
G - Previously featured
in past reports as yellow but may no longer be buyable under the
guidelines.
***Last / Change / Volume data in this table is the closing quote data***
Symbol/Exchange
Company Name
Industry Group |
PRICE |
CHANGE
(%Change) |
Day High |
Volume
(% DAV)
(% 50 day avg vol) |
52 Wk Hi
% From Hi |
Featured
Date |
Price
Featured |
Pivot Featured |
|
Max Buy |
PFBC
-
NASDAQ
Preferred Bank Los Angls
BANKING - Regional - Pacific Banks
|
$63.74
|
-1.74
-2.66% |
$65.82
|
88,215
105.77% of 50 DAV
50 DAV is 83,400
|
$67.65
-5.78%
|
4/10/2018
|
$64.56
|
PP = $67.75
|
|
MB = $71.14
|
Most Recent Note - 4/25/2018 6:07:41 PM
Y - Perched within close striking distance of its 52-week high and previously cited pivot point. Subsequent volume-driven gains for new highs may trigger a technical buy signal. Consolidating above its 50 DMA line ($64.75) after holding its ground stubbornly in recent weeks.
>>> FEATURED STOCK ARTICLE : Bank Stock Hovering Within Striking Distance of Prior High - 4/10/2018 |
View all notes |
Set NEW NOTE alert |
Company Profile |
SEC
News |
Chart |
Request a new note
C
A
S
I |
SIVB
-
NASDAQ
S V B Financial Group
BANKING - Regional - Pacific Banks
|
$299.61
|
-6.00
-1.96% |
$306.81
|
935,591
122.30% of 50 DAV
50 DAV is 765,000
|
$306.94
-2.39%
|
3/12/2018
|
$267.79
|
PP = $263.19
|
|
MB = $276.35
|
Most Recent Note - 4/27/2018 1:19:21 PM
Y - There was a big "breakaway gap" for a new high today after it reported financial results for the quarter ended March 31, 2018 and earnings rose +90% on +34% sales revenues versus the year ago period. Volume and volatility often increase near earnings news.
>>> FEATURED STOCK ARTICLE : Rebounded Above its 50-Day Moving Average - 4/12/2018 |
View all notes |
Set NEW NOTE alert |
Company Profile |
SEC
News |
Chart |
Request a new note
C
A
S
I |
V
-
NYSE
Visa Inc Cl A
DIVERSIFIED SERVICES - Business/Management Services
|
$126.88
|
+0.87
0.69% |
$127.90
|
8,419,705
105.51% of 50 DAV
50 DAV is 7,980,000
|
$127.59
-0.56%
|
4/26/2018
|
$126.68
|
PP = $126.98
|
|
MB = $133.33
|
Most Recent Note - 4/26/2018 7:12:26 PM
Y - Finished strong after highlighted in yellow with pivot point cited based on its 1/29/18 high plus 10 cents in the earlier mid-day report. Reported earnings +29% on +13% sales revenues for the Mar '18 quarter, and 3 of the past 4 quarterly comparisons were above the +25% minimum earnings guideline (C criteria). See the latest FSU analysis for more details and a new annotated graph.
>>> FEATURED STOCK ARTICLE : Volume-Driven Gain For New High Triggered Technical Buy Signal - 4/26/2018 |
View all notes |
Set NEW NOTE alert |
Company Profile |
SEC
News |
Chart |
Request a new note
C
A
S
I |
TPL
-
NYSE
Texas Pacific Land Trust
FINANCIAL SERVICES - Diversified Investments
|
$544.88
|
+2.24
0.41% |
$551.00
|
11,284
86.80% of 50 DAV
50 DAV is 13,000
|
$569.99
-4.41%
|
4/13/2018
|
$547.85
|
PP = $552.10
|
|
MB = $579.71
|
Most Recent Note - 4/24/2018 1:09:19 PM
Y - Encountered distributional pressure on the prior session after challenging its all-time high. Recent gains lacked great volume conviction as it wedged up above the new pivot point cited based on its 2/28/18 high plus 10 cents. Gains above a stock's pivot point must have more than +40% above average volume to trigger a proper new (or add-on) technical buy signal. Very little resistance remains due to overhead supply up to the $569 level. The 50 DMA line defines near-term support to watch above the recent lows ($480).
>>> FEATURED STOCK ARTICLE : Perched Near Prior High After Showing Resilience - 4/20/2018 |
View all notes |
Set NEW NOTE alert |
Company Profile |
SEC
News |
Chart |
Request a new note
C
A
S
I |
LMAT
-
NASDAQ
Lemaitre Vascular Inc
Medical-Products
|
$31.45
|
-0.04
-0.13% |
$31.78
|
395,542
231.58% of 50 DAV
50 DAV is 170,800
|
$41.28
-23.81%
|
3/19/2018
|
$36.77
|
PP = $39.98
|
|
MB = $41.98
|
 Most Recent Note - 4/30/2018 5:46:51 PM
Gapped down 4/26/18 and suffered a damaging volume-driven loss violating its 50 and 200 DMA lines triggering technical sell signals. Weak action came after it reported earnings +19% on +8% sales revenues for the Mar '18 quarter, below the +25% minimum guideline (C criteria), raising fundamental concerns. A rebound above the 50 DMA line it needed for its outlook to improve. It will be dropped from the Featured Stocks list tonight.
>>> FEATURED STOCK ARTICLE : Gain With Heavy Volume Triggered Technical Buy Signal - 4/13/2018 |
View all notes |
Set NEW NOTE alert |
Company Profile |
SEC
News |
Chart |
Request a new note
C
A
S
I |
Symbol/Exchange
Company Name
Industry Group |
PRICE |
CHANGE
(%Change) |
Day High |
Volume
(% DAV)
(% 50 day avg vol) |
52 Wk Hi
% From Hi |
Featured
Date |
Price
Featured |
Pivot Featured |
|
Max Buy |
DPZ
-
NYSE
Dominos Pizza Inc
WHOLESALE - Food Wholesale
|
$241.73
|
-6.69
-2.69% |
$250.00
|
838,377
93.26% of 50 DAV
50 DAV is 899,000
|
$255.00
-5.20%
|
2/20/2018
|
$224.86
|
PP = $222.01
|
|
MB = $233.11
|
Most Recent Note - 4/30/2018 6:18:16 PM
G - Pulled back today for a 2nd consecutive loss following a big 4/26/18 gap up for a new all-time high. Reported earnings +59% on +26% sales revenues for the Mar '18 quarter, continuing its strong earnings track record. Its 50 DMA line and recent lows define near-term support to watch on pullbacks.
>>> FEATURED STOCK ARTICLE : Earnings News Due From Pizza Firm - 4/23/2018 |
View all notes |
Set NEW NOTE alert |
Company Profile |
SEC
News |
Chart |
Request a new note
C
A
S
I |
FIVE
-
NASDAQ
Five Below Inc
Retail-DiscountandVariety
|
$70.61
|
-2.97
-4.04% |
$74.50
|
1,952,052
133.89% of 50 DAV
50 DAV is 1,458,000
|
$78.28
-9.80%
|
3/9/2018
|
$68.58
|
PP = $73.65
|
|
MB = $77.33
|
Most Recent Note - 4/30/2018 6:16:35 PM
Y - Fell below prior highs and into the prior base today raising concerns with a big loss on higher volume testing its 50 DMA line ($70.69). More damaging losses may trigger a more worrisome technical sell signal.
>>> FEATURED STOCK ARTICLE : Quietly Hovering Near All-Time High - 4/5/2018 |
View all notes |
Set NEW NOTE alert |
Company Profile |
SEC
News |
Chart |
Request a new note
C
A
S
I |
NVEE
-
NASDAQ
N V 5 Global Inc
Comml Svcs-Consulting
|
$58.85
|
-1.50
-2.49% |
$60.30
|
53,873
65.70% of 50 DAV
50 DAV is 82,000
|
$64.50
-8.76%
|
4/9/2018
|
$58.35
|
PP = $59.05
|
|
MB = $62.00
|
Most Recent Note - 4/26/2018 7:18:34 PM
Y - Color code is changed to yellow although a loss today on higher volume raised concerns while slumping below its pivot point and testing prior highs in the $58 area defining initial support.
>>> FEATURED STOCK ARTICLE : Perched Near High After 3 Strong Quarterly Comparisons - 4/9/2018 |
View all notes |
Set NEW NOTE alert |
Company Profile |
SEC
News |
Chart |
Request a new note
C
A
S
I |
QLYS
-
NASDAQ
Qualys Inc
Computer Sftwr-Security
|
$76.95
|
-1.10
-1.41% |
$79.25
|
358,094
108.84% of 50 DAV
50 DAV is 329,000
|
$85.00
-9.47%
|
4/17/2018
|
$82.85
|
PP = $79.50
|
|
MB = $83.48
|
Most Recent Note - 4/25/2018 1:56:50 PM
Y - Color code is changed to yellow although now pulling back undercutting the prior high in the $79 area raising some concern. Today's 5th consecutive loss is testing its 50 DMA line ($75.80). Deterioration below the 50 DMA would raise concerns, and a violation of the prior low ($70.85 on 3/28/18) would trigger a more worrisome technical sell signal.
>>> FEATURED STOCK ARTICLE : Quickly Rallied More Than 5% Above Prior High - 4/18/2018 |
View all notes |
Set NEW NOTE alert |
Company Profile |
SEC
News |
Chart |
Request a new note
C
A
S
I |
SPLK
-
NASDAQ
Splunk Inc
Computer Sftwr-Database
|
$102.65
|
+0.50
0.49% |
$103.99
|
962,206
47.07% of 50 DAV
50 DAV is 2,044,000
|
$112.66
-8.89%
|
2/15/2018
|
$96.06
|
PP = $93.68
|
|
MB = $98.36
|
Most Recent Note - 4/25/2018 6:05:58 PM
G - Slumped below its 50 DMA line ($101.079) with a big loss today on +19% average volume doing more damage and triggering a technical sell signal. A subsequent loss on breach of the prior low ($94.39 on 4/04/18) would raise more serious concerns.
>>> FEATURED STOCK ARTICLE : Found Support Near 50-Day Average on Pullbacks - 4/19/2018 |
View all notes |
Set NEW NOTE alert |
Company Profile |
SEC
News |
Chart |
Request a new note
C
A
S
I |
Symbol/Exchange
Company Name
Industry Group |
PRICE |
CHANGE
(%Change) |
Day High |
Volume
(% DAV)
(% 50 day avg vol) |
52 Wk Hi
% From Hi |
Featured
Date |
Price
Featured |
Pivot Featured |
|
Max Buy |
SUPN
-
NASDAQ
Supernus Pharmaceuticals
Medical-Biomed/Biotech
|
$46.90
|
-0.80
-1.68% |
$48.06
|
307,734
47.86% of 50 DAV
50 DAV is 643,000
|
$50.05
-6.28%
|
4/24/2018
|
$47.73
|
PP = $50.15
|
|
MB = $52.66
|
Most Recent Note - 4/24/2018 1:01:49 PM
Y - Color code is changed to yellow with pivot point cited based on its 9/18/17 high plus 10 cents. Hovering within close striking distance of its all-time high. Subsequent gains above the pivot point backed by at least +40% above average volume are needed to trigger a technical buy signal. Sales revenues increases were in the +30-47% range while three of the past 4 quarterly earnings comparisons through Dec '17 were above the +25% minimum guideline (C criteria). Showed strong earnings growth since FY '15 after years of losses.
>>> FEATURED STOCK ARTICLE : Pharmaceutical Firm Perched Near Record High - 4/24/2018 |
View all notes |
Set NEW NOTE alert |
Company Profile |
SEC
News |
Chart |
Request a new note
C
A
S
I |
PAYC
-
NYSE
Paycom Software Inc
COMPUTER SOFTWARE and SERVICES - Application Software
|
$114.21
|
+0.72
0.63% |
$115.99
|
750,259
113.16% of 50 DAV
50 DAV is 663,000
|
$118.45
-3.58%
|
2/15/2018
|
$95.01
|
PP = $93.61
|
|
MB = $98.29
|
Most Recent Note - 4/24/2018 5:43:48 PM
G - Pulled back from its all-time high with 4 consecutive losses on ever increasing volume. Its 50 DMA line ($106) and recent low ($101.55 on 4/04/18) define important near-term support to watch on pullbacks. Due to report earnings news on 5/01/18.
>>> FEATURED STOCK ARTICLE : Pulling Back After Negative Reversal at All-Time High Last Week - 4/4/2018 |
View all notes |
Set NEW NOTE alert |
Company Profile |
SEC
News |
Chart |
Request a new note
C
A
S
I |
GRUB
-
NYSE
Grubhub Inc
COMPUTER SOFTWARE and SERVICES - Technical and System Software
|
$101.14
|
+1.77
1.78% |
$102.06
|
2,715,410
175.41% of 50 DAV
50 DAV is 1,548,000
|
$112.41
-10.03%
|
6/21/2017
|
$47.33
|
PP = $46.94
|
|
MB = $49.29
|
Most Recent Note - 4/30/2018 6:14:18 PM
G - Rebounded near its 50 DMA line ($101.89). Due to report earnings news before the open on Tuesday. Volume and volatility often increase near earnings news. See the latest FSU analysis for more details and a new annotated graph.
>>> FEATURED STOCK ARTICLE : Very Extended and Enduring Distributional Pressure - 3/29/2018 |
View all notes |
Set NEW NOTE alert |
Company Profile |
SEC
News |
Chart |
Request a new note
C
A
S
I |
HQY
-
NASDAQ
Healthequity Inc
COMPUTER SOFTWARE and SERVICES - Healthcare Information Service
|
$65.67
|
-1.07
-1.60% |
$67.42
|
408,721
57.81% of 50 DAV
50 DAV is 707,000
|
$68.75
-4.48%
|
2/20/2018
|
$56.37
|
PP = $55.41
|
|
MB = $58.18
|
Most Recent Note - 4/25/2018 5:58:26 PM
G - Volume totals have been cooling while hovering near its all-time high, possibly forming a short new flat base. Its 50 DMA line ($60.41) defines near term support above prior highs. See the latest FSU analysis for more details and a new annotated graph.
>>> FEATURED STOCK ARTICLE : Perched Near All-Time High Building a Short New Base - 4/25/2018 |
View all notes |
Set NEW NOTE alert |
Company Profile |
SEC
News |
Chart |
Request a new note
C
A
S
I |
LOB
-
NASDAQ
Live Oak Bancshares Inc
Banks-Southeast
|
$28.25
|
-0.40
-1.40% |
$28.95
|
166,678
125.32% of 50 DAV
50 DAV is 133,000
|
$30.05
-5.99%
|
3/16/2018
|
$28.63
|
PP = $28.30
|
|
MB = $29.72
|
Most Recent Note - 4/30/2018 6:10:15 PM
Y - Recently reported earnings +63% on +42% for the Mar '18 quarter. Consolidating above its 50 DMA line ($27.97) and prior lows where more damaging losses would raise greater concerns.
>>> FEATURED STOCK ARTICLE : Tested Support at 50-Day Moving Average After Breakout - 4/16/2018 |
View all notes |
Set NEW NOTE alert |
Company Profile |
SEC
News |
Chart |
Request a new note
C
A
S
I |
Symbol/Exchange
Company Name
Industry Group |
PRICE |
CHANGE
(%Change) |
Day High |
Volume
(% DAV)
(% 50 day avg vol) |
52 Wk Hi
% From Hi |
Featured
Date |
Price
Featured |
Pivot Featured |
|
Max Buy |
PYPL
-
NASDAQ
Paypal Holdings Inc
Finance-CrdtCard/PmtPr
|
$74.61
|
+0.48
0.65% |
$75.02
|
9,304,978
112.88% of 50 DAV
50 DAV is 8,243,000
|
$86.32
-13.57%
|
2/1/2018
|
$80.35
|
PP = $79.49
|
|
MB = $83.46
|
Most Recent Note - 4/24/2018 6:07:47 PM
G - Slumped below its 50 DMA line ($78.20) with a big loss today raising concerns. Prior lows in the $71-72 area define important support. Due to report Mar '18 quarterly results on 4/25/18. Volume and volatility often increase near earnings news.
>>> FEATURED STOCK ARTICLE : Slumping Near Important Near-Term Support - 4/27/2018 |
View all notes |
Set NEW NOTE alert |
Company Profile |
SEC
News |
Chart |
Request a new note
C
A
S
I |
OLLI
-
NASDAQ
Ollie's Bargain Outlet
Retail-DiscountandVariety
|
$62.20
|
-0.55
-0.88% |
$63.70
|
464,058
69.68% of 50 DAV
50 DAV is 666,000
|
$64.45
-3.49%
|
4/10/2018
|
$62.05
|
PP = $62.15
|
|
MB = $65.26
|
Most Recent Note - 4/30/2018 6:11:56 PM
Y - Still quietly hovering near its all-time high with volume totals cooling. Confirming gains above the pivot point backed by at least +40% above average volume are needed to trigger a proper technical buy signal.
>>> FEATURED STOCK ARTICLE : Encountered Distribution, Finished Below Pivot Point After Early Gain - 4/11/2018 |
View all notes |
Set NEW NOTE alert |
Company Profile |
SEC
News |
Chart |
Request a new note
C
A
S
I |
NOVT
-
NASDAQ
Novanta Inc
Elec-Scientific/Msrng
|
$58.80
|
+0.05
0.09% |
$59.20
|
154,340
68.90% of 50 DAV
50 DAV is 224,000
|
$63.60
-7.55%
|
4/17/2018
|
$60.55
|
PP = $60.40
|
|
MB = $63.42
|
Most Recent Note - 4/25/2018 1:51:07 PM
Y - Pulling back today for a 3rd consecutive small loss on light or near average volume. Stalled after recently rallying to new highs with an impressive streak of volume-driven gains. Prior highs in the $58-60 area define initial support to watch above its 50 DMA line.
>>> FEATURED STOCK ARTICLE : Volume-Driven Gain Hit New All-Time High - 4/17/2018 |
View all notes |
Set NEW NOTE alert |
Company Profile |
SEC
News |
Chart |
Request a new note
C
A
S
I |
SEND
-
NYSE
Sendgrid Inc
INTERNET - Content
|
$28.86
|
+0.37
1.30% |
$29.64
|
245,575
64.12% of 50 DAV
50 DAV is 383,000
|
$32.03
-9.89%
|
3/6/2018
|
$28.00
|
PP = $28.37
|
|
MB = $29.79
|
Most Recent Note - 4/25/2018 6:00:34 PM
G - Retreated near its 50 DMA line ($27.53) with a big loss today on near average volume. Due to report earnings news on 5/01/18 after the close. Showing resilience after it priced a new Public Offering and Secondary Offering on 4/05/18.
>>> FEATURED STOCK ARTICLE : Slumped Into Prior Base Testing 50-Day Average - 4/3/2018 |
View all notes |
Set NEW NOTE alert |
Company Profile |
SEC
News |
Chart |
Request a new note
C
A
S
I |
|
|
|
THESE ARE NOT BUY RECOMMENDATIONS!
Comments contained in the body of this report are technical
opinions only. The material herein has been obtained
from sources believed to be reliable and accurate, however,
its accuracy and completeness cannot be guaranteed.
This site is not an investment advisor, hence it does
not endorse or recommend any securities or other investments.
Any recommendation contained in this report may not
be suitable for all investors and it is not to be deemed
an offer or solicitation on our part with respect to
the purchase or sale of any securities. All trademarks,
service marks and trade names appearing in this report
are the property of their respective owners, and are
likewise used for identification purposes only.
This report is a service available
only to active Paid Premium Members.
You may opt-out of receiving report notifications
at any time. Questions or comments may be submitted
by writing to Premium Membership Services 665 S.E. 10 Street, Suite 201 Deerfield Beach, FL 33441-5634 or by calling 1-800-965-8307
or 954-785-1121.
|
|
|