You are not logged in.
This means you
CAN ONLY VIEW reports that were published prior to Wednesday, March 19, 2025.
You
MUST UPGRADE YOUR MEMBERSHIP if you want to see any current reports.
AFTER MARKET UPDATE - MONDAY, APRIL 16TH, 2018
Previous After Market Report Next After Market Report >>>
|
|
|
|
DOW |
+212.90 |
24,573.04 |
+0.87% |
|
Volume |
748,433,570 |
+4% |
|
Volume |
1,783,844,319 |
+2% |
|
NASDAQ |
+49.63 |
7,156.28 |
+0.70% |
|
Advancers |
2,134 |
73% |
|
Advancers |
1,878 |
64% |
|
S&P 500 |
+21.54 |
2,677.84 |
+0.81% |
|
Decliners |
808 |
27% |
|
Decliners |
1,034 |
35% |
|
Russell 2000 |
+13.52 |
1,563.03 |
+0.87% |
|
52 Wk Highs |
64 |
|
|
52 Wk Highs |
79 |
|
|
S&P 600 |
+10.22 |
962.99 |
+1.07% |
|
52 Wk Lows |
41 |
|
|
52 Wk Lows |
28 |
|
|
 |
Breadth Positive as Indices Rose With Higher Volume
Kenneth J. Gruneisen - Passed the CAN SLIM® Master's Exam
Stocks finished higher Monday. The Dow climbed 212 points to 24573 while the S&P 500 added 21 points to 2677. The Nasdaq Composite gained 49 points to 7156. The volume totals reported were higher than the prior session totals on the NYSE and on the Nasdaq exchange, indicative of greater institutional buying demand. Advancers led decliners by more than an 11-4 margin on the NYSE and by a 9-5 margin on the Nasdaq exchange. Leadership improved as there were 34 high-ranked companies from the Leaders List that made new 52-week highs and were listed on the BreakOuts Page, versus the total of 19 on the prior session. New 52-week highs outnumbered new 52-week lows totals on both the Nasdaq exchange and the NYSE. Last Tuesday's big gains for all three major indices (M criteria) came with higher volume totals coupled with more stocks hitting new highs. The strong action met the definition of a follow-through day on Day 6 of the rally effort. With the new confirmed rally, buying efforts are justified when all key criteria of the fact-based investment system are satisfied. The Featured Stocks Page provides the most timely analysis on high-ranked leaders. Charts used courtesy of www.stockcharts.com
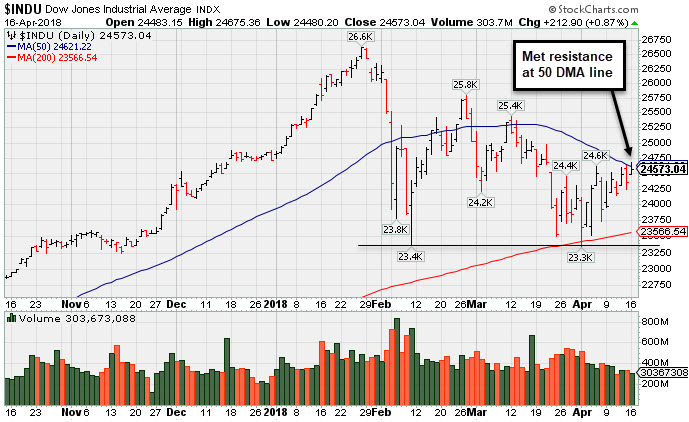 PICTURED: The Dow Jones Industrial Average has rebounded near its 50-day moving average (DMA) line which is now downward sloping. The 200 DMA line and prior low define important near-term support. Technically, more damaging losses would signal for investors to reduce market exposure.
The major averages advanced amid easing geopolitical tensions and a deluge of corporate earnings. Investors appear to be relieved that the U.S., U.K. and France military intervention in Syria seem to be limited to the weekend’s missile strikes targeting Syrian President Assad’s chemical weapons manufacturing and storage sites. On the economic data front, retail sales advanced 0.6% in March, rebounding from a 0.1% dip in February.
All 11 sectors in the S&P 500 finished in positive territory. Bank of America (BAC +0.44%) rose after topping earnings projections on both the top and bottom line. Also in Financials, Charles Schwab (SCHW +4.00%) rose after posting earnings above expectations. J.B. Hunt (JBHT +6.19%) rose after the transportation company bested revenue forecasts. Netflix (NFLX -1.24%) fell ahead of its highly anticipated earnings release after the closing bell. In other corporate news, Bristol-Myers Squibb (BMY -7.79%) fell amid reports its new lung cancer drug underperformed rival Merck’s (MRK +2.59%) in recent clinical trials.
Treasuries were essentially unchanged with the yield on the 10-year note finishing flat at 2.83%. In commodities, WTI crude fell 1.5% to $66.40/barrel. COMEX gold gained 0.2% to $1347.50/ounce amid a weaker dollar. |
 Kenneth J. Gruneisen started out as a licensed stockbroker in August 1987, a couple of months prior to the historic stock market crash that took the Dow Jones Industrial Average down -22.6% in a single day. He has published daily fact-based fundamental and technical analysis on high-ranked stocks online for two decades. Through FACTBASEDINVESTING.COM, Kenneth provides educational articles, news, market commentary, and other information regarding proven investment systems that work in good times and bad.
Comments contained in the body of this report are technical opinions only and are not necessarily those of Gruneisen Growth Corp. The material herein has been obtained from sources believed to be reliable and accurate, however, its accuracy and completeness cannot be guaranteed. Our firm, employees, and customers may effect transactions, including transactions contrary to any recommendation herein, or have positions in the securities mentioned herein or options with respect thereto. Any recommendation contained in this report may not be suitable for all investors and it is not to be deemed an offer or solicitation on our part with respect to the purchase or sale of any securities. |
|
 |
Broker/Dealer, Retail, Semiconductor, and Networking Indexes Rose
Kenneth J. Gruneisen - Passed the CAN SLIM® Master's Exam
On Monday the Broker/Dealer Index ($XBD +1.30%) and the Retail Index ($RLX +0.60%) both rose while the Bank Index ($BKX +0.08%) finished flat. The tech sector was mixed as the Biotech Index ($BTK -0.65%) edged lower while the Semiconductor Index ($SOX +0.23%) and the Networking Index ($NWX +0.18%) each posted small gains. Energy-linked groups were mixed as the Oil Services Index ($OSX -0.46%) edged lower and the Integrated Oil Index ($XOI +0.84%) rose, meanwhile the Gold & Silver Index ($XAU -0.12%) was little changed. Charts courtesy wwwstockcharts.com
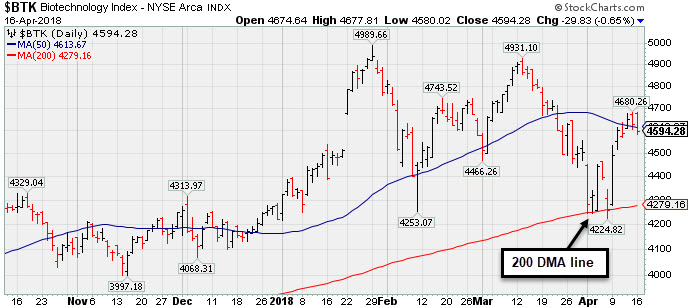 PICTURED: The Biotech Index ($BTK -0.65%) found support at its 200-day moving average (DMA) line and rebounded near its 50 DMA line.
| Oil Services |
$OSX |
150.40 |
-0.70 |
-0.46% |
+0.57% |
| Integrated Oil |
$XOI |
1,428.68 |
+11.93 |
+0.84% |
+6.97% |
| Semiconductor |
$SOX |
1,332.52 |
+3.12 |
+0.23% |
+6.34% |
| Networking |
$NWX |
539.18 |
+0.97 |
+0.18% |
+9.92% |
| Broker/Dealer |
$XBD |
287.99 |
+3.71 |
+1.30% |
+8.58% |
| Retail |
$RLX |
1,926.52 |
+11.58 |
+0.60% |
+11.12% |
| Gold & Silver |
$XAU |
83.98 |
-0.10 |
-0.12% |
-1.51% |
| Bank |
$BKX |
106.46 |
+0.08 |
+0.08% |
-0.23% |
| Biotech |
$BTK |
4,594.28 |
-29.83 |
-0.65% |
+8.81% |
|
|
|
 |
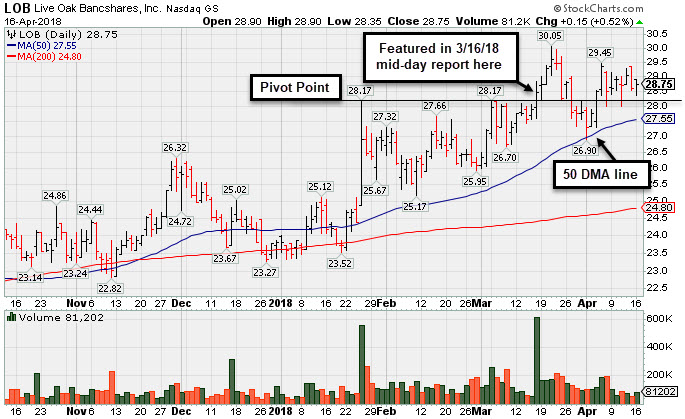
Tested Support at 50-Day Moving Average After Breakout
Kenneth J. Gruneisen - Passed the CAN SLIM® Master's Exam
Live Oak Bancshares Inc (LOB +$0.15 or +0.52% to $28.75) is quietly consolidating above its pivot point after testing its 50-day moving average (DMA) line ($27.56). Subsequent damaging losses below the 50 DMA line and prior low ($26.90 on 4/02/18) would raise greater concerns and rigger technical sell signals.
LOB was highlighted in yellow with pivot point cited based on its 1/25/18 high plus 10 cents in the 3/16/18 mid-day report (read here). It was shown with an annotated graph in this FSU section that evening under the headline, "Tallied Volume-Driven Gain for New High". Hitting a new all-time high, its gain and strong close above the pivot point was backed by +354% above average volume triggering a technical buy signal.
The Wilmington, NC - based banking company reported very strong sales revenues and earnings increases for the Sep and Dec '17 quarters. Prior quarterly and annual earnings (C and A criteria) history is a good match with the fact-based investment system's guidelines.
It completed a new Public Offering on 8/09/17. The number of top-rated funds owning its shares rose from 140 in Mar '17 to 181 in mar '18, a reassuring sign concerning the I criteria. Its current Up/Down Volume Ratio of 1.5 is an unbiased indication its shares have been under accumulation over the past 50 days. There are only 40.0 million shares outstanding (S criteria). It has earned a Timeliness Rating of A and Sponsorship rating of C. |
|
|
Color Codes Explained :
Y - Better candidates highlighted by our
staff of experts.
G - Previously featured
in past reports as yellow but may no longer be buyable under the
guidelines.
***Last / Change / Volume data in this table is the closing quote data***
Symbol/Exchange
Company Name
Industry Group |
PRICE |
CHANGE
(%Change) |
Day High |
Volume
(% DAV)
(% 50 day avg vol) |
52 Wk Hi
% From Hi |
Featured
Date |
Price
Featured |
Pivot Featured |
|
Max Buy |
PFBC
-
NASDAQ
Preferred Bank Los Angls
BANKING - Regional - Pacific Banks
|
$65.73
|
+1.18
1.83% |
$65.93
|
65,517
78.00% of 50 DAV
50 DAV is 84,000
|
$67.65
-2.84%
|
4/10/2018
|
$64.56
|
PP = $67.75
|
|
MB = $71.14
|
 Most Recent Note - 4/16/2018 1:00:46 PM
Y - Quietly consolidating near its 50 DMA line ($64.13), holding its ground within striking distance of the new pivot point cited based on its 1/22/18 high plus 10 cents. Subsequent volume-driven gains for new highs may trigger a technical buy signal. Due to report results for the first quarter ended March 31, 2018 after the close of the market on Thursday, April 19, 2018. Volume and volatility often increase near earnings news.
>>> FEATURED STOCK ARTICLE : Bank Stock Hovering Within Striking Distance of Prior High - 4/10/2018 |
View all notes |
Set NEW NOTE alert |
Company Profile |
SEC
News |
Chart |
Request a new note
C
A
S
I |
SIVB
-
NASDAQ
S V B Financial Group
BANKING - Regional - Pacific Banks
|
$246.57
|
-0.46
-0.19% |
$252.01
|
273,817
37.25% of 50 DAV
50 DAV is 735,000
|
$271.79
-9.28%
|
3/12/2018
|
$267.79
|
PP = $263.19
|
|
MB = $276.35
|
Most Recent Note - 4/12/2018 5:15:48 PM
Y - Color code is changed to yellow after rebounding above the downward sloping 50 DMA line ($249.19) helping its outlook improve. Found support when recently sputtering near the prior low ($226.61 on 2/06/18). See the latest FSU analysis for more details and a new annotated graph.
>>> FEATURED STOCK ARTICLE : Rebounded Above its 50-Day Moving Average - 4/12/2018 |
View all notes |
Set NEW NOTE alert |
Company Profile |
SEC
News |
Chart |
Request a new note
C
A
S
I |
TPL
-
NYSE
Texas Pacific Land Trust
FINANCIAL SERVICES - Diversified Investments
|
$542.00
|
+2.00
0.37% |
$551.80
|
14,822
105.87% of 50 DAV
50 DAV is 14,000
|
$569.99
-4.91%
|
4/13/2018
|
$547.85
|
PP = $552.10
|
|
MB = $579.71
|
Most Recent Note - 4/13/2018 1:14:03 PM
Y - Color code is changed to yellow with new pivot point cited based on its 2/28/18 high plus 10 cents. Subsequent gains above the pivot point with more than+40% above average volume may trigger a new (or add-on) technical buy signal. Very little resistance remains due to overhead supply up to the $569 level. Recent lows ($480) define important support where damaging losses may trigger a worrisome technical sell signal.
>>> FEATURED STOCK ARTICLE : Slump Under 50-Day Average Line Hurt Near Term Outlook - 3/23/2018 |
View all notes |
Set NEW NOTE alert |
Company Profile |
SEC
News |
Chart |
Request a new note
C
A
S
I |
LMAT
-
NASDAQ
Lemaitre Vascular Inc
Medical-Products
|
$40.90
|
+0.65
1.61% |
$41.09
|
85,585
61.13% of 50 DAV
50 DAV is 140,000
|
$40.89
0.02%
|
3/19/2018
|
$36.77
|
PP = $39.98
|
|
MB = $41.98
|
Most Recent Note - 4/16/2018 5:49:40 PM
Y - Posted a gain on light volume today for a new all-time high. Triggered a technical buy signal as it posted a solid gain on 4/11/18 with +87% above average volume, rising above the new pivot point cited based on its 10/20/17 high plus 10 cents. Found support recently near its 50 DMA line ($36.28). See the latest FSU analysis for more details and an annotated graph.
>>> FEATURED STOCK ARTICLE : Gain With Heavy Volume Triggered Technical Buy Signal - 4/13/2018 |
View all notes |
Set NEW NOTE alert |
Company Profile |
SEC
News |
Chart |
Request a new note
C
A
S
I |
DPZ
-
NYSE
Dominos Pizza Inc
WHOLESALE - Food Wholesale
|
$232.35
|
+2.03
0.88% |
$234.83
|
353,422
36.59% of 50 DAV
50 DAV is 966,000
|
$236.93
-1.93%
|
2/20/2018
|
$224.86
|
PP = $222.01
|
|
MB = $233.11
|
Most Recent Note - 4/16/2018 12:41:59 PM
Y - Volume totals have been cooling in recent weeks while hovering in a tight trading range near its all-time high. Made limited headway since highlighted in the 2/20/18 mid-day report with pivot point cited based on its 1/25/18 high plus 10 cents. Its 50 DMA line ($224.48) defines near-term support to watch.
>>> FEATURED STOCK ARTICLE : Popular Pizza Firm Perched Near All Time High - 3/21/2018 |
View all notes |
Set NEW NOTE alert |
Company Profile |
SEC
News |
Chart |
Request a new note
C
A
S
I |
Symbol/Exchange
Company Name
Industry Group |
PRICE |
CHANGE
(%Change) |
Day High |
Volume
(% DAV)
(% 50 day avg vol) |
52 Wk Hi
% From Hi |
Featured
Date |
Price
Featured |
Pivot Featured |
|
Max Buy |
FIVE
-
NASDAQ
Five Below Inc
Retail-DiscountandVariety
|
$76.39
|
+1.15
1.53% |
$76.85
|
1,006,851
81.66% of 50 DAV
50 DAV is 1,233,000
|
$77.12
-0.95%
|
3/9/2018
|
$68.58
|
PP = $73.65
|
|
MB = $77.33
|
Most Recent Note - 4/16/2018 12:46:01 PM
Y - Perched near its best-ever close today. Holding its ground after big gain on 4/11/18 backed by +63% above average volume cleared the pivot point and clinched a technical buy signal. Prior highs in the $73 area define initial support to watch on pullbacks.
>>> FEATURED STOCK ARTICLE : Quietly Hovering Near All-Time High - 4/5/2018 |
View all notes |
Set NEW NOTE alert |
Company Profile |
SEC
News |
Chart |
Request a new note
C
A
S
I |
NVEE
-
NASDAQ
N V 5 Global Inc
Comml Svcs-Consulting
|
$61.85
|
+2.30
3.86% |
$62.60
|
77,626
95.83% of 50 DAV
50 DAV is 81,000
|
$64.50
-4.11%
|
4/9/2018
|
$58.35
|
PP = $59.05
|
|
MB = $62.00
|
Most Recent Note - 4/16/2018 3:12:05 PM
G - Color code is changed to green after gapping up and rising above its "max buy" level with today's big gain. Prior highs in the $58 area define initial support to watch on pullbacks. Hit a new all-time high with +95% above average volume behind its considerable 4/12/18 gain above the pivot point triggering a technical buy signal.
>>> FEATURED STOCK ARTICLE : Perched Near High After 3 Strong Quarterly Comparisons - 4/9/2018 |
View all notes |
Set NEW NOTE alert |
Company Profile |
SEC
News |
Chart |
Request a new note
C
A
S
I |
SPLK
-
NASDAQ
Splunk Inc
Computer Sftwr-Database
|
$103.86
|
-0.29
-0.28% |
$105.44
|
1,791,214
85.26% of 50 DAV
50 DAV is 2,101,000
|
$112.66
-7.81%
|
2/15/2018
|
$96.06
|
PP = $93.68
|
|
MB = $98.36
|
Most Recent Note - 4/13/2018 5:50:46 PM
G - Pulled back today with lighter volume after 4 consecutive gains. Found support near its 50 DMA ($98.69) line and prior high in the $97 area. More damaging losses would raise greater concerns. It has not formed a sound base.
>>> FEATURED STOCK ARTICLE : Extended After Rallying from Secondary Buy Point - 3/20/2018 |
View all notes |
Set NEW NOTE alert |
Company Profile |
SEC
News |
Chart |
Request a new note
C
A
S
I |
PAYC
-
NYSE
Paycom Software Inc
COMPUTER SOFTWARE and SERVICES - Application Software
|
$112.01
|
+2.05
1.86% |
$112.52
|
550,996
71.93% of 50 DAV
50 DAV is 766,000
|
$115.48
-3.00%
|
2/15/2018
|
$95.01
|
PP = $93.61
|
|
MB = $98.29
|
Most Recent Note - 4/16/2018 12:56:32 PM
G - Perched within close striking distance of its all-time high after a brief consolidation. Its 50 DMA line ($102.38) defines near-term support above prior highs in the $93 area. Fundamentals remain strong.
>>> FEATURED STOCK ARTICLE : Pulling Back After Negative Reversal at All-Time High Last Week - 4/4/2018 |
View all notes |
Set NEW NOTE alert |
Company Profile |
SEC
News |
Chart |
Request a new note
C
A
S
I |
GRUB
-
NYSE
Grubhub Inc
COMPUTER SOFTWARE and SERVICES - Technical and System Software
|
$98.50
|
+0.59
0.60% |
$99.25
|
958,731
49.27% of 50 DAV
50 DAV is 1,946,000
|
$112.41
-12.37%
|
6/21/2017
|
$47.33
|
PP = $46.94
|
|
MB = $49.29
|
Most Recent Note - 4/16/2018 12:47:53 PM
G - Testing support at its 50 DMA line ($98.09) recently. Damaging losses below the 50 DMA line and recent low ($94.08 on 4/04/18) would raise more serious concerns and trigger technical sell signals.
>>> FEATURED STOCK ARTICLE : Very Extended and Enduring Distributional Pressure - 3/29/2018 |
View all notes |
Set NEW NOTE alert |
Company Profile |
SEC
News |
Chart |
Request a new note
C
A
S
I |
Symbol/Exchange
Company Name
Industry Group |
PRICE |
CHANGE
(%Change) |
Day High |
Volume
(% DAV)
(% 50 day avg vol) |
52 Wk Hi
% From Hi |
Featured
Date |
Price
Featured |
Pivot Featured |
|
Max Buy |
HQY
-
NASDAQ
Healthequity Inc
COMPUTER SOFTWARE and SERVICES - Healthcare Information Service
|
$64.20
|
+0.72
1.13% |
$64.87
|
473,880
60.99% of 50 DAV
50 DAV is 777,000
|
$68.75
-6.62%
|
2/20/2018
|
$56.37
|
PP = $55.41
|
|
MB = $58.18
|
Most Recent Note - 4/16/2018 12:49:40 PM
G - Volume totals have been cooling in recent weeks while hovering near its all-time high. It is extended from any sound base. Its 50 DMA line ($58.33) defines near term support above prior highs.
>>> FEATURED STOCK ARTICLE : Bullish Action Followed Latest Earnings Report - 3/22/2018 |
View all notes |
Set NEW NOTE alert |
Company Profile |
SEC
News |
Chart |
Request a new note
C
A
S
I |
LOB
-
NASDAQ
Live Oak Bancshares Inc
Banks-Southeast
|
$28.75
|
+0.15
0.52% |
$28.90
|
80,407
58.69% of 50 DAV
50 DAV is 137,000
|
$30.05
-4.33%
|
3/16/2018
|
$28.63
|
PP = $28.30
|
|
MB = $29.72
|
Most Recent Note - 4/16/2018 5:47:18 PM
Y - Quietly consolidating above its pivot point after testing its 50 DMA line ($27.56). Subsequent damaging losses would raise greater concerns. See the latest FSU analysis for more details and a new annotated graph.
>>> FEATURED STOCK ARTICLE : Tested Support at 50-Day Moving Average After Breakout - 4/16/2018 |
View all notes |
Set NEW NOTE alert |
Company Profile |
SEC
News |
Chart |
Request a new note
C
A
S
I |
PYPL
-
NASDAQ
Paypal Holdings Inc
Finance-CrdtCard/PmtPr
|
$77.80
|
+0.53
0.69% |
$78.50
|
5,023,220
49.74% of 50 DAV
50 DAV is 10,098,000
|
$86.32
-9.87%
|
2/1/2018
|
$80.35
|
PP = $79.49
|
|
MB = $83.46
|
Most Recent Note - 4/12/2018 5:17:20 PM
G - Rebounded near its 50 DMA line ($77.92), but a gain above that short-term average is still needed for its outlook to improve. Halted its slide above the prior low ($71.63 on 2/09/18) which defines the next important support level.
>>> FEATURED STOCK ARTICLE : Sputtering Below 50-Day Moving Average Again - 3/27/2018 |
View all notes |
Set NEW NOTE alert |
Company Profile |
SEC
News |
Chart |
Request a new note
C
A
S
I |
OLLI
-
NASDAQ
Ollie's Bargain Outlet
Retail-DiscountandVariety
|
$61.80
|
+1.60
2.66% |
$61.85
|
751,958
117.68% of 50 DAV
50 DAV is 639,000
|
$63.75
-3.06%
|
4/10/2018
|
$62.05
|
PP = $62.15
|
|
MB = $65.26
|
Most Recent Note - 4/16/2018 12:55:15 PM
Y - Encountered distributional pressure and finished unchanged on 4/11/18 after hitting a new all-time high. Confirming gains above the pivot point backed by at least +40% above average volume are needed to trigger a proper technical buy signal.
>>> FEATURED STOCK ARTICLE : Encountered Distribution, Finished Below Pivot Point After Early Gain - 4/11/2018 |
View all notes |
Set NEW NOTE alert |
Company Profile |
SEC
News |
Chart |
Request a new note
C
A
S
I |
WB
-
NASDAQ
Weibo Corp Cl A Ads
INTERNET - Content
|
$116.55
|
+2.37
2.08% |
$118.58
|
1,416,876
69.35% of 50 DAV
50 DAV is 2,043,000
|
$142.12
-17.99%
|
1/16/2018
|
$126.33
|
PP = $122.21
|
|
MB = $128.32
|
Most Recent Note - 4/13/2018 1:24:02 PM
G - Pulling back on higher volume today. Met resistance near its 50 DMA line ($126.72), but gains above that short-term average are still needed for its outlook to improve. Prior lows in the $109 area define near-term support above its 200 DMA line ($106).
>>> FEATURED STOCK ARTICLE : Quietly Slumping Near Prior Low - 4/6/2018 |
View all notes |
Set NEW NOTE alert |
Company Profile |
SEC
News |
Chart |
Request a new note
C
A
S
I |
Symbol/Exchange
Company Name
Industry Group |
PRICE |
CHANGE
(%Change) |
Day High |
Volume
(% DAV)
(% 50 day avg vol) |
52 Wk Hi
% From Hi |
Featured
Date |
Price
Featured |
Pivot Featured |
|
Max Buy |
SQ
-
NYSE
Square Inc Cl A
Finance-CrdtCard/PmtPr
|
$47.03
|
-0.47
-0.99% |
$47.90
|
7,387,512
50.04% of 50 DAV
50 DAV is 14,763,000
|
$58.46
-19.55%
|
3/5/2018
|
$49.70
|
PP = $49.66
|
|
MB = $52.14
|
Most Recent Note - 4/13/2018 5:51:49 PM
G - Pulled back and closed the week just below its 50 DMA line ($47.81). It has not formed a sound base.
>>> FEATURED STOCK ARTICLE : Slumped Back Into Prior Base Testing 50-Day Average - 4/2/2018 |
View all notes |
Set NEW NOTE alert |
Company Profile |
SEC
News |
Chart |
Request a new note
C
A
S
I |
SEND
-
NYSE
Sendgrid Inc
INTERNET - Content
|
$27.00
|
-0.34
-1.24% |
$27.62
|
309,307
87.37% of 50 DAV
50 DAV is 354,000
|
$32.03
-15.69%
|
3/6/2018
|
$28.00
|
PP = $28.37
|
|
MB = $29.79
|
Most Recent Note - 4/12/2018 5:22:04 PM
G - Rebounded above its 50 DMA line ($26.47) with today's 3rd consecutive gain on near average volume. Priced a new Public Offering and Secondary Offering on 4/05/18.
>>> FEATURED STOCK ARTICLE : Slumped Into Prior Base Testing 50-Day Average - 4/3/2018 |
View all notes |
Set NEW NOTE alert |
Company Profile |
SEC
News |
Chart |
Request a new note
C
A
S
I |
|
|
|
THESE ARE NOT BUY RECOMMENDATIONS!
Comments contained in the body of this report are technical
opinions only. The material herein has been obtained
from sources believed to be reliable and accurate, however,
its accuracy and completeness cannot be guaranteed.
This site is not an investment advisor, hence it does
not endorse or recommend any securities or other investments.
Any recommendation contained in this report may not
be suitable for all investors and it is not to be deemed
an offer or solicitation on our part with respect to
the purchase or sale of any securities. All trademarks,
service marks and trade names appearing in this report
are the property of their respective owners, and are
likewise used for identification purposes only.
This report is a service available
only to active Paid Premium Members.
You may opt-out of receiving report notifications
at any time. Questions or comments may be submitted
by writing to Premium Membership Services 665 S.E. 10 Street, Suite 201 Deerfield Beach, FL 33441-5634 or by calling 1-800-965-8307
or 954-785-1121.
|
|
|