***Last / Change / Volume data in this table is the closing quote data***
Symbol/Exchange
Company Name
Industry Group |
PRICE |
CHANGE
(%Change) |
Day High |
Volume
(% DAV)
(% 50 day avg vol) |
52 Wk Hi
% From Hi |
Featured
Date |
Price
Featured |
Pivot Featured |
|
Max Buy |
PFBC
-
NASDAQ
Preferred Bank Los Angls
BANKING - Regional - Pacific Banks
|
$65.37
|
-0.36
-0.55% |
$66.19
|
88,072
106.11% of 50 DAV
50 DAV is 83,000
|
$67.65
-3.37%
|
4/10/2018
|
$64.56
|
PP = $67.75
|
|
MB = $71.14
|
Most Recent Note - 4/16/2018 1:00:46 PM
Y - Quietly consolidating near its 50 DMA line ($64.13), holding its ground within striking distance of the new pivot point cited based on its 1/22/18 high plus 10 cents. Subsequent volume-driven gains for new highs may trigger a technical buy signal. Due to report results for the first quarter ended March 31, 2018 after the close of the market on Thursday, April 19, 2018. Volume and volatility often increase near earnings news.
>>> FEATURED STOCK ARTICLE : Bank Stock Hovering Within Striking Distance of Prior High - 4/10/2018 |
View all notes |
Set NEW NOTE alert |
Company Profile |
SEC
News |
Chart |
Request a new note
C
A
S
I |
SIVB
-
NASDAQ
S V B Financial Group
BANKING - Regional - Pacific Banks
|
$244.61
|
-1.96
-0.79% |
$249.20
|
400,786
54.68% of 50 DAV
50 DAV is 733,000
|
$271.79
-10.00%
|
3/12/2018
|
$267.79
|
PP = $263.19
|
|
MB = $276.35
|
Most Recent Note - 4/12/2018 5:15:48 PM
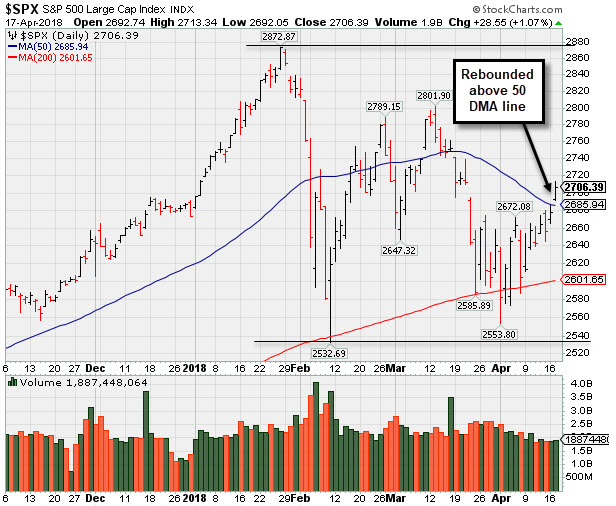
Y - Color code is changed to yellow after rebounding above the downward sloping 50 DMA line ($249.19) helping its outlook improve. Found support when recently sputtering near the prior low ($226.61 on 2/06/18). See the latest FSU analysis for more details and a new annotated graph.
>>> FEATURED STOCK ARTICLE : Rebounded Above its 50-Day Moving Average - 4/12/2018 |
View all notes |
Set NEW NOTE alert |
Company Profile |
SEC
News |
Chart |
Request a new note
C
A
S
I |
TPL
-
NYSE
Texas Pacific Land Trust
FINANCIAL SERVICES - Diversified Investments
|
$535.01
|
-6.99
-1.29% |
$548.51
|
14,216
101.54% of 50 DAV
50 DAV is 14,000
|
$569.99
-6.14%
|
4/13/2018
|
$547.85
|
PP = $552.10
|
|
MB = $579.71
|
Most Recent Note - 4/13/2018 1:14:03 PM
Y - Color code is changed to yellow with new pivot point cited based on its 2/28/18 high plus 10 cents. Subsequent gains above the pivot point with more than+40% above average volume may trigger a new (or add-on) technical buy signal. Very little resistance remains due to overhead supply up to the $569 level. Recent lows ($480) define important support where damaging losses may trigger a worrisome technical sell signal.
>>> FEATURED STOCK ARTICLE : Slump Under 50-Day Average Line Hurt Near Term Outlook - 3/23/2018 |
View all notes |
Set NEW NOTE alert |
Company Profile |
SEC
News |
Chart |
Request a new note
C
A
S
I |
LMAT
-
NASDAQ
Lemaitre Vascular Inc
Medical-Products
|
$40.75
|
-0.15
-0.37% |
$41.19
|
98,253
70.69% of 50 DAV
50 DAV is 139,000
|
$41.09
-0.83%
|
3/19/2018
|
$36.77
|
PP = $39.98
|
|
MB = $41.98
|
Most Recent Note - 4/16/2018 5:49:40 PM
Y - Posted a gain on light volume today for a new all-time high. Triggered a technical buy signal as it posted a solid gain on 4/11/18 with +87% above average volume, rising above the new pivot point cited based on its 10/20/17 high plus 10 cents. Found support recently near its 50 DMA line ($36.28). See the latest FSU analysis for more details and an annotated graph.
>>> FEATURED STOCK ARTICLE : Gain With Heavy Volume Triggered Technical Buy Signal - 4/13/2018 |
View all notes |
Set NEW NOTE alert |
Company Profile |
SEC
News |
Chart |
Request a new note
C
A
S
I |
DPZ
-
NYSE
Dominos Pizza Inc
WHOLESALE - Food Wholesale
|
$237.16
|
+4.81
2.07% |
$238.92
|
414,132
43.14% of 50 DAV
50 DAV is 960,000
|
$236.93
0.10%
|
2/20/2018
|
$224.86
|
PP = $222.01
|
|
MB = $233.11
|
Most Recent Note - 4/16/2018 12:41:59 PM
Y - Volume totals have been cooling in recent weeks while hovering in a tight trading range near its all-time high. Made limited headway since highlighted in the 2/20/18 mid-day report with pivot point cited based on its 1/25/18 high plus 10 cents. Its 50 DMA line ($224.48) defines near-term support to watch.
>>> FEATURED STOCK ARTICLE : Popular Pizza Firm Perched Near All Time High - 3/21/2018 |
View all notes |
Set NEW NOTE alert |
Company Profile |
SEC
News |
Chart |
Request a new note
C
A
S
I |
Symbol/Exchange
Company Name
Industry Group |
PRICE |
CHANGE
(%Change) |
Day High |
Volume
(% DAV)
(% 50 day avg vol) |
52 Wk Hi
% From Hi |
Featured
Date |
Price
Featured |
Pivot Featured |
|
Max Buy |
FIVE
-
NASDAQ
Five Below Inc
Retail-DiscountandVariety
|
$76.85
|
+0.46
0.60% |
$77.30
|
1,272,375
102.69% of 50 DAV
50 DAV is 1,239,000
|
$77.12
-0.35%
|
3/9/2018
|
$68.58
|
PP = $73.65
|
|
MB = $77.33
|
Most Recent Note - 4/16/2018 12:46:01 PM
Y - Perched near its best-ever close today. Holding its ground after big gain on 4/11/18 backed by +63% above average volume cleared the pivot point and clinched a technical buy signal. Prior highs in the $73 area define initial support to watch on pullbacks.
>>> FEATURED STOCK ARTICLE : Quietly Hovering Near All-Time High - 4/5/2018 |
View all notes |
Set NEW NOTE alert |
Company Profile |
SEC
News |
Chart |
Request a new note
C
A
S
I |
NVEE
-
NASDAQ
N V 5 Global Inc
Comml Svcs-Consulting
|
$61.85
|
+0.00
0.00% |
$63.00
|
74,158
91.55% of 50 DAV
50 DAV is 81,000
|
$64.50
-4.11%
|
4/9/2018
|
$58.35
|
PP = $59.05
|
|
MB = $62.00
|
Most Recent Note - 4/16/2018 3:12:05 PM
G - Color code is changed to green after gapping up and rising above its "max buy" level with today's big gain. Prior highs in the $58 area define initial support to watch on pullbacks. Hit a new all-time high with +95% above average volume behind its considerable 4/12/18 gain above the pivot point triggering a technical buy signal.
>>> FEATURED STOCK ARTICLE : Perched Near High After 3 Strong Quarterly Comparisons - 4/9/2018 |
View all notes |
Set NEW NOTE alert |
Company Profile |
SEC
News |
Chart |
Request a new note
C
A
S
I |
QLYS
-
NASDAQ
Qualys Inc
Computer Sftwr-Security
|
$82.85
|
+4.50
5.74% |
$83.30
|
697,068
211.87% of 50 DAV
50 DAV is 329,000
|
$79.40
4.35%
|
4/17/2018
|
$82.85
|
PP = $79.50
|
|
MB = $83.48
|
 Most Recent Note - 4/17/2018 7:27:14 PM
Y - Finished strong after highlighted in yellow with pivot point cited based on its 3/09/18 high plus 10 cents in the earlier mid-day report. Gapped up today and hit a new all-time high with a considerable volume-driven gain backed by +108% above average volume, rising from a "late stage" base. Found support at its 50 DMA line and formed a flat base pattern. Reported Dec '17 earnings +39% on +20% sales revenues, its 3rd consecutive quarter above the +25% minimum earnings guideline (C criteria). Annual earnings history (A criteria) has been strong.
>>> FEATURED STOCK ARTICLE : Quiet Consolidation Within 5% of Prior Pivot Point - 4/29/2015 |
View all notes |
Set NEW NOTE alert |
Company Profile |
SEC
News |
Chart |
Request a new note
C
A
S
I |
SPLK
-
NASDAQ
Splunk Inc
Computer Sftwr-Database
|
$107.58
|
+3.72
3.58% |
$108.01
|
1,732,093
82.44% of 50 DAV
50 DAV is 2,101,000
|
$112.66
-4.51%
|
2/15/2018
|
$96.06
|
PP = $93.68
|
|
MB = $98.36
|
Most Recent Note - 4/17/2018 7:28:40 PM
G - Posted a big gain today with lighter volume. recently found support near its 50 DMA ($99.25) line and prior high in the $97 area. More damaging losses would raise greater concerns. It has not formed a sound base.
>>> FEATURED STOCK ARTICLE : Extended After Rallying from Secondary Buy Point - 3/20/2018 |
View all notes |
Set NEW NOTE alert |
Company Profile |
SEC
News |
Chart |
Request a new note
C
A
S
I |
PAYC
-
NYSE
Paycom Software Inc
COMPUTER SOFTWARE and SERVICES - Application Software
|
$116.03
|
+4.02
3.59% |
$117.00
|
987,453
128.91% of 50 DAV
50 DAV is 766,000
|
$115.48
0.48%
|
2/15/2018
|
$95.01
|
PP = $93.61
|
|
MB = $98.29
|
Most Recent Note - 4/17/2018 1:01:04 PM
G - Hitting a new all-time high today after a brief consolidation. Its 50 DMA line ($102.92) and recent low ($101.55 on 4/04/18) define important near-term support to watch on pullbacks.
>>> FEATURED STOCK ARTICLE : Pulling Back After Negative Reversal at All-Time High Last Week - 4/4/2018 |
View all notes |
Set NEW NOTE alert |
Company Profile |
SEC
News |
Chart |
Request a new note
C
A
S
I |
Symbol/Exchange
Company Name
Industry Group |
PRICE |
CHANGE
(%Change) |
Day High |
Volume
(% DAV)
(% 50 day avg vol) |
52 Wk Hi
% From Hi |
Featured
Date |
Price
Featured |
Pivot Featured |
|
Max Buy |
GRUB
-
NYSE
Grubhub Inc
COMPUTER SOFTWARE and SERVICES - Technical and System Software
|
$103.72
|
+5.22
5.30% |
$104.45
|
2,325,991
119.47% of 50 DAV
50 DAV is 1,947,000
|
$112.41
-7.73%
|
6/21/2017
|
$47.33
|
PP = $46.94
|
|
MB = $49.29
|
Most Recent Note - 4/17/2018 12:42:56 PM
G - Rallying today after finding support at its 50 DMA line ($98.75) in recent weeks. Subsequent losses below the 50 DMA line and recent low ($94.08 on 4/04/18) would raise more serious concerns and trigger technical sell signals.
>>> FEATURED STOCK ARTICLE : Very Extended and Enduring Distributional Pressure - 3/29/2018 |
View all notes |
Set NEW NOTE alert |
Company Profile |
SEC
News |
Chart |
Request a new note
C
A
S
I |
HQY
-
NASDAQ
Healthequity Inc
COMPUTER SOFTWARE and SERVICES - Healthcare Information Service
|
$65.91
|
+1.71
2.66% |
$66.33
|
599,979
77.02% of 50 DAV
50 DAV is 779,000
|
$68.75
-4.13%
|
2/20/2018
|
$56.37
|
PP = $55.41
|
|
MB = $58.18
|
Most Recent Note - 4/16/2018 12:49:40 PM
G - Volume totals have been cooling in recent weeks while hovering near its all-time high. It is extended from any sound base. Its 50 DMA line ($58.33) defines near term support above prior highs.
>>> FEATURED STOCK ARTICLE : Bullish Action Followed Latest Earnings Report - 3/22/2018 |
View all notes |
Set NEW NOTE alert |
Company Profile |
SEC
News |
Chart |
Request a new note
C
A
S
I |
LOB
-
NASDAQ
Live Oak Bancshares Inc
Banks-Southeast
|
$28.30
|
-0.45
-1.57% |
$28.75
|
104,320
76.71% of 50 DAV
50 DAV is 136,000
|
$30.05
-5.82%
|
3/16/2018
|
$28.63
|
PP = $28.30
|
|
MB = $29.72
|
Most Recent Note - 4/16/2018 5:47:18 PM
Y - Quietly consolidating above its pivot point after testing its 50 DMA line ($27.56). Subsequent damaging losses would raise greater concerns. See the latest FSU analysis for more details and a new annotated graph.
>>> FEATURED STOCK ARTICLE : Tested Support at 50-Day Moving Average After Breakout - 4/16/2018 |
View all notes |
Set NEW NOTE alert |
Company Profile |
SEC
News |
Chart |
Request a new note
C
A
S
I |
PYPL
-
NASDAQ
Paypal Holdings Inc
Finance-CrdtCard/PmtPr
|
$80.03
|
+2.23
2.87% |
$80.43
|
7,133,086
76.58% of 50 DAV
50 DAV is 9,314,000
|
$86.32
-7.29%
|
2/1/2018
|
$80.35
|
PP = $79.49
|
|
MB = $83.46
|
Most Recent Note - 4/12/2018 5:17:20 PM
G - Rebounded near its 50 DMA line ($77.92), but a gain above that short-term average is still needed for its outlook to improve. Halted its slide above the prior low ($71.63 on 2/09/18) which defines the next important support level.
>>> FEATURED STOCK ARTICLE : Sputtering Below 50-Day Moving Average Again - 3/27/2018 |
View all notes |
Set NEW NOTE alert |
Company Profile |
SEC
News |
Chart |
Request a new note
C
A
S
I |
OLLI
-
NASDAQ
Ollie's Bargain Outlet
Retail-DiscountandVariety
|
$62.60
|
+0.80
1.29% |
$62.90
|
606,251
93.99% of 50 DAV
50 DAV is 645,000
|
$63.75
-1.80%
|
4/10/2018
|
$62.05
|
PP = $62.15
|
|
MB = $65.26
|
Most Recent Note - 4/16/2018 12:55:15 PM
Y - Encountered distributional pressure and finished unchanged on 4/11/18 after hitting a new all-time high. Confirming gains above the pivot point backed by at least +40% above average volume are needed to trigger a proper technical buy signal.
>>> FEATURED STOCK ARTICLE : Encountered Distribution, Finished Below Pivot Point After Early Gain - 4/11/2018 |
View all notes |
Set NEW NOTE alert |
Company Profile |
SEC
News |
Chart |
Request a new note
C
A
S
I |
Symbol/Exchange
Company Name
Industry Group |
PRICE |
CHANGE
(%Change) |
Day High |
Volume
(% DAV)
(% 50 day avg vol) |
52 Wk Hi
% From Hi |
Featured
Date |
Price
Featured |
Pivot Featured |
|
Max Buy |
WB
-
NASDAQ
Weibo Corp Cl A Ads
INTERNET - Content
|
$120.38
|
+3.83
3.29% |
$120.89
|
1,733,087
85.25% of 50 DAV
50 DAV is 2,033,000
|
$142.12
-15.30%
|
1/16/2018
|
$126.33
|
PP = $122.21
|
|
MB = $128.32
|
Most Recent Note - 4/13/2018 1:24:02 PM
G - Pulling back on higher volume today. Met resistance near its 50 DMA line ($126.72), but gains above that short-term average are still needed for its outlook to improve. Prior lows in the $109 area define near-term support above its 200 DMA line ($106).
>>> FEATURED STOCK ARTICLE : Quietly Slumping Near Prior Low - 4/6/2018 |
View all notes |
Set NEW NOTE alert |
Company Profile |
SEC
News |
Chart |
Request a new note
C
A
S
I |
NOVT
-
NASDAQ
Novanta Inc
Elec-Scientific/Msrng
|
$61.70
|
+3.40
5.83% |
$62.25
|
375,223
167.51% of 50 DAV
50 DAV is 224,000
|
$60.30
2.32%
|
4/17/2018
|
$60.55
|
PP = $60.40
|
|
MB = $63.42
|
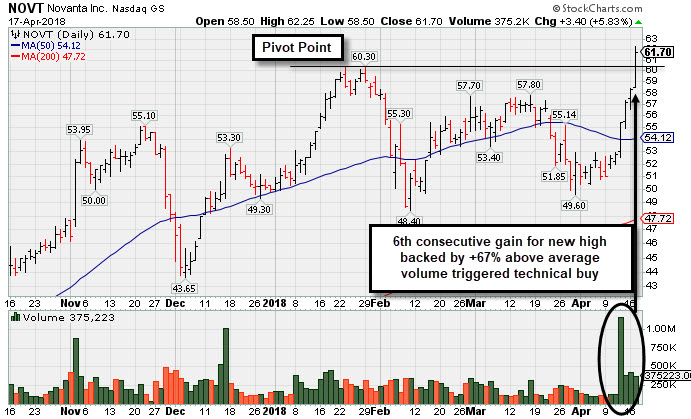
Most Recent Note - 4/17/2018 7:24:08 PM
Y - Finished strong after highlighted in yellow with pivot point cited based on its 1/29/18 high plus 10 cents in the earlier mid-day report. The big gain above the stock's pivot point backed by +67% above average volume triggered a technical buy signal. Reported earnings +26% on +49% sales revenues for the Dec '17 quarter. and 3 of the past 4 quarterly earnings comparisons were above the +25% minimum guideline (C criteria). Sales revenues growth has shown encouraging acceleration. See the latest FSU analysis for more details and an annotated graph.
>>> FEATURED STOCK ARTICLE : Volume-Driven Gain Hit New All-Time High - 4/17/2018 |
View all notes |
Set NEW NOTE alert |
Company Profile |
SEC
News |
Chart |
Request a new note
C
A
S
I |
SQ
-
NYSE
Square Inc Cl A
Finance-CrdtCard/PmtPr
|
$49.13
|
+2.10
4.47% |
$49.69
|
8,243,413
56.49% of 50 DAV
50 DAV is 14,593,000
|
$58.46
-15.96%
|
3/5/2018
|
$49.70
|
PP = $49.66
|
|
MB = $52.14
|
Most Recent Note - 4/17/2018 7:29:45 PM
G - Posted a gain with lighter than average volume today and closed above its 50 DMA line ($47.98) helping its outlook improve. It has not formed a sound base.
>>> FEATURED STOCK ARTICLE : Slumped Back Into Prior Base Testing 50-Day Average - 4/2/2018 |
View all notes |
Set NEW NOTE alert |
Company Profile |
SEC
News |
Chart |
Request a new note
C
A
S
I |
SEND
-
NYSE
Sendgrid Inc
INTERNET - Content
|
$27.80
|
+0.80
2.96% |
$28.55
|
251,986
70.39% of 50 DAV
50 DAV is 358,000
|
$32.03
-13.20%
|
3/6/2018
|
$28.00
|
PP = $28.37
|
|
MB = $29.79
|
Most Recent Note - 4/12/2018 5:22:04 PM
G - Rebounded above its 50 DMA line ($26.47) with today's 3rd consecutive gain on near average volume. Priced a new Public Offering and Secondary Offering on 4/05/18.
>>> FEATURED STOCK ARTICLE : Slumped Into Prior Base Testing 50-Day Average - 4/3/2018 |
View all notes |
Set NEW NOTE alert |
Company Profile |
SEC
News |
Chart |
Request a new note
C
A
S
I |