You are not logged in.
This means you
CAN ONLY VIEW reports that were published prior to Sunday, February 2, 2025.
You
MUST UPGRADE YOUR MEMBERSHIP if you want to see any current reports.
AFTER MARKET UPDATE - THURSDAY, APRIL 12TH, 2018
Previous After Market Report Next After Market Report >>>
|
|
|
|
DOW |
+293.60 |
24,483.05 |
+1.21% |
|
Volume |
746,184,640 |
+3% |
|
Volume |
2,019,649,140 |
+10% |
|
NASDAQ |
+71.22 |
7,140.25 |
+1.01% |
|
Advancers |
1,611 |
55% |
|
Advancers |
1,880 |
65% |
|
S&P 500 |
+21.80 |
2,663.99 |
+0.83% |
|
Decliners |
1,336 |
45% |
|
Decliners |
1,018 |
35% |
|
Russell 2000 |
+10.52 |
1,557.33 |
+0.68% |
|
52 Wk Highs |
52 |
|
|
52 Wk Highs |
71 |
|
|
S&P 600 |
+4.99 |
956.52 |
+0.52% |
|
52 Wk Lows |
41 |
|
|
52 Wk Lows |
21 |
|
|
 |
Major Indices Rose With Greater Volume and More Leadership
Kenneth J. Gruneisen - Passed the CAN SLIM® Master's Exam
Stocks finished firmly higher Thursday. The Dow added 293 points to 24483. The S&P 500 climbed 21 points to 2663 while the Nasdaq Composite was up 71 points to 7140. The volume totals reported were higher than the prior session totals on the NYSE and on the Nasdaq exchange, indicative of greater institutional buying demand. Advancers led decliners by nearly a 4-3 margin on the NYSE and nearly 2-1 on the Nasdaq exchange. Leadership improved as there were 28 high-ranked companies from the Leaders List that made new 52-week highs and were listed on the BreakOuts Page, versus the total of 13 on the prior session. New 52-week higher totals outnumbered new 52-week lows totals on both the NYSE and the Nasdaq exchange. Tuesday's big gains for all three major indices (M criteria) came with higher volume totals coupled with more stocks hitting new highs. The strong action met the definition of a follow-through day on Day 6 of the rally effort. With the new confirmed rally, buying efforts are justified when all key criteria of the fact-based investment system are satisfied. The Featured Stocks Page provides the most timely analysis on high-ranked leaders. Charts used courtesy of www.stockcharts.com
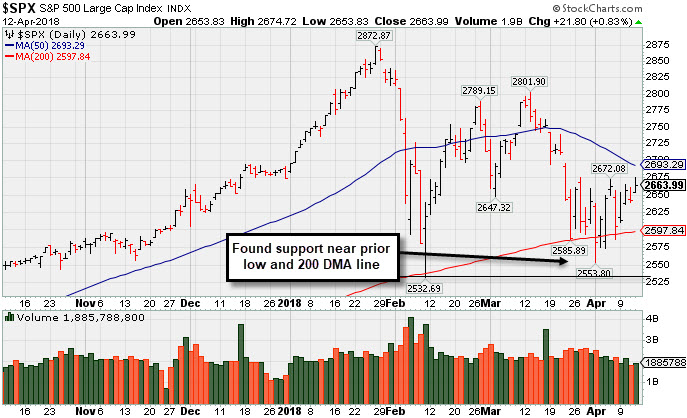 PICTURED: The S&P 500 Index halted its slide near the 200-day moving average (DMA) line and prior low which define important near-term support. Technically, more damaging losses would signal for investors to reduce market exposure.
U.S. equities advanced better than anticipated corporate earnings and easing geopolitical tensions. An update from President Trump suggested a military response in the Middle East is no longer imminent. On the data front, initial jobless claims declined by 9,000 to 233,000 in the most recent week. An update on U.S. trade showed export prices grew 0.3% in March while import prices were unchanged from the prior month.
Eight of 11 S&P 500 sectors finished higher. Financials paced gains as shares of BlackRock (BLK +1.47%) after the asset manager bested earning projections. JP Morgan Chase & Co (JPM +2.49%) rose ahead of its quarterly release before Friday’s opening bell. Industrials are also outperformed as Boeing (BA +3.09%) and Caterpillar (CAT +2.28%) climbed Chipmakers provided a market tailwind as Intel (INTC +3.17%) and Nvidia (NVDA +3.79%) rose. The rate sensitive Real Estate and Telecom sectors were down the most on the session.
Treasury yields climbed with the benchmark 10-year note finishing up five basis points to 2.83%. In commodities, NYMEX WTI crude added 0.4% to $67.18/barrel and is now up 7.3% for the week. COMEX gold fell 1.3% to $1338.40/ounce amid a stronger dollar. |
 Kenneth J. Gruneisen started out as a licensed stockbroker in August 1987, a couple of months prior to the historic stock market crash that took the Dow Jones Industrial Average down -22.6% in a single day. He has published daily fact-based fundamental and technical analysis on high-ranked stocks online for two decades. Through FACTBASEDINVESTING.COM, Kenneth provides educational articles, news, market commentary, and other information regarding proven investment systems that work in good times and bad.
Comments contained in the body of this report are technical opinions only and are not necessarily those of Gruneisen Growth Corp. The material herein has been obtained from sources believed to be reliable and accurate, however, its accuracy and completeness cannot be guaranteed. Our firm, employees, and customers may effect transactions, including transactions contrary to any recommendation herein, or have positions in the securities mentioned herein or options with respect thereto. Any recommendation contained in this report may not be suitable for all investors and it is not to be deemed an offer or solicitation on our part with respect to the purchase or sale of any securities. |
|
 |
Financial, Tech, and Retail Indexes Rose
Kenneth J. Gruneisen - Passed the CAN SLIM® Master's Exam
On Thursday the Bank Index ($BKX +2.18%) and Broker/Dealer Index ($XBD +1.39%) rose along with the Retail Index ($RLX +0.86%). The tech sector had a positive bias as the Biotech Index ($BTK +1.39%), Semiconductor Index ($SOX +1.87%), and the Networking Index ($NWX +1.18%) posted unanimous gains. The Oil Services Index ($OSX +0.98%) rose but the Integrated Oil Index ($XOI +0.07%) finished flat and the Gold & Silver Index ($XAU -1.10%) pulled back. Charts courtesy wwwstockcharts.com
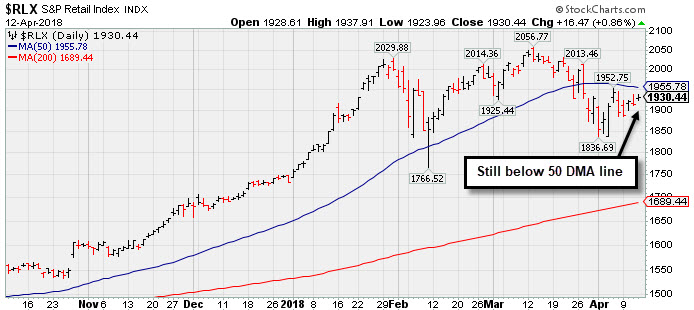 PICTURED: The Retail Index ($RLX +0.86%) is still consolidating below its 50-day moving average (DMA) line. The prior lows define important near-term support above its 200 DMA line.
| Oil Services |
$OSX |
149.77 |
+1.45 |
+0.98% |
+0.15% |
| Integrated Oil |
$XOI |
1,405.13 |
+0.96 |
+0.07% |
+5.21% |
| Semiconductor |
$SOX |
1,339.66 |
+24.60 |
+1.87% |
+6.91% |
| Networking |
$NWX |
540.48 |
+6.30 |
+1.18% |
+10.18% |
| Broker/Dealer |
$XBD |
287.33 |
+3.93 |
+1.39% |
+8.33% |
| Retail |
$RLX |
1,930.44 |
+16.47 |
+0.86% |
+11.34% |
| Gold & Silver |
$XAU |
82.76 |
-0.93 |
-1.11% |
-2.94% |
| Bank |
$BKX |
108.60 |
+2.31 |
+2.17% |
+1.77% |
| Biotech |
$BTK |
4,650.31 |
+63.64 |
+1.39% |
+10.14% |
|
|
|
 |
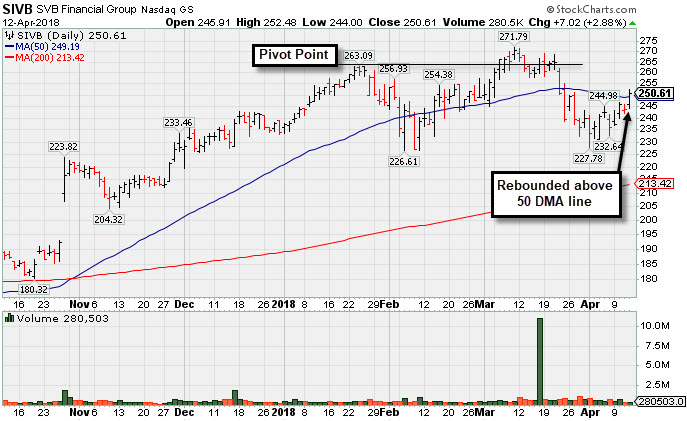
Rebounded Above its 50-Day Moving Average
Kenneth J. Gruneisen - Passed the CAN SLIM® Master's Exam
S V B Financial Group (SIVB +$6.97 or +2.86% to $250.56) found support when recently sputtering near the prior low ($226.61 on 2/06/18). Today's rebound above its downward sloping 50-day moving average (DMA) line ($249.19) helped its outlook improve.
SIVB was highlighted in yellow with pivot point cited based on its 1/24/18 high plus 10 cents in the 3/12/18 mid-day report (read here) and last appeared in this FSU section on 3/12/18 with an annotated graph under the headline, "Endured Distributional Pressure After Wedging Higher".
Recently it reported earnings +53% on +32% sales revenues for the Dec '17 quarter, marking its 4th consecutive comparison above the +25% minimum guideline (C criteria), helping it better match the fact-based investment system's guidelines. It has a great annual earnings history (A criteria).
The number of top-rated funds owning its shares rose from 761 in Mar '17 to 978 in Mar '18, a reassuring sign concerning the I criteria. Its current Up/Down Volume ratio of 2.0 is an unbiased indication its shares have been under accumulation over the past 50 days. It has earned a Timeliness rating of A and a Sponsorship Rating of C. There are only 52.9 million shares outstanding (S criteria). |
|
|
Color Codes Explained :
Y - Better candidates highlighted by our
staff of experts.
G - Previously featured
in past reports as yellow but may no longer be buyable under the
guidelines.
***Last / Change / Volume data in this table is the closing quote data***
Symbol/Exchange
Company Name
Industry Group |
PRICE |
CHANGE
(%Change) |
Day High |
Volume
(% DAV)
(% 50 day avg vol) |
52 Wk Hi
% From Hi |
Featured
Date |
Price
Featured |
Pivot Featured |
|
Max Buy |
PFBC
-
NASDAQ
Preferred Bank Los Angls
BANKING - Regional - Pacific Banks
|
$65.51
|
+1.68
2.63% |
$65.83
|
40,257
47.93% of 50 DAV
50 DAV is 84,000
|
$67.65
-3.16%
|
4/10/2018
|
$64.56
|
PP = $67.75
|
|
MB = $71.14
|
Most Recent Note - 4/10/2018 1:13:30 PM
Y - Color code is changed to yellow with pivot point cited based on its 1/22/18 high plus 10 cents. Subsequent volume-driven gains for new highs may trigger a technical buy signal. Fundamentals through Dec '17 have remained strong. Consolidating near its 50 DMA line ($64.12). It made gradual progress since dropped from the Featured Stocks list on 1/03/18.
>>> FEATURED STOCK ARTICLE : Bank Stock Hovering Within Striking Distance of Prior High - 4/10/2018 |
View all notes |
Set NEW NOTE alert |
Company Profile |
SEC
News |
Chart |
Request a new note
C
A
S
I |
SIVB
-
NASDAQ
S V B Financial Group
BANKING - Regional - Pacific Banks
|
$250.56
|
+6.97
2.86% |
$252.39
|
351,666
48.04% of 50 DAV
50 DAV is 732,000
|
$271.79
-7.81%
|
3/12/2018
|
$267.79
|
PP = $263.19
|
|
MB = $276.35
|
 Most Recent Note - 4/12/2018 5:15:48 PM
Y - Color code is changed to yellow after rebounding above the downward sloping 50 DMA line ($249.19) helping its outlook improve. Found support when recently sputtering near the prior low ($226.61 on 2/06/18). See the latest FSU analysis for more details and a new annotated graph.
>>> FEATURED STOCK ARTICLE : Rebounded Above its 50-Day Moving Average - 4/12/2018 |
View all notes |
Set NEW NOTE alert |
Company Profile |
SEC
News |
Chart |
Request a new note
C
A
S
I |
TPL
-
NYSE
Texas Pacific Land Trust
FINANCIAL SERVICES - Diversified Investments
|
$534.80
|
+9.79
1.86% |
$536.58
|
19,046
136.04% of 50 DAV
50 DAV is 14,000
|
$569.99
-6.17%
|
2/20/2018
|
$517.00
|
PP = $569.99
|
|
MB = $598.49
|
Most Recent Note - 4/10/2018 5:40:43 PM
G - Rebounded above the 50 DMA line ($515.75) helping its outlook to improve. Recent lows ($480) define important support where damaging losses may trigger a worrisome technical sell signal.
>>> FEATURED STOCK ARTICLE : Slump Under 50-Day Average Line Hurt Near Term Outlook - 3/23/2018 |
View all notes |
Set NEW NOTE alert |
Company Profile |
SEC
News |
Chart |
Request a new note
C
A
S
I |
LMAT
-
NASDAQ
Lemaitre Vascular Inc
Medical-Products
|
$40.68
|
+0.44
1.09% |
$40.89
|
116,878
83.48% of 50 DAV
50 DAV is 140,000
|
$40.75
-0.17%
|
3/19/2018
|
$36.77
|
PP = $39.98
|
|
MB = $41.98
|
Most Recent Note - 4/11/2018 6:25:16 PM
Y - Triggered a technical buy signal as it posted a solid gain today with +92% above average volume, rising above the new pivot point cited based on its 10/20/17 high plus 10 cents. Found support recently near its 50 DMA line ($35.95).
>>> FEATURED STOCK ARTICLE : Rebounding Near High After Choppy Consolidation - 3/19/2018 |
View all notes |
Set NEW NOTE alert |
Company Profile |
SEC
News |
Chart |
Request a new note
C
A
S
I |
DPZ
-
NYSE
Dominos Pizza Inc
WHOLESALE - Food Wholesale
|
$231.48
|
+0.48
0.21% |
$234.62
|
398,770
40.94% of 50 DAV
50 DAV is 974,000
|
$236.93
-2.30%
|
2/20/2018
|
$224.86
|
PP = $222.01
|
|
MB = $233.11
|
Most Recent Note - 4/11/2018 6:27:27 PM
Y - Volume totals have been cooling while hovering near its all-time high. Made limited headway since highlighted in the 2/20/18 mid-day report with pivot point cited based on its 1/25/18 high plus 10 cents. Its 50 DMA line ($223) defines near-term support to watch.
>>> FEATURED STOCK ARTICLE : Popular Pizza Firm Perched Near All Time High - 3/21/2018 |
View all notes |
Set NEW NOTE alert |
Company Profile |
SEC
News |
Chart |
Request a new note
C
A
S
I |
Symbol/Exchange
Company Name
Industry Group |
PRICE |
CHANGE
(%Change) |
Day High |
Volume
(% DAV)
(% 50 day avg vol) |
52 Wk Hi
% From Hi |
Featured
Date |
Price
Featured |
Pivot Featured |
|
Max Buy |
FIVE
-
NASDAQ
Five Below Inc
Retail-DiscountandVariety
|
$75.99
|
-0.50
-0.65% |
$77.12
|
1,469,360
121.13% of 50 DAV
50 DAV is 1,213,000
|
$77.03
-1.35%
|
3/9/2018
|
$68.58
|
PP = $73.65
|
|
MB = $77.33
|
Most Recent Note - 4/11/2018 12:02:12 PM
Y - Trading further into new high territory today after a big gain on the prior session backed by only +18% above average volume. New pivot point recently was cited based on its 1/05/18 high plus 10 cents. Disciplined investors know that gains above a stock's pivot point must have a minimum +40% above average volume to trigger a proper technical buy signal. See the latest FSU analysis for more details and an annotated graph.
>>> FEATURED STOCK ARTICLE : Quietly Hovering Near All-Time High - 4/5/2018 |
View all notes |
Set NEW NOTE alert |
Company Profile |
SEC
News |
Chart |
Request a new note
C
A
S
I |
NVEE
-
NASDAQ
N V 5 Global Inc
Comml Svcs-Consulting
|
$62.45
|
+4.30
7.39% |
$64.50
|
158,074
200.09% of 50 DAV
50 DAV is 79,000
|
$59.65
4.69%
|
4/9/2018
|
$58.35
|
PP = $59.05
|
|
MB = $62.00
|
Most Recent Note - 4/12/2018 12:27:46 PM
Y - Powering to a new all-time high with above average volume behind today's considerable gain clearing the new pivot point cited based on its 10/31/17 high plus 10 cents. Gains above a stock's pivot point must be backed by at least +40% above average volume to trigger a proper technical buy signal.
>>> FEATURED STOCK ARTICLE : Perched Near High After 3 Strong Quarterly Comparisons - 4/9/2018 |
View all notes |
Set NEW NOTE alert |
Company Profile |
SEC
News |
Chart |
Request a new note
C
A
S
I |
SPLK
-
NASDAQ
Splunk Inc
Computer Sftwr-Database
|
$106.39
|
+4.26
4.17% |
$106.57
|
2,486,256
120.23% of 50 DAV
50 DAV is 2,068,000
|
$112.66
-5.57%
|
2/15/2018
|
$96.06
|
PP = $93.68
|
|
MB = $98.36
|
Most Recent Note - 4/12/2018 5:20:01 PM
G - Posted a 4th consecutive gain after finding prompt support near its 50 DMA ($98.45) line and the prior high in the $97 area. More damaging losses would raise greater concerns. It has not formed a sound base.
>>> FEATURED STOCK ARTICLE : Extended After Rallying from Secondary Buy Point - 3/20/2018 |
View all notes |
Set NEW NOTE alert |
Company Profile |
SEC
News |
Chart |
Request a new note
C
A
S
I |
PAYC
-
NYSE
Paycom Software Inc
COMPUTER SOFTWARE and SERVICES - Application Software
|
$111.46
|
-0.81
-0.72% |
$112.62
|
589,503
77.57% of 50 DAV
50 DAV is 760,000
|
$115.48
-3.48%
|
2/15/2018
|
$95.01
|
PP = $93.61
|
|
MB = $98.29
|
Most Recent Note - 4/10/2018 5:44:14 PM
G - Its 50 DMA line ($100.78) defines near-term support above prior highs in the $93 area. Fundamentals remain strong.
>>> FEATURED STOCK ARTICLE : Pulling Back After Negative Reversal at All-Time High Last Week - 4/4/2018 |
View all notes |
Set NEW NOTE alert |
Company Profile |
SEC
News |
Chart |
Request a new note
C
A
S
I |
GRUB
-
NYSE
Grubhub Inc
COMPUTER SOFTWARE and SERVICES - Technical and System Software
|
$99.90
|
+1.58
1.61% |
$100.39
|
656,821
33.07% of 50 DAV
50 DAV is 1,986,000
|
$112.41
-11.13%
|
6/21/2017
|
$47.33
|
PP = $46.94
|
|
MB = $49.29
|
Most Recent Note - 4/10/2018 5:42:47 PM
G - Found support at its 50 DMA line ($96.06) recently. More damaging losses below the 50 DMA line and recent low ($94.08 on 4/04/18) would raise greater concerns.
>>> FEATURED STOCK ARTICLE : Very Extended and Enduring Distributional Pressure - 3/29/2018 |
View all notes |
Set NEW NOTE alert |
Company Profile |
SEC
News |
Chart |
Request a new note
C
A
S
I |
Symbol/Exchange
Company Name
Industry Group |
PRICE |
CHANGE
(%Change) |
Day High |
Volume
(% DAV)
(% 50 day avg vol) |
52 Wk Hi
% From Hi |
Featured
Date |
Price
Featured |
Pivot Featured |
|
Max Buy |
HQY
-
NASDAQ
Healthequity Inc
COMPUTER SOFTWARE and SERVICES - Healthcare Information Service
|
$64.24
|
+0.81
1.28% |
$64.63
|
420,835
54.23% of 50 DAV
50 DAV is 776,000
|
$68.75
-6.56%
|
2/20/2018
|
$56.37
|
PP = $55.41
|
|
MB = $58.18
|
Most Recent Note - 4/10/2018 5:37:17 PM
G - Volume totals have been cooling while still hovering near its all-time high, extended from any sound base. Its 50 DMA line ($57.30) defines near term support above prior highs.
>>> FEATURED STOCK ARTICLE : Bullish Action Followed Latest Earnings Report - 3/22/2018 |
View all notes |
Set NEW NOTE alert |
Company Profile |
SEC
News |
Chart |
Request a new note
C
A
S
I |
LOB
-
NASDAQ
Live Oak Bancshares Inc
Banks-Southeast
|
$29.05
|
+0.35
1.22% |
$29.30
|
74,865
53.86% of 50 DAV
50 DAV is 139,000
|
$30.05
-3.33%
|
3/16/2018
|
$28.63
|
PP = $28.30
|
|
MB = $29.72
|
Most Recent Note - 4/12/2018 5:18:48 PM
Y - Quietly consolidating above its pivot point after testing its 50 DMA line ($27.49). Subsequent damaging losses would raise greater concerns.
>>> FEATURED STOCK ARTICLE : Tallied Volume-Driven Gain for New High - 3/16/2018 |
View all notes |
Set NEW NOTE alert |
Company Profile |
SEC
News |
Chart |
Request a new note
C
A
S
I |
PYPL
-
NASDAQ
Paypal Holdings Inc
Finance-CrdtCard/PmtPr
|
$77.46
|
+0.96
1.25% |
$77.99
|
4,848,313
46.88% of 50 DAV
50 DAV is 10,341,000
|
$86.32
-10.26%
|
2/1/2018
|
$80.35
|
PP = $79.49
|
|
MB = $83.46
|
Most Recent Note - 4/12/2018 5:17:20 PM
G - Rebounded near its 50 DMA line ($77.92), but a gain above that short-term average is still needed for its outlook to improve. Halted its slide above the prior low ($71.63 on 2/09/18) which defines the next important support level.
>>> FEATURED STOCK ARTICLE : Sputtering Below 50-Day Moving Average Again - 3/27/2018 |
View all notes |
Set NEW NOTE alert |
Company Profile |
SEC
News |
Chart |
Request a new note
C
A
S
I |
OLLI
-
NASDAQ
Ollie's Bargain Outlet
Retail-DiscountandVariety
|
$61.60
|
-0.45
-0.73% |
$63.35
|
633,792
99.34% of 50 DAV
50 DAV is 638,000
|
$63.75
-3.37%
|
4/10/2018
|
$62.05
|
PP = $62.15
|
|
MB = $65.26
|
Most Recent Note - 4/11/2018 6:23:32 PM
Y - Encountered distributional pressure and finished unchanged after hitting a new all-time high today. Posted a big gain for a new high backed by +66% above average volume on the prior session. See the latest FSU analysis for more details and a new annotated graph.
>>> FEATURED STOCK ARTICLE : Encountered Distribution, Finished Below Pivot Point After Early Gain - 4/11/2018 |
View all notes |
Set NEW NOTE alert |
Company Profile |
SEC
News |
Chart |
Request a new note
C
A
S
I |
WB
-
NASDAQ
Weibo Corp Cl A Ads
INTERNET - Content
|
$122.59
|
-1.32
-1.07% |
$125.39
|
920,868
45.61% of 50 DAV
50 DAV is 2,019,000
|
$142.12
-13.74%
|
1/16/2018
|
$126.33
|
PP = $122.21
|
|
MB = $128.32
|
Most Recent Note - 4/10/2018 5:35:02 PM
G - Stayed well above the 200 DMA line. It has rebounded toward its 50 DMA line ($127.30), but gains above that short-term average are still needed for its outlook to improve. See the latest FSU analysis for more details and an annotated graph.
>>> FEATURED STOCK ARTICLE : Quietly Slumping Near Prior Low - 4/6/2018 |
View all notes |
Set NEW NOTE alert |
Company Profile |
SEC
News |
Chart |
Request a new note
C
A
S
I |
Symbol/Exchange
Company Name
Industry Group |
PRICE |
CHANGE
(%Change) |
Day High |
Volume
(% DAV)
(% 50 day avg vol) |
52 Wk Hi
% From Hi |
Featured
Date |
Price
Featured |
Pivot Featured |
|
Max Buy |
SQ
-
NYSE
Square Inc Cl A
Finance-CrdtCard/PmtPr
|
$49.69
|
+1.93
4.04% |
$50.14
|
10,435,355
70.32% of 50 DAV
50 DAV is 14,839,000
|
$58.46
-15.00%
|
3/5/2018
|
$49.70
|
PP = $49.66
|
|
MB = $52.14
|
Most Recent Note - 4/12/2018 5:20:55 PM
G - Rebounded further above the 50 DMA line ($47.80) with a quiet gain today. It has not formed a sound base.
>>> FEATURED STOCK ARTICLE : Slumped Back Into Prior Base Testing 50-Day Average - 4/2/2018 |
View all notes |
Set NEW NOTE alert |
Company Profile |
SEC
News |
Chart |
Request a new note
C
A
S
I |
SEND
-
NYSE
Sendgrid Inc
INTERNET - Content
|
$27.20
|
+0.85
3.23% |
$27.64
|
389,073
111.16% of 50 DAV
50 DAV is 350,000
|
$32.03
-15.07%
|
3/6/2018
|
$28.00
|
PP = $28.37
|
|
MB = $29.79
|
Most Recent Note - 4/12/2018 5:22:04 PM
G - Rebounded above its 50 DMA line ($26.47) with today's 3rd consecutive gain on near average volume. Priced a new Public Offering and Secondary Offering on 4/05/18.
>>> FEATURED STOCK ARTICLE : Slumped Into Prior Base Testing 50-Day Average - 4/3/2018 |
View all notes |
Set NEW NOTE alert |
Company Profile |
SEC
News |
Chart |
Request a new note
C
A
S
I |
|
|
|
THESE ARE NOT BUY RECOMMENDATIONS!
Comments contained in the body of this report are technical
opinions only. The material herein has been obtained
from sources believed to be reliable and accurate, however,
its accuracy and completeness cannot be guaranteed.
This site is not an investment advisor, hence it does
not endorse or recommend any securities or other investments.
Any recommendation contained in this report may not
be suitable for all investors and it is not to be deemed
an offer or solicitation on our part with respect to
the purchase or sale of any securities. All trademarks,
service marks and trade names appearing in this report
are the property of their respective owners, and are
likewise used for identification purposes only.
This report is a service available
only to active Paid Premium Members.
You may opt-out of receiving report notifications
at any time. Questions or comments may be submitted
by writing to Premium Membership Services 665 S.E. 10 Street, Suite 201 Deerfield Beach, FL 33441-5634 or by calling 1-800-965-8307
or 954-785-1121.
|
|
|