***Last / Change / Volume data in this table is the closing quote data***
Symbol/Exchange
Company Name
Industry Group |
PRICE |
CHANGE
(%Change) |
Day High |
Volume
(% DAV)
(% 50 day avg vol) |
52 Wk Hi
% From Hi |
Featured
Date |
Price
Featured |
Pivot Featured |
|
Max Buy |
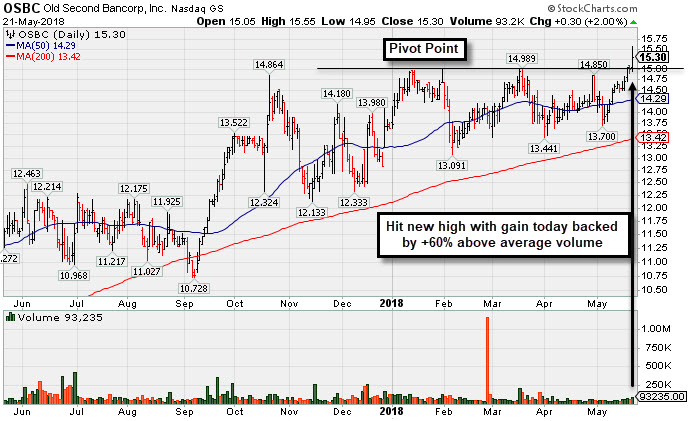
OSBC
-
NASDAQ
Old Second Bancorp Inc
BANKING - Regional - Midwest Banks
|
$15.30
|
+0.30
2.00% |
$15.55
|
93,235
160.75% of 50 DAV
50 DAV is 58,000
|
$15.10
1.32%
|
5/21/2018
|
$15.50
|
PP = $15.10
|
|
MB = $15.86
|
 Most Recent Note - 5/21/2018 5:01:14 PM
Y - Color code was changed to yellow with pivot point cited based on prior highs plus 10 cents. Hit a new 52-week high with today's big gain backed by +60% above average volume. Found support above its 200 DMA line during its long and orderly consolidation. Reported earnings +69% on +15% sales revenues for the Mar '18 quarter, its 5th consecutive quarterly comparison with earnings above the +25% minimum guideline (C criteria). Annual earnings history has been a good match with the fact-based investment system's guidelines (A criteria). See the latest FSU analysis for more details and a new annotated graph.
>>> FEATURED STOCK ARTICLE : Hit New High Today After Orderly Consolidation - 5/21/2018 |
View all notes |
Set NEW NOTE alert |
Company Profile |
SEC
News |
Chart |
Request a new note
C
A
S
I |
PFBC
-
NASDAQ
Preferred Bank Los Angls
BANKING - Regional - Pacific Banks
|
$64.52
|
+1.61
2.56% |
$64.59
|
76,221
90.96% of 50 DAV
50 DAV is 83,800
|
$67.65
-4.63%
|
5/18/2018
|
$62.91
|
PP = $67.75
|
|
MB = $71.14
|
Most Recent Note - 5/21/2018 3:53:43 PM
Y - Rising near its 50 DMA line ($64.60) with today's gain backed by below average volume. Gain above the 50 DMA line are needed for its outlook to improve. Its Relative Strength rating has slumped below the 80+ minimum guideline to 66, yet it remains only -4.9% off its high. Despite concerns its color code was changed to yellow with new pivot point cited based on its 1/22/18 high plus 10 cents. Subsequent gains above the pivot point are needed to trigger a technical buy signal. See the latest FSU analysis for more details and an annotated graph.
>>> FEATURED STOCK ARTICLE : Some Technical Sputtering Yet Bank is Still Only -7% Off High - 5/18/2018 |
View all notes |
Set NEW NOTE alert |
Company Profile |
SEC
News |
Chart |
Request a new note
C
A
S
I |
SIVB
-
NASDAQ
S V B Financial Group
BANKING - Regional - Pacific Banks
|
$322.20
|
+0.42
0.13% |
$326.23
|
467,619
57.52% of 50 DAV
50 DAV is 813,000
|
$325.93
-1.14%
|
3/12/2018
|
$267.79
|
PP = $263.19
|
|
MB = $276.35
|
Most Recent Note - 5/15/2018 5:37:23 PM
G - Still stubbornly holding its ground and quietly edging higher after a big "breakaway gap" for a new high on 4/27/18. Bullish action came after it reported financial results for the quarter ended March 31, 2018 and earnings rose +90% on +34% sales revenues versus the year ago period.
>>> FEATURED STOCK ARTICLE : Rebounded Above its 50-Day Moving Average - 4/12/2018 |
View all notes |
Set NEW NOTE alert |
Company Profile |
SEC
News |
Chart |
Request a new note
C
A
S
I |
EPAM
-
NYSE
Epam Systems Inc
COMPUTER SOFTWARE and SERVICES - Information Technology Service
|
$125.73
|
-0.68
-0.54% |
$127.57
|
124,493
38.66% of 50 DAV
50 DAV is 322,000
|
$131.75
-4.57%
|
5/9/2018
|
$120.34
|
PP = $125.98
|
|
MB = $132.28
|
Most Recent Note - 5/21/2018 3:35:47 PM
Y - Following a breakout marked by 3 consecutive volume-driven gains it is quietly consolidating near the prior high ($125.88 on 3/13/18). Additional near-term support is defined by prior highs in the $119 area and its 50 DMA line ($117.67).
>>> FEATURED STOCK ARTICLE : Volume-Driven Gain Challenged Prior High Following Earnings - 5/9/2018 |
View all notes |
Set NEW NOTE alert |
Company Profile |
SEC
News |
Chart |
Request a new note
C
A
S
I |
MA
-
NYSE
Mastercard Inc Cl A
DIVERSIFIED SERVICES - Business/Management Services
|
$191.20
|
+0.80
0.42% |
$192.83
|
2,631,731
66.88% of 50 DAV
50 DAV is 3,935,000
|
$194.72
-1.81%
|
5/2/2018
|
$184.96
|
PP = $183.83
|
|
MB = $193.02
|
Most Recent Note - 5/16/2018 2:15:20 PM
Y - Stubbornly holding its ground near its "max buy" level and all-time high. Tallied an impressive streak of gains since breaking out on 5/02/18 from a riskier "late stage" base. Prior highs in the $183 area define initial support to watch on pullbacks.
>>> FEATURED STOCK ARTICLE : Gap Up and Volume Driven Gain for New High After Earnings - 5/2/2018 |
View all notes |
Set NEW NOTE alert |
Company Profile |
SEC
News |
Chart |
Request a new note
C
A
S
I |
Symbol/Exchange
Company Name
Industry Group |
PRICE |
CHANGE
(%Change) |
Day High |
Volume
(% DAV)
(% 50 day avg vol) |
52 Wk Hi
% From Hi |
Featured
Date |
Price
Featured |
Pivot Featured |
|
Max Buy |
V
-
NYSE
Visa Inc Cl A
DIVERSIFIED SERVICES - Business/Management Services
|
$130.66
|
+0.73
0.56% |
$131.51
|
5,542,031
71.22% of 50 DAV
50 DAV is 7,782,000
|
$132.50
-1.39%
|
4/26/2018
|
$126.68
|
PP = $126.98
|
|
MB = $133.33
|
Most Recent Note - 5/16/2018 2:09:02 PM
Y - Stubbornly holding its ground and inching higher after a technical breakout noted in the 4/26/18 mid-day report. Reported earnings +29% on +13% sales revenues for the Mar '18 quarter, and 3 of the past 4 quarterly comparisons were above the +25% minimum earnings guideline (C criteria).
>>> FEATURED STOCK ARTICLE : Volume-Driven Gain For New High Triggered Technical Buy Signal - 4/26/2018 |
View all notes |
Set NEW NOTE alert |
Company Profile |
SEC
News |
Chart |
Request a new note
C
A
S
I |
TPL
-
NYSE
Texas Pacific Land Trust
FINANCIAL SERVICES - Diversified Investments
|
$702.05
|
+18.77
2.75% |
$707.00
|
21,912
121.73% of 50 DAV
50 DAV is 18,000
|
$704.00
-0.28%
|
4/13/2018
|
$547.85
|
PP = $552.10
|
|
MB = $579.71
|
Most Recent Note - 5/21/2018 3:55:03 PM
G - Hitting another new all-time high today, very extended from the prior base. Prior highs in the $569-552 area define initial support to watch along with its 50 DMA line ($560).
>>> FEATURED STOCK ARTICLE : Perched Near Prior High After Showing Resilience - 4/20/2018 |
View all notes |
Set NEW NOTE alert |
Company Profile |
SEC
News |
Chart |
Request a new note
C
A
S
I |
STMP
-
NASDAQ
Stamps.com Inc
INTERNET - Internet Software and Services
|
$248.90
|
+0.90
0.36% |
$252.00
|
188,760
59.92% of 50 DAV
50 DAV is 315,000
|
$251.50
-1.03%
|
5/4/2018
|
$234.15
|
PP = $233.23
|
|
MB = $244.89
|
Most Recent Note - 5/16/2018 2:07:51 PM
G - Holding its ground with volume totals cooling while perched at its all-time high. Extended from prior highs in the $233 area which define initial support above its 50 DMA line ($215).
>>> FEATURED STOCK ARTICLE : Volume-Driven Gain For New High - 5/4/2018 |
View all notes |
Set NEW NOTE alert |
Company Profile |
SEC
News |
Chart |
Request a new note
C
A
S
I |
CHDN
-
NASDAQ
Churchill Downs Inc
LEISURE - Gaming Activities
|
$310.55
|
+0.90
0.29% |
$312.98
|
119,826
107.95% of 50 DAV
50 DAV is 111,000
|
$314.60
-1.29%
|
5/14/2018
|
$285.80
|
PP = $285.80
|
|
MB = $300.09
|
Most Recent Note - 5/18/2018 12:26:36 PM
G - Quickly rallied above its "max buy" level getting extended from the previously noted base. Prior highs in the $285-279 area define initial support to watch on pullbacks.
>>> FEATURED STOCK ARTICLE : Breakout Followed New Supreme Court Ruling on Sports Betting - 5/14/2018 |
View all notes |
Set NEW NOTE alert |
Company Profile |
SEC
News |
Chart |
Request a new note
C
A
S
I |
HTHT
-
NASDAQ
China Lodging Group Ads
LEISURE - Lodging
|
$175.05
|
+1.12
0.64% |
$175.97
|
619,186
105.48% of 50 DAV
50 DAV is 587,000
|
$174.50
0.32%
|
5/15/2018
|
$138.07
|
PP = $166.29
|
|
MB = $174.60
|
Most Recent Note - 5/16/2018 12:49:36 PM
Y - Holding its ground today while on track for a 9th consecutive gain. Finished strong on the prior session after highlighted in yellow with new pivot point cited based on its 1/22/18 high plus 10 cents. The strong finish above the pivot point clinched a convincing new technical buy signal. Found support at its 200 DMA line and rebounded after dropped from the Featured Stocks list on 3/27/18. See the latest FSU analysis for more detailed analysis and an annotated graph.
>>> FEATURED STOCK ARTICLE : New Volume-Driven Breakout For All-Time High - 5/15/2018 |
View all notes |
Set NEW NOTE alert |
Company Profile |
SEC
News |
Chart |
Request a new note
C
A
S
I |
Symbol/Exchange
Company Name
Industry Group |
PRICE |
CHANGE
(%Change) |
Day High |
Volume
(% DAV)
(% 50 day avg vol) |
52 Wk Hi
% From Hi |
Featured
Date |
Price
Featured |
Pivot Featured |
|
Max Buy |
DPZ
-
NYSE
Dominos Pizza Inc
WHOLESALE - Food Wholesale
|
$248.37
|
+3.51
1.43% |
$249.28
|
535,332
85.24% of 50 DAV
50 DAV is 628,000
|
$255.00
-2.60%
|
5/21/2018
|
$248.13
|
PP = $255.10
|
|
MB = $267.86
|
Most Recent Note - 5/21/2018 3:31:43 PM
Y - Color code is changed to yellow with new pivot point cited based on its 4/26/18 high plus 10 cents after an advanced "3-weeks tight" base. Subsequent volume-driven gains above the pivot point may trigger a new (or add-on) technical buy signal. Its 50 DMA line ($237) and prior highs in the $236 area define important near-term support to watch on pullbacks.
>>> FEATURED STOCK ARTICLE : Earnings News Due From Pizza Firm - 4/23/2018 |
View all notes |
Set NEW NOTE alert |
Company Profile |
SEC
News |
Chart |
Request a new note
C
A
S
I |
FIVE
-
NASDAQ
Five Below Inc
Retail-DiscountandVariety
|
$73.22
|
-1.61
-2.15% |
$75.46
|
1,329,673
88.53% of 50 DAV
50 DAV is 1,502,000
|
$78.28
-6.46%
|
3/9/2018
|
$68.58
|
PP = $73.65
|
|
MB = $77.33
|
Most Recent Note - 5/21/2018 3:38:56 PM
Y - Volume totals have been below average in recent weeks while consolidating near its 50 DMA line ($72.06) which acted as support after noted distributional pressure. Subsequent damaging losses below the recent low ($69.37 on 5/02/18) may trigger a more worrisome technical sell signal.
>>> FEATURED STOCK ARTICLE : Trading Near 50-Day Average After Falling Into Prior Base - 5/7/2018 |
View all notes |
Set NEW NOTE alert |
Company Profile |
SEC
News |
Chart |
Request a new note
C
A
S
I |
NOW
-
NYSE
Servicenow Inc
Computer Sftwr-Enterprse
|
$171.45
|
-2.49
-1.43% |
$177.37
|
1,076,701
53.70% of 50 DAV
50 DAV is 2,005,000
|
$182.59
-6.10%
|
5/8/2018
|
$174.63
|
PP = $176.66
|
|
MB = $185.49
|
Most Recent Note - 5/15/2018 5:33:57 PM
Y - It stalled after highlighted in yellow with pivot point cited based on its 3/14/18 high plus 10 cents in the 5/08/18 mid-day report. Subsequent gains backed by at least +40% above average volume while rising above the pivot point may trigger a technical buy signal.
>>> FEATURED STOCK ARTICLE : High-Ranked Software - Enterprise Firm is Near Pivot Point - 5/8/2018 |
View all notes |
Set NEW NOTE alert |
Company Profile |
SEC
News |
Chart |
Request a new note
C
A
S
I |
NVEE
-
NASDAQ
N V 5 Global Inc
Comml Svcs-Consulting
|
$60.60
|
+0.70
1.17% |
$60.80
|
43,354
48.17% of 50 DAV
50 DAV is 90,000
|
$71.90
-15.72%
|
4/9/2018
|
$58.35
|
PP = $59.05
|
|
MB = $62.00
|
Most Recent Note - 5/16/2018 2:20:48 PM
Y -Losses on light volume recently tested support defined by its 50 DMA line and prior highs in the $58-59 area. More damaging losses would raise greater concerns. Reported earnings +51% on +48% sales revenues for the Mar '18 quarter, continuing its strong earnings track record.
>>> FEATURED STOCK ARTICLE : Encountered Distributional Pressure After Hitting New High - 5/11/2018 |
View all notes |
Set NEW NOTE alert |
Company Profile |
SEC
News |
Chart |
Request a new note
C
A
S
I |
QLYS
-
NASDAQ
Qualys Inc
Computer Sftwr-Security
|
$76.50
|
-0.80
-1.03% |
$78.35
|
180,068
57.35% of 50 DAV
50 DAV is 314,000
|
$85.00
-10.00%
|
4/17/2018
|
$82.85
|
PP = $79.50
|
|
MB = $83.48
|
Most Recent Note - 5/15/2018 5:36:36 PM
Y - Still sputtering near its 50 DMA line ($76.72) and below its pivot point. Recently reported earnings +80% on +22% sales revenues for the Mar '18 quarter, continuing its strong earnings track record.
>>> FEATURED STOCK ARTICLE : Quickly Rallied More Than 5% Above Prior High - 4/18/2018 |
View all notes |
Set NEW NOTE alert |
Company Profile |
SEC
News |
Chart |
Request a new note
C
A
S
I |
Symbol/Exchange
Company Name
Industry Group |
PRICE |
CHANGE
(%Change) |
Day High |
Volume
(% DAV)
(% 50 day avg vol) |
52 Wk Hi
% From Hi |
Featured
Date |
Price
Featured |
Pivot Featured |
|
Max Buy |
SPLK
-
NASDAQ
Splunk Inc
Computer Sftwr-Database
|
$114.90
|
-1.80
-1.54% |
$119.00
|
1,552,365
90.78% of 50 DAV
50 DAV is 1,710,000
|
$117.86
-2.51%
|
5/8/2018
|
$113.14
|
PP = $112.76
|
|
MB = $118.40
|
Most Recent Note - 5/21/2018 3:28:01 PM
Y - Quietly touched a new all-time high today but reversed into the red. Recent gains above the stock's pivot point did not meet the required volume threshold of at least +40% above average volume needed to trigger a proper technical buy signal. Due to report earnings for its fiscal first quarter ended April 30, 2018 on Thursday, May 24, 2018 after the market close. Volume and volatility often increase near earnings news.
>>> FEATURED STOCK ARTICLE : Found Support Near 50-Day Average on Pullbacks - 4/19/2018 |
View all notes |
Set NEW NOTE alert |
Company Profile |
SEC
News |
Chart |
Request a new note
C
A
S
I |
SUPN
-
NASDAQ
Supernus Pharmaceuticals
Medical-Biomed/Biotech
|
$55.00
|
-1.10
-1.96% |
$56.10
|
1,143,227
147.32% of 50 DAV
50 DAV is 776,000
|
$59.05
-6.86%
|
4/24/2018
|
$47.73
|
PP = $50.15
|
|
MB = $52.66
|
Most Recent Note - 5/21/2018 12:55:19 PM
G - Pulling back from its all-time high with today's 3rd consecutive loss after getting extended from the previously noted base. Prior highs in the $49-50 area define initial support to watch.
>>> FEATURED STOCK ARTICLE : Pharmaceutical Firm Perched Near Record High - 4/24/2018 |
View all notes |
Set NEW NOTE alert |
Company Profile |
SEC
News |
Chart |
Request a new note
C
A
S
I |
PAYC
-
NYSE
Paycom Software Inc
COMPUTER SOFTWARE and SERVICES - Application Software
|
$102.70
|
-0.82
-0.79% |
$104.81
|
507,974
68.09% of 50 DAV
50 DAV is 746,000
|
$118.45
-13.30%
|
2/15/2018
|
$95.01
|
PP = $93.61
|
|
MB = $98.29
|
Most Recent Note - 5/21/2018 3:48:47 PM
G - Halted its slide last week after undercutting prior lows in the $101 area, but more damaging losses would raise greater concerns. A rebound above the 50 DMA line ($109.19) is needed for its outlook to improve.
>>> FEATURED STOCK ARTICLE : Violation of 50-Day Average Triggered Technical Sell Signal - 5/3/2018 |
View all notes |
Set NEW NOTE alert |
Company Profile |
SEC
News |
Chart |
Request a new note
C
A
S
I |
GRUB
-
NYSE
Grubhub Inc
COMPUTER SOFTWARE and SERVICES - Technical and System Software
|
$103.68
|
-0.12
-0.12% |
$106.59
|
1,114,377
73.60% of 50 DAV
50 DAV is 1,514,000
|
$112.41
-7.77%
|
6/21/2017
|
$47.33
|
PP = $46.94
|
|
MB = $49.29
|
Most Recent Note - 5/15/2018 5:29:33 PM
G - Consolidating quietly just below its 50 DMA line ($102.25). Faces resistance due to overhead supply up to the $112 level. Recently reported earnings +79% on +49% sales revenues for the Mar '18 quarter.
>>> FEATURED STOCK ARTICLE : Consolidating Near 50 Day Average With Earnings News Due - 4/30/2018 |
View all notes |
Set NEW NOTE alert |
Company Profile |
SEC
News |
Chart |
Request a new note
C
A
S
I |
HQY
-
NASDAQ
Healthequity Inc
COMPUTER SOFTWARE and SERVICES - Healthcare Information Service
|
$74.35
|
+0.63
0.85% |
$76.76
|
395,751
66.51% of 50 DAV
50 DAV is 595,000
|
$73.83
0.70%
|
5/2/2018
|
$66.31
|
PP = $68.85
|
|
MB = $72.29
|
Most Recent Note - 5/16/2018 2:10:56 PM
Y - Volume totals still have been below average while wedging into new all-time high territory. Gains above a stock's pivot point must have at least +40% above average volume to trigger a proper new (or add-on) technical buy signal. Its 50 DMA line ($64.56) defines near term support above the recent low ($59.50 on 4/03/18).
>>> FEATURED STOCK ARTICLE : Perched Near All-Time High Building a Short New Base - 4/25/2018 |
View all notes |
Set NEW NOTE alert |
Company Profile |
SEC
News |
Chart |
Request a new note
C
A
S
I |
Symbol/Exchange
Company Name
Industry Group |
PRICE |
CHANGE
(%Change) |
Day High |
Volume
(% DAV)
(% 50 day avg vol) |
52 Wk Hi
% From Hi |
Featured
Date |
Price
Featured |
Pivot Featured |
|
Max Buy |
LOB
-
NASDAQ
Live Oak Bancshares Inc
Banks-Southeast
|
$29.40
|
+0.15
0.51% |
$29.50
|
56,138
48.39% of 50 DAV
50 DAV is 116,000
|
$30.05
-2.16%
|
5/21/2018
|
$29.35
|
PP = $30.15
|
|
MB = $31.66
|
Most Recent Note - 5/21/2018 3:43:23 PM
Y - New pivot point is cited based on its 3/21/18 high plus 10 cents. Subsequent volume-driven gains for a new high may trigger a technical buy signal. Volume totals have been cooling while consolidating near its 50 DMA line ($28.57). Prior lows in the $26-27 area define important near term support. Recently reported earnings +63% on +42% for the Mar '18 quarter.
>>> FEATURED STOCK ARTICLE : Tested Support at 50-Day Moving Average After Breakout - 4/16/2018 |
View all notes |
Set NEW NOTE alert |
Company Profile |
SEC
News |
Chart |
Request a new note
C
A
S
I |
PYPL
-
NASDAQ
Paypal Holdings Inc
Finance-CrdtCard/PmtPr
|
$81.25
|
+0.46
0.57% |
$82.32
|
7,791,675
90.19% of 50 DAV
50 DAV is 8,639,000
|
$86.32
-5.87%
|
5/18/2018
|
$81.63
|
PP = $80.89
|
|
MB = $84.93
|
Most Recent Note - 5/18/2018 12:57:00 PM
Y - Color code is changed to yellow with new pivot point cited based on its 4/18/18 high after forming a "double bottom" base. A gain and close above the pivot point backed by at least +40% above average volume may trigger a new technical buy signal. Found prompt support near its 200 DMA line and prior lows in the $71-72 area. Rebound above the 50 DMA line with volume-driven gains helped its outlook improve. Fundamentals remain strong.
>>> FEATURED STOCK ARTICLE : Slumping Near Important Near-Term Support - 4/27/2018 |
View all notes |
Set NEW NOTE alert |
Company Profile |
SEC
News |
Chart |
Request a new note
C
A
S
I |
OLLI
-
NASDAQ
Ollie's Bargain Outlet
Retail-DiscountandVariety
|
$70.95
|
+0.95
1.36% |
$71.35
|
382,301
55.89% of 50 DAV
50 DAV is 684,000
|
$70.75
0.28%
|
4/10/2018
|
$62.05
|
PP = $62.15
|
|
MB = $65.26
|
Most Recent Note - 5/21/2018 3:46:02 PM
G - Perched at its all-time high and on track today for a 10th consecutive gain, very extended from any sound base. Prior high in the $64 area defines initial support along with its 50 DMA line ($62.15).
>>> FEATURED STOCK ARTICLE : Extended From Prior Base After 8 Consecutive Gains - 5/17/2018 |
View all notes |
Set NEW NOTE alert |
Company Profile |
SEC
News |
Chart |
Request a new note
C
A
S
I |
NOVT
-
NASDAQ
Novanta Inc
Elec-Scientific/Msrng
|
$64.05
|
+0.65
1.03% |
$64.30
|
124,653
57.71% of 50 DAV
50 DAV is 216,000
|
$66.25
-3.31%
|
4/17/2018
|
$60.55
|
PP = $60.40
|
|
MB = $63.42
|
Most Recent Note - 5/15/2018 5:32:26 PM
Y - There was a "negative reversal" today after hitting a new 52-week high. Reported earnings +52% on +35% sales revenues for the Mar '18 quarter. Found support near prior highs in the $58 area and stayed above its 50 DMA line ($57.11) during the recent consolidation.
>>> FEATURED STOCK ARTICLE : Volume-Driven Gain Hit New All-Time High - 4/17/2018 |
View all notes |
Set NEW NOTE alert |
Company Profile |
SEC
News |
Chart |
Request a new note
C
A
S
I |
BZUN
-
NASDAQ
Baozun Inc Cl A Ads
Computer Sftwr-Enterprse
|
$52.73
|
-2.12
-3.87% |
$55.25
|
4,114,836
152.68% of 50 DAV
50 DAV is 2,695,000
|
$55.29
-4.63%
|
5/15/2018
|
$45.38
|
PP = $52.43
|
|
MB = $55.05
|
Most Recent Note - 5/21/2018 12:22:26 PM
Y - Perched near its all-time high after 2 consecutive volume-driven gains. Bullish action came after reporting earnings +29% on +25% sales revenues for the Mar '18 quarter. Featured in the 5/15/18 mid-day report (read here) and then more detailed analysis with an annotated graph on 5/16/18 in the FSU section of the evening report.
>>> FEATURED STOCK ARTICLE : Earnings News Due; Formed a Base-on-Base Pattern - 5/16/2018 |
View all notes |
Set NEW NOTE alert |
Company Profile |
SEC
News |
Chart |
Request a new note
C
A
S
I |
Symbol/Exchange
Company Name
Industry Group |
PRICE |
CHANGE
(%Change) |
Day High |
Volume
(% DAV)
(% 50 day avg vol) |
52 Wk Hi
% From Hi |
Featured
Date |
Price
Featured |
Pivot Featured |
|
Max Buy |
SEDG
-
NASDAQ
Solaredge Technologies
Energy-Solar
|
$67.25
|
+0.80
1.20% |
$67.94
|
679,206
83.34% of 50 DAV
50 DAV is 815,000
|
$70.74
-4.93%
|
5/9/2018
|
$55.33
|
PP = $59.30
|
|
MB = $62.27
|
Most Recent Note - 5/15/2018 1:02:08 PM
G - Perched at its all-time high following big volume-driven gains, extended from the previously noted base. Prior highs define initial support in the $59 area. Disciplined investors avoid chasing extended stocks.
>>> FEATURED STOCK ARTICLE : Quickly Rallied Following Strong Earnings News - 5/10/2018 |
View all notes |
Set NEW NOTE alert |
Company Profile |
SEC
News |
Chart |
Request a new note
C
A
S
I |
SEND
-
NYSE
Sendgrid Inc
INTERNET - Content
|
$26.77
|
+0.38
1.44% |
$27.87
|
470,629
106.00% of 50 DAV
50 DAV is 444,000
|
$32.03
-16.41%
|
3/6/2018
|
$28.00
|
PP = $28.37
|
|
MB = $29.79
|
Most Recent Note - 5/21/2018 3:50:28 PM
G - After trading higher today it again met resistance, whereas a convincing rebound above the 50 DMA line ($27.77) is needed for its outlook to improve. The prior low ($23.77 on 4/04/18) defines the next important support to watch. Completed a new Public Offering and Secondary Offering on 4/05/18.
>>> FEATURED STOCK ARTICLE : Earnings News Continues to be Strong - 5/1/2018 |
View all notes |
Set NEW NOTE alert |
Company Profile |
SEC
News |
Chart |
Request a new note
C
A
S
I |