***Last / Change / Volume data in this table is the closing quote data***
Symbol/Exchange
Company Name
Industry Group |
PRICE |
CHANGE
(%Change) |
Day High |
Volume
(% DAV)
(% 50 day avg vol) |
52 Wk Hi
% From Hi |
Featured
Date |
Price
Featured |
Pivot Featured |
|
Max Buy |
PFBC
-
NASDAQ
Preferred Bank Los Angls
BANKING - Regional - Pacific Banks
|
$63.36
|
+0.00
0.00% |
$63.83
|
71,949
86.37% of 50 DAV
50 DAV is 83,300
|
$67.65
-6.34%
|
4/10/2018
|
$64.56
|
PP = $67.75
|
|
MB = $71.14
|
Most Recent Note - 5/15/2018 5:35:03 PM
G - Its Relative Strength rating has slumped below the 80+ minimum guideline to 63 while failing to rebound after slumping below its 50 DMA line and also briefly undercutting the prior low. A rebound above the 50 DMA line ($64.78) is needed for its outlook to improve.
>>> FEATURED STOCK ARTICLE : Bank Stock Hovering Within Striking Distance of Prior High - 4/10/2018 |
View all notes |
Set NEW NOTE alert |
Company Profile |
SEC
News |
Chart |
Request a new note
C
A
S
I |
SIVB
-
NASDAQ
S V B Financial Group
BANKING - Regional - Pacific Banks
|
$323.36
|
+1.27
0.39% |
$325.35
|
675,525
83.81% of 50 DAV
50 DAV is 806,000
|
$325.38
-0.62%
|
3/12/2018
|
$267.79
|
PP = $263.19
|
|
MB = $276.35
|
Most Recent Note - 5/15/2018 5:37:23 PM
G - Still stubbornly holding its ground and quietly edging higher after a big "breakaway gap" for a new high on 4/27/18. Bullish action came after it reported financial results for the quarter ended March 31, 2018 and earnings rose +90% on +34% sales revenues versus the year ago period.
>>> FEATURED STOCK ARTICLE : Rebounded Above its 50-Day Moving Average - 4/12/2018 |
View all notes |
Set NEW NOTE alert |
Company Profile |
SEC
News |
Chart |
Request a new note
C
A
S
I |
EPAM
-
NYSE
Epam Systems Inc
COMPUTER SOFTWARE and SERVICES - Information Technology Service
|
$125.63
|
+2.09
1.69% |
$125.90
|
270,117
84.15% of 50 DAV
50 DAV is 321,000
|
$131.75
-4.65%
|
5/9/2018
|
$120.34
|
PP = $125.98
|
|
MB = $132.28
|
Most Recent Note - 5/14/2018 7:24:37 PM
Y - Pulled back today testing near the prior high ($125.88 on 3/13/18) defining initial support after 3 consecutive volume-driven gains. Prior highs in the $119 area also define near-term support to watch above its 50 DMA line ($116.94).
>>> FEATURED STOCK ARTICLE : Volume-Driven Gain Challenged Prior High Following Earnings - 5/9/2018 |
View all notes |
Set NEW NOTE alert |
Company Profile |
SEC
News |
Chart |
Request a new note
C
A
S
I |
MA
-
NYSE
Mastercard Inc Cl A
DIVERSIFIED SERVICES - Business/Management Services
|
$191.20
|
-1.18
-0.61% |
$192.44
|
2,377,630
60.92% of 50 DAV
50 DAV is 3,903,000
|
$194.72
-1.81%
|
5/2/2018
|
$184.96
|
PP = $183.83
|
|
MB = $193.02
|
Most Recent Note - 5/16/2018 2:15:20 PM
Y - Stubbornly holding its ground near its "max buy" level and all-time high. Tallied an impressive streak of gains since breaking out on 5/02/18 from a riskier "late stage" base. Prior highs in the $183 area define initial support to watch on pullbacks.
>>> FEATURED STOCK ARTICLE : Gap Up and Volume Driven Gain for New High After Earnings - 5/2/2018 |
View all notes |
Set NEW NOTE alert |
Company Profile |
SEC
News |
Chart |
Request a new note
C
A
S
I |
V
-
NYSE
Visa Inc Cl A
DIVERSIFIED SERVICES - Business/Management Services
|
$129.93
|
-0.75
-0.57% |
$130.80
|
4,911,156
62.59% of 50 DAV
50 DAV is 7,846,000
|
$132.50
-1.94%
|
4/26/2018
|
$126.68
|
PP = $126.98
|
|
MB = $133.33
|
Most Recent Note - 5/16/2018 2:09:02 PM
Y - Stubbornly holding its ground and inching higher after a technical breakout noted in the 4/26/18 mid-day report. Reported earnings +29% on +13% sales revenues for the Mar '18 quarter, and 3 of the past 4 quarterly comparisons were above the +25% minimum earnings guideline (C criteria).
>>> FEATURED STOCK ARTICLE : Volume-Driven Gain For New High Triggered Technical Buy Signal - 4/26/2018 |
View all notes |
Set NEW NOTE alert |
Company Profile |
SEC
News |
Chart |
Request a new note
C
A
S
I |
Symbol/Exchange
Company Name
Industry Group |
PRICE |
CHANGE
(%Change) |
Day High |
Volume
(% DAV)
(% 50 day avg vol) |
52 Wk Hi
% From Hi |
Featured
Date |
Price
Featured |
Pivot Featured |
|
Max Buy |
TPL
-
NYSE
Texas Pacific Land Trust
FINANCIAL SERVICES - Diversified Investments
|
$690.09
|
+38.43
5.90% |
$691.25
|
41,663
245.08% of 50 DAV
50 DAV is 17,000
|
$677.15
1.91%
|
4/13/2018
|
$547.85
|
PP = $552.10
|
|
MB = $579.71
|
 Most Recent Note - 5/17/2018 6:23:50 PM
G - Hit a new all-time high with higher volume behind today's 3rd consecutive gain, getting very extended from the prior base. Prior highs in the $569-552 area define initial support to watch above its 50 DMA line ($553).
>>> FEATURED STOCK ARTICLE : Perched Near Prior High After Showing Resilience - 4/20/2018 |
View all notes |
Set NEW NOTE alert |
Company Profile |
SEC
News |
Chart |
Request a new note
C
A
S
I |
STMP
-
NASDAQ
Stamps.com Inc
INTERNET - Internet Software and Services
|
$247.80
|
+1.10
0.45% |
$249.35
|
194,267
61.48% of 50 DAV
50 DAV is 316,000
|
$251.50
-1.47%
|
5/4/2018
|
$234.15
|
PP = $233.23
|
|
MB = $244.89
|
Most Recent Note - 5/16/2018 2:07:51 PM
G - Holding its ground with volume totals cooling while perched at its all-time high. Extended from prior highs in the $233 area which define initial support above its 50 DMA line ($215).
>>> FEATURED STOCK ARTICLE : Volume-Driven Gain For New High - 5/4/2018 |
View all notes |
Set NEW NOTE alert |
Company Profile |
SEC
News |
Chart |
Request a new note
C
A
S
I |
CHDN
-
NASDAQ
Churchill Downs Inc
LEISURE - Gaming Activities
|
$309.85
|
+3.45
1.13% |
$310.80
|
168,986
157.93% of 50 DAV
50 DAV is 107,000
|
$314.60
-1.51%
|
5/14/2018
|
$285.80
|
PP = $285.80
|
|
MB = $300.09
|
Most Recent Note - 5/16/2018 12:43:25 PM
G - Color code is changed to green after quickly rallying above its "max buy" level and getting extended from the previously noted base. Highlighted in yellow in the 5/14/18 mid-day report with pivot point cited based on its 4/26/18 high after an advanced "3-weeks tight" base pattern (read here). Its up and down annual earnings (A criteria) history was previously noted as a concern with regard to the strict fact-based investment system's guidelines. Its small supply of only 13.5 million shares (S criteria) outstanding can contribute to greater price volatility in the event of institutional buying or selling. See the latest FSU analysis for more details and an annotated graph.
>>> FEATURED STOCK ARTICLE : Breakout Followed New Supreme Court Ruling on Sports Betting - 5/14/2018 |
View all notes |
Set NEW NOTE alert |
Company Profile |
SEC
News |
Chart |
Request a new note
C
A
S
I |
HTHT
-
NASDAQ
China Lodging Group Ads
LEISURE - Lodging
|
$170.11
|
-1.48
-0.86% |
$173.12
|
747,019
130.60% of 50 DAV
50 DAV is 572,000
|
$173.76
-2.10%
|
5/15/2018
|
$138.07
|
PP = $166.29
|
|
MB = $174.60
|
Most Recent Note - 5/16/2018 12:49:36 PM
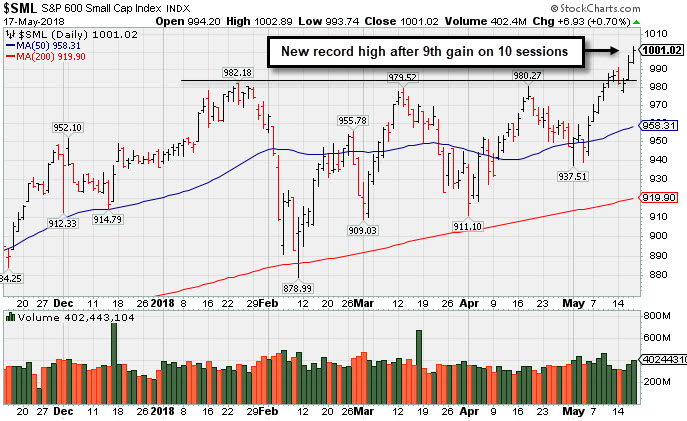
Y - Holding its ground today while on track for a 9th consecutive gain. Finished strong on the prior session after highlighted in yellow with new pivot point cited based on its 1/22/18 high plus 10 cents. The strong finish above the pivot point clinched a convincing new technical buy signal. Found support at its 200 DMA line and rebounded after dropped from the Featured Stocks list on 3/27/18. See the latest FSU analysis for more detailed analysis and an annotated graph.
>>> FEATURED STOCK ARTICLE : New Volume-Driven Breakout For All-Time High - 5/15/2018 |
View all notes |
Set NEW NOTE alert |
Company Profile |
SEC
News |
Chart |
Request a new note
C
A
S
I |
DPZ
-
NYSE
Dominos Pizza Inc
WHOLESALE - Food Wholesale
|
$246.55
|
-0.79
-0.32% |
$248.69
|
336,063
53.01% of 50 DAV
50 DAV is 634,000
|
$255.00
-3.31%
|
2/20/2018
|
$224.86
|
PP = $222.01
|
|
MB = $233.11
|
Most Recent Note - 5/14/2018 6:59:39 PM
G - It is extended from the prior base and volume totals have been cooling while consolidating in a tight range. Its 50 DMA line ($235) and prior highs in the $236 area define important near-term support to watch on pullbacks.
>>> FEATURED STOCK ARTICLE : Earnings News Due From Pizza Firm - 4/23/2018 |
View all notes |
Set NEW NOTE alert |
Company Profile |
SEC
News |
Chart |
Request a new note
C
A
S
I |
Symbol/Exchange
Company Name
Industry Group |
PRICE |
CHANGE
(%Change) |
Day High |
Volume
(% DAV)
(% 50 day avg vol) |
52 Wk Hi
% From Hi |
Featured
Date |
Price
Featured |
Pivot Featured |
|
Max Buy |
FIVE
-
NASDAQ
Five Below Inc
Retail-DiscountandVariety
|
$75.53
|
+0.88
1.18% |
$75.80
|
854,140
56.87% of 50 DAV
50 DAV is 1,502,000
|
$78.28
-3.51%
|
3/9/2018
|
$68.58
|
PP = $73.65
|
|
MB = $77.33
|
Most Recent Note - 5/14/2018 7:03:21 PM
Y - Finding support near its 50 DMA line ($71.56) after recent distributional pressure. Subsequent damaging losses below the recent low ($69.37 on 5/02/18) may trigger a more worrisome technical sell signal.
>>> FEATURED STOCK ARTICLE : Trading Near 50-Day Average After Falling Into Prior Base - 5/7/2018 |
View all notes |
Set NEW NOTE alert |
Company Profile |
SEC
News |
Chart |
Request a new note
C
A
S
I |
NOW
-
NYSE
Servicenow Inc
Computer Sftwr-Enterprse
|
$171.71
|
+0.56
0.33% |
$171.94
|
1,444,272
71.43% of 50 DAV
50 DAV is 2,022,000
|
$182.59
-5.96%
|
5/8/2018
|
$174.63
|
PP = $176.66
|
|
MB = $185.49
|
Most Recent Note - 5/15/2018 5:33:57 PM
Y - It stalled after highlighted in yellow with pivot point cited based on its 3/14/18 high plus 10 cents in the 5/08/18 mid-day report. Subsequent gains backed by at least +40% above average volume while rising above the pivot point may trigger a technical buy signal.
>>> FEATURED STOCK ARTICLE : High-Ranked Software - Enterprise Firm is Near Pivot Point - 5/8/2018 |
View all notes |
Set NEW NOTE alert |
Company Profile |
SEC
News |
Chart |
Request a new note
C
A
S
I |
NVEE
-
NASDAQ
N V 5 Global Inc
Comml Svcs-Consulting
|
$58.80
|
+0.00
0.00% |
$59.25
|
33,269
36.16% of 50 DAV
50 DAV is 92,000
|
$71.90
-18.22%
|
4/9/2018
|
$58.35
|
PP = $59.05
|
|
MB = $62.00
|
Most Recent Note - 5/16/2018 2:20:48 PM
Y -Losses on light volume recently tested support defined by its 50 DMA line and prior highs in the $58-59 area. More damaging losses would raise greater concerns. Reported earnings +51% on +48% sales revenues for the Mar '18 quarter, continuing its strong earnings track record.
>>> FEATURED STOCK ARTICLE : Encountered Distributional Pressure After Hitting New High - 5/11/2018 |
View all notes |
Set NEW NOTE alert |
Company Profile |
SEC
News |
Chart |
Request a new note
C
A
S
I |
QLYS
-
NASDAQ
Qualys Inc
Computer Sftwr-Security
|
$76.95
|
+0.40
0.52% |
$77.45
|
165,972
52.03% of 50 DAV
50 DAV is 319,000
|
$85.00
-9.47%
|
4/17/2018
|
$82.85
|
PP = $79.50
|
|
MB = $83.48
|
Most Recent Note - 5/15/2018 5:36:36 PM
Y - Still sputtering near its 50 DMA line ($76.72) and below its pivot point. Recently reported earnings +80% on +22% sales revenues for the Mar '18 quarter, continuing its strong earnings track record.
>>> FEATURED STOCK ARTICLE : Quickly Rallied More Than 5% Above Prior High - 4/18/2018 |
View all notes |
Set NEW NOTE alert |
Company Profile |
SEC
News |
Chart |
Request a new note
C
A
S
I |
SPLK
-
NASDAQ
Splunk Inc
Computer Sftwr-Database
|
$114.86
|
-0.29
-0.25% |
$116.88
|
1,161,366
65.32% of 50 DAV
50 DAV is 1,778,000
|
$117.86
-2.55%
|
5/8/2018
|
$113.14
|
PP = $112.76
|
|
MB = $118.40
|
Most Recent Note - 5/14/2018 7:20:48 PM
Y - Today's volume-driven loss led to a close below the pivot point raising some concerns. Recent gains above the stock's pivot point did not meet the required volume threshold of at least +40% above average volume needed to trigger a proper technical buy signal.
>>> FEATURED STOCK ARTICLE : Found Support Near 50-Day Average on Pullbacks - 4/19/2018 |
View all notes |
Set NEW NOTE alert |
Company Profile |
SEC
News |
Chart |
Request a new note
C
A
S
I |
Symbol/Exchange
Company Name
Industry Group |
PRICE |
CHANGE
(%Change) |
Day High |
Volume
(% DAV)
(% 50 day avg vol) |
52 Wk Hi
% From Hi |
Featured
Date |
Price
Featured |
Pivot Featured |
|
Max Buy |
SUPN
-
NASDAQ
Supernus Pharmaceuticals
Medical-Biomed/Biotech
|
$56.50
|
-1.85
-3.17% |
$58.80
|
1,135,878
150.25% of 50 DAV
50 DAV is 756,000
|
$59.05
-4.32%
|
4/24/2018
|
$47.73
|
PP = $50.15
|
|
MB = $52.66
|
Most Recent Note - 5/17/2018 6:22:10 PM
G - Pulled back from its all-time high today following an impressive streak of big volume-driven gains. Very extended from the previously noted base and prior highs in the $49-50 area define initial support to watch on pullbacks.
>>> FEATURED STOCK ARTICLE : Pharmaceutical Firm Perched Near Record High - 4/24/2018 |
View all notes |
Set NEW NOTE alert |
Company Profile |
SEC
News |
Chart |
Request a new note
C
A
S
I |
PAYC
-
NYSE
Paycom Software Inc
COMPUTER SOFTWARE and SERVICES - Application Software
|
$101.69
|
+0.02
0.02% |
$102.88
|
942,098
127.66% of 50 DAV
50 DAV is 738,000
|
$118.45
-14.15%
|
2/15/2018
|
$95.01
|
PP = $93.61
|
|
MB = $98.29
|
Most Recent Note - 5/14/2018 7:13:16 PM
G - Met resistance near its 50 DMA line recently and today's big volume-driven loss tested prior lows in the $101 area defining important near-term support. More damaging losses would raise greater concerns. Meanwhile, a rebound above the 50 DMA line is needed for its outlook to improve.
>>> FEATURED STOCK ARTICLE : Violation of 50-Day Average Triggered Technical Sell Signal - 5/3/2018 |
View all notes |
Set NEW NOTE alert |
Company Profile |
SEC
News |
Chart |
Request a new note
C
A
S
I |
GRUB
-
NYSE
Grubhub Inc
COMPUTER SOFTWARE and SERVICES - Technical and System Software
|
$103.38
|
+0.71
0.69% |
$104.30
|
956,043
62.90% of 50 DAV
50 DAV is 1,520,000
|
$112.41
-8.03%
|
6/21/2017
|
$47.33
|
PP = $46.94
|
|
MB = $49.29
|
Most Recent Note - 5/15/2018 5:29:33 PM
G - Consolidating quietly just below its 50 DMA line ($102.25). Faces resistance due to overhead supply up to the $112 level. Recently reported earnings +79% on +49% sales revenues for the Mar '18 quarter.
>>> FEATURED STOCK ARTICLE : Consolidating Near 50 Day Average With Earnings News Due - 4/30/2018 |
View all notes |
Set NEW NOTE alert |
Company Profile |
SEC
News |
Chart |
Request a new note
C
A
S
I |
HQY
-
NASDAQ
Healthequity Inc
COMPUTER SOFTWARE and SERVICES - Healthcare Information Service
|
$72.24
|
+0.55
0.77% |
$72.44
|
388,256
65.47% of 50 DAV
50 DAV is 593,000
|
$72.27
-0.04%
|
5/2/2018
|
$66.31
|
PP = $68.85
|
|
MB = $72.29
|
Most Recent Note - 5/16/2018 2:10:56 PM
Y - Volume totals still have been below average while wedging into new all-time high territory. Gains above a stock's pivot point must have at least +40% above average volume to trigger a proper new (or add-on) technical buy signal. Its 50 DMA line ($64.56) defines near term support above the recent low ($59.50 on 4/03/18).
>>> FEATURED STOCK ARTICLE : Perched Near All-Time High Building a Short New Base - 4/25/2018 |
View all notes |
Set NEW NOTE alert |
Company Profile |
SEC
News |
Chart |
Request a new note
C
A
S
I |
LOB
-
NASDAQ
"Live Oak Bancshares, Inc."
Banks-Southeast
|
$29.35
|
+0.15
0.51% |
$29.50
|
64,520
53.15% of 50 DAV
50 DAV is 121,400
|
$30.05
-2.33%
|
3/16/2018
|
$28.63
|
PP = $28.30
|
|
MB = $29.72
|
Most Recent Note - 5/14/2018 7:06:53 PM
Y - Volume totals have been cooling while consolidating in a tight trading range near its 50 DMA line ($28.40). Recent lows in the $26-27 area define the next important near term support. Recently reported earnings +63% on +42% for the Mar '18 quarter.
>>> FEATURED STOCK ARTICLE : Tested Support at 50-Day Moving Average After Breakout - 4/16/2018 |
View all notes |
Set NEW NOTE alert |
Company Profile |
SEC
News |
Chart |
Request a new note
C
A
S
I |
Symbol/Exchange
Company Name
Industry Group |
PRICE |
CHANGE
(%Change) |
Day High |
Volume
(% DAV)
(% 50 day avg vol) |
52 Wk Hi
% From Hi |
Featured
Date |
Price
Featured |
Pivot Featured |
|
Max Buy |
PYPL
-
NASDAQ
Paypal Holdings Inc
Finance-CrdtCard/PmtPr
|
$79.19
|
+1.37
1.76% |
$81.16
|
8,295,493
98.43% of 50 DAV
50 DAV is 8,428,000
|
$86.32
-8.26%
|
2/1/2018
|
$80.35
|
PP = $79.49
|
|
MB = $83.46
|
Most Recent Note - 5/16/2018 2:17:42 PM
G - Rebound above the 50 DMA line with volume-driven gains helped its outlook to improve. Found prompt support near its 200 DMA line and prior lows in the $71-72 area. Fundamentals remain strong after it reported earnings +30% on +24% sales revenues for the Mar '18 quarter.
>>> FEATURED STOCK ARTICLE : Slumping Near Important Near-Term Support - 4/27/2018 |
View all notes |
Set NEW NOTE alert |
Company Profile |
SEC
News |
Chart |
Request a new note
C
A
S
I |
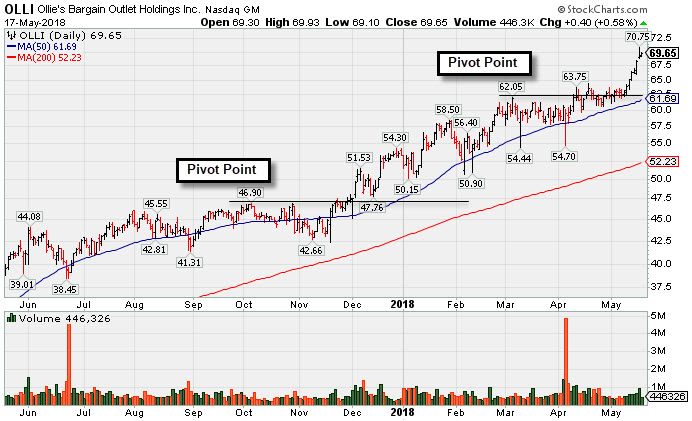
OLLI
-
NASDAQ
Ollie's Bargain Outlet
Retail-DiscountandVariety
|
$69.65
|
+0.40
0.58% |
$69.93
|
446,326
64.78% of 50 DAV
50 DAV is 689,000
|
$70.75
-1.55%
|
4/10/2018
|
$62.05
|
PP = $62.15
|
|
MB = $65.26
|
Most Recent Note - 5/14/2018 7:08:52 PM
G - Color code is changed to green while perched at its all-time high after 5 consecutive gains backed by below average volume. No resistance remains due to overhead supply.
>>> FEATURED STOCK ARTICLE : Extended From Prior Base After 8 Consecutive Gains - 5/17/2018 |
View all notes |
Set NEW NOTE alert |
Company Profile |
SEC
News |
Chart |
Request a new note
C
A
S
I |
NOVT
-
NASDAQ
Novanta Inc
Elec-Scientific/Msrng
|
$63.20
|
+0.40
0.64% |
$63.65
|
111,991
51.85% of 50 DAV
50 DAV is 216,000
|
$66.25
-4.60%
|
4/17/2018
|
$60.55
|
PP = $60.40
|
|
MB = $63.42
|
Most Recent Note - 5/15/2018 5:32:26 PM
Y - There was a "negative reversal" today after hitting a new 52-week high. Reported earnings +52% on +35% sales revenues for the Mar '18 quarter. Found support near prior highs in the $58 area and stayed above its 50 DMA line ($57.11) during the recent consolidation.
>>> FEATURED STOCK ARTICLE : Volume-Driven Gain Hit New All-Time High - 4/17/2018 |
View all notes |
Set NEW NOTE alert |
Company Profile |
SEC
News |
Chart |
Request a new note
C
A
S
I |
BZUN
-
NASDAQ
Baozun Inc Cl A Ads
Computer Sftwr-Enterprse
|
$53.51
|
+8.45
18.75% |
$53.90
|
14,530,021
565.37% of 50 DAV
50 DAV is 2,570,000
|
$52.33
2.25%
|
5/15/2018
|
$45.38
|
PP = $52.43
|
|
MB = $55.05
|
Most Recent Note - 5/17/2018 12:23:13 PM
Y - Gapped up today and rallied to a new high with a considerable volume-driven gain after reporting earnings +29% on +25% sales revenues for the Mar '18 quarter. A volume-driven gain and strong close above the pivot point may clinch a convincing technical buy signal. It was first featured in the 5/15/18 mid-day report (read here). See the latest FSU analysis for more details and an annotated graph.
>>> FEATURED STOCK ARTICLE : Earnings News Due; Formed a Base-on-Base Pattern - 5/16/2018 |
View all notes |
Set NEW NOTE alert |
Company Profile |
SEC
News |
Chart |
Request a new note
C
A
S
I |
SEDG
-
NASDAQ
Solaredge Technologies
Energy-Solar
|
$66.60
|
-0.95
-1.41% |
$68.20
|
788,566
97.72% of 50 DAV
50 DAV is 807,000
|
$70.74
-5.85%
|
5/9/2018
|
$55.33
|
PP = $59.30
|
|
MB = $62.27
|
Most Recent Note - 5/15/2018 1:02:08 PM
G - Perched at its all-time high following big volume-driven gains, extended from the previously noted base. Prior highs define initial support in the $59 area. Disciplined investors avoid chasing extended stocks.
>>> FEATURED STOCK ARTICLE : Quickly Rallied Following Strong Earnings News - 5/10/2018 |
View all notes |
Set NEW NOTE alert |
Company Profile |
SEC
News |
Chart |
Request a new note
C
A
S
I |
Symbol/Exchange
Company Name
Industry Group |
PRICE |
CHANGE
(%Change) |
Day High |
Volume
(% DAV)
(% 50 day avg vol) |
52 Wk Hi
% From Hi |
Featured
Date |
Price
Featured |
Pivot Featured |
|
Max Buy |
SEND
-
NYSE
Sendgrid Inc
INTERNET - Content
|
$26.08
|
-0.08
-0.31% |
$26.85
|
957,585
225.31% of 50 DAV
50 DAV is 425,000
|
$32.03
-18.57%
|
3/6/2018
|
$28.00
|
PP = $28.37
|
|
MB = $29.79
|
Most Recent Note - 5/14/2018 7:16:15 PM
G - Gapped down today for a damaging volume-driven loss. Met resistance whereas a convincing rebound above the 50 DMA line ($28.09) is needed for its outlook to improve. The prior low ($23.77 on 4/04/18) defines the next important support to watch. Completed a new Public Offering and Secondary Offering on 4/05/18.
>>> FEATURED STOCK ARTICLE : Earnings News Continues to be Strong - 5/1/2018 |
View all notes |
Set NEW NOTE alert |
Company Profile |
SEC
News |
Chart |
Request a new note
C
A
S
I |