***Last / Change / Volume data in this table is the closing quote data***
Symbol/Exchange
Company Name
Industry Group |
PRICE |
CHANGE
(%Change) |
Day High |
Volume
(% DAV)
(% 50 day avg vol) |
52 Wk Hi
% From Hi |
Featured
Date |
Price
Featured |
Pivot Featured |
|
Max Buy |
 SIVB
-
NASDAQ
SIVB
-
NASDAQ
S V B Financial Group
BANKING - Regional - Pacific Banks
|
$594.32
|
+13.61
2.34% |
$594.75
|
1,224,030
309.10% of 50 DAV
50 DAV is 396,000
|
$608.84
-2.38%
|
8/6/2021
|
$589.70
|
PP = $608.94
|
|
MB = $639.39
|
Most Recent Note - 8/10/2021 12:44:10 PM
Y - Pulling back after challenging prior highs, consolidating near its 50 DMA line ($566.16). Color code was changed to yellow with new pivot point cited based on its 6/08/21 high plus 10 cents. Subsequent gains above the pivot point backed by at least +40% above average volume may trigger a new technical buy signal. Reported Jun '21 quarterly earnings +106% on +69% sales revenues versus the year ago period, continuing its strong earnings track record. Prior lows in the $531-529 area define important near-term support to watch.
>>> FEATURED STOCK ARTICLE : Consolidating Near Prior Highs Facing Little Resistance - 8/9/2021 |
View all notes |
Set NEW NOTE alert |
Company Profile |
SEC
News |
Chart |
Request a new note
C
A
S
I |
CROX
-
NASDAQ
Crocs Inc
CONSUMER NON-DURABLES - Textile - Apparel Footwear
|
$142.20
|
+0.89
0.63% |
$143.37
|
806,530
56.48% of 50 DAV
50 DAV is 1,428,000
|
$145.60
-2.34%
|
6/14/2021
|
$112.64
|
PP = $110.01
|
|
MB = $115.51
|
 Most Recent Note - 8/11/2021 3:59:18 PM
G - Perched at its all-time high, extended from any sound base. Near-term support to watch is at its 50 DMA line ($119).
>>> FEATURED STOCK ARTICLE : Quietly Consolidating Below "Max Buy" Level - 7/7/2021 |
View all notes |
Set NEW NOTE alert |
Company Profile |
SEC
News |
Chart |
Request a new note
C
A
S
I |
CRL
-
NYSE
Charles River Labs Intl
DRUGS - Biotechnology
|
$399.26
|
-8.03
-1.97% |
$411.93
|
307,110
92.50% of 50 DAV
50 DAV is 332,000
|
$420.25
-4.99%
|
6/9/2021
|
$345.91
|
PP = $349.23
|
|
MB = $366.69
|
Most Recent Note - 8/9/2021 5:40:17 PM
G - Extended from any sound base and stubbornly holding its ground perched near its all-time high. Recent volume totals have been lackluster while wedging into record high territory. Its 50 DMA line ($373) defines near-term support to watch on pullbacks. Two of the past 3 quarterly comparisons through Mar '21 have been above the +25% minimum earnings guideline (C criteria).
>>> FEATURED STOCK ARTICLE : Volume Totals Cooling While Perched at High - 7/13/2021 |
View all notes |
Set NEW NOTE alert |
Company Profile |
SEC
News |
Chart |
Request a new note
C
A
S
I |
GNRC
-
NYSE
Generac Hldgs Inc
Electrical-Power/Equipmt
|
$417.22
|
-1.87
-0.45% |
$420.66
|
599,637
74.30% of 50 DAV
50 DAV is 807,000
|
$457.00
-8.70%
|
6/8/2021
|
$348.46
|
PP = $342.38
|
|
MB = $359.50
|
Most Recent Note - 8/6/2021 5:33:50 PM
G - Posted a 2nd consecutive gain with near average volume, finding support above its 50 DMA line ($390). Reported Jun '21 quarterly earnings +71% on +68% sales revenues versus the year ago period. Fundamentals remain strong.
>>> FEATURED STOCK ARTICLE : Gain for New High Leaves GNRC Very Extended From Prior Base - 7/12/2021 |
View all notes |
Set NEW NOTE alert |
Company Profile |
SEC
News |
Chart |
Request a new note
C
A
S
I |
CAMT
-
NASDAQ
Camtek Ltd
ELECTRONICS - Scientific and Technical Instrum
|
$37.46
|
-0.51
-1.34% |
$38.66
|
167,857
75.95% of 50 DAV
50 DAV is 221,000
|
$40.47
-7.44%
|
8/4/2021
|
$39.67
|
PP = $40.57
|
|
MB = $42.60
|
Most Recent Note - 8/5/2021 12:45:33 PM
Y - Reversed into the red after hitting a new all-time high today. Posted a solid gain on the prior session with above average volume and closed at the session high for a best-ever close. Bullish action came after it reported Jun '21 quarterly earnings +138% on +82% sales revenues versus the year-ago period, continuing its strong earnings track record. A new pivot point was cited based on its 6/09/21 high plus 10 cents. Subsequent gains and a close above the pivot point backed by at least +40% above average volume may trigger a new (or add-on) technical buy signal. The 50 DMA line ($36.43) defines important near-term support to watch on pullbacks.
>>> FEATURED STOCK ARTICLE : Loss With Light Volume Undercut 50-Day Moving Average - 7/8/2021 |
View all notes |
Set NEW NOTE alert |
Company Profile |
SEC
News |
Chart |
Request a new note
C
A
S
I |
Symbol/Exchange
Company Name
Industry Group |
PRICE |
CHANGE
(%Change) |
Day High |
Volume
(% DAV)
(% 50 day avg vol) |
52 Wk Hi
% From Hi |
Featured
Date |
Price
Featured |
Pivot Featured |
|
Max Buy |
PKI
-
NYSE
Perkinelmer Inc
ELECTRONICS - Scientific and Technical Instrum
|
$179.23
|
-4.27
-2.33% |
$184.37
|
1,105,495
148.79% of 50 DAV
50 DAV is 743,000
|
$188.40
-4.87%
|
7/26/2021
|
$168.06
|
PP = $162.80
|
|
MB = $170.94
|
Most Recent Note - 8/11/2021 4:53:09 PM
G - Pulled back today for a 2nd consecutive loss after getting extended from any sound base. Prior high ($162) defines initial support to watch above its 50 DMA line ($159). Reported earnings +80% on +51% sales revenues for the Jun '21 quarter versus the year ago period.
>>> FEATURED STOCK ARTICLE : Powerful Volume-Driven Breakout After Earnings Report - 7/26/2021 |
View all notes |
Set NEW NOTE alert |
Company Profile |
SEC
News |
Chart |
Request a new note
C
A
S
I |
TRMB
-
NASDAQ
Trimble Inc
ELECTRONICS - Scientific and Technical Instrum
|
$89.09
|
+0.10
0.11% |
$89.46
|
933,505
96.74% of 50 DAV
50 DAV is 965,000
|
$90.25
-1.29%
|
8/5/2021
|
$88.83
|
PP = $84.97
|
|
MB = $89.22
|
Most Recent Note - 8/5/2021 5:07:08 PM
Y - Finished strong today after highlighted in yellow with pivot point cited based on its 4/06/21 high plus 10 cents in the earlier mid-day report. The big gain above the pivot point was backed by +72% above average volume to clinch a proper technical buy signal. Found support at its 50 DMA line ($81.14). Reported earnings +38% on +29% sales revenues for the Jun '21 quarter versus the year ago period. Three of the past 4 quarterly comparisons were above the +25% minimum earnings guideline (C criteria). Annual earnings (A criteria) growth has been strong and steady. See the latest FSU analysis for more details and a new annotated graph.
>>> FEATURED STOCK ARTICLE : Finished Strong With Gain for New High Backed by Volume - 8/5/2021 |
View all notes |
Set NEW NOTE alert |
Company Profile |
SEC
News |
Chart |
Request a new note
C
A
S
I |
UMC
-
NYSE
United Microelectrnc Adr
ELECTRONICS - Semiconductor - Integrated Cir
|
$10.84
|
+0.01
0.09% |
$10.95
|
4,382,520
68.88% of 50 DAV
50 DAV is 6,363,000
|
$11.71
-7.43%
|
8/5/2021
|
$11.62
|
PP = $11.38
|
|
MB = $11.95
|
Most Recent Note - 8/10/2021 11:16:17 AM
Y - Pulling back today for a 3rd consecutive loss since reaching a new 52-week high. Recent highs and its 50 DMA line define near term support to watch in the high $9 area.
>>> FEATURED STOCK ARTICLE : Taiwan-Based Semiconductor Firm's Breakout Highlighted This Week - 8/6/2021 |
View all notes |
Set NEW NOTE alert |
Company Profile |
SEC
News |
Chart |
Request a new note
C
A
S
I |
ASML
-
NASDAQ
A S M L Holding N.V. NY
ELECTRONICS - Semiconductor Equipment and Mate
|
$789.22
|
-0.07
-0.01% |
$793.34
|
420,593
61.58% of 50 DAV
50 DAV is 683,000
|
$805.64
-2.04%
|
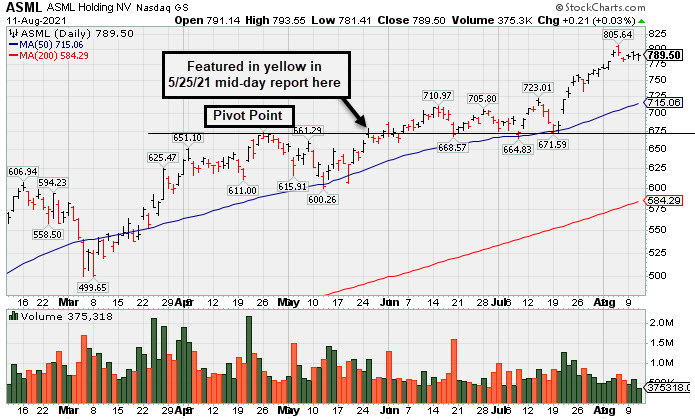
5/25/2021
|
$669.59
|
PP = $675.75
|
|
MB = $709.54
|
Most Recent Note - 8/11/2021 4:51:09 PM
G - Extended from any sound base and hovering near its all-time high, stubbornly holding its ground with volume totals cooling. Its 50 DMA line ($715) defines important near-term support to watch on pullbacks. See the latest FSU analysis for more details and a new annotated graph.
>>> FEATURED STOCK ARTICLE : Semi Equipment Firm Extended From Any Sound Base - 8/11/2021 |
View all notes |
Set NEW NOTE alert |
Company Profile |
SEC
News |
Chart |
Request a new note
C
A
S
I |
ENTG
-
NASDAQ
Entegris Inc
ELECTRONICS - Semiconductor Equipment and Mate
|
$116.24
|
-3.74
-3.12% |
$120.47
|
661,606
95.88% of 50 DAV
50 DAV is 690,000
|
$126.41
-8.05%
|
8/4/2021
|
$125.33
|
PP = $126.51
|
|
MB = $132.84
|
Most Recent Note - 8/11/2021 4:02:13 PM
G - Color code is changed to green after slumping below its 50 DMA line ($118.30) today raising concerns. A rebound and subsequent gains and a close above the pivot point backed by at least +40% above average volume may trigger a proper technical buy signal. Fundamentals remain strong as it reported Jun '21 quarterly earnings +42% on +27% sales revenues. Its Relative Strength Rating is 84, above the 80+ minimum guideline for buy candidates.
>>> FEATURED STOCK ARTICLE : Perched Near High After 6th Consecutive Gain - 8/4/2021 |
View all notes |
Set NEW NOTE alert |
Company Profile |
SEC
News |
Chart |
Request a new note
C
A
S
I |
Symbol/Exchange
Company Name
Industry Group |
PRICE |
CHANGE
(%Change) |
Day High |
Volume
(% DAV)
(% 50 day avg vol) |
52 Wk Hi
% From Hi |
Featured
Date |
Price
Featured |
Pivot Featured |
|
Max Buy |
LUNA
-
NASDAQ
Luna Innovations Inc
Medical-Research Eqp/Svc
|
$11.00
|
-0.19
-1.70% |
$11.37
|
212,073
130.03% of 50 DAV
50 DAV is 163,100
|
$13.05
-15.71%
|
7/26/2021
|
$12.46
|
PP = $13.15
|
|
MB = $13.81
|
Most Recent Note - 8/10/2021 12:39:10 PM
G - Gapped down today and its color code was changed to green. Weakness came after reporting Jun '21 quarterly earnings +0% on +50% sales revenues versus the year ago period, below the +25% minimum earnings guideline (C criteria), raising fundamental concerns. Disciplined investors note that since featured on 7/26/21 it did not trigger a proper technical buy signal.
>>> FEATURED STOCK ARTICLE : Pulled Back After Streak of Gains Challenging 52-Week High - 7/27/2021 |
View all notes |
Set NEW NOTE alert |
Company Profile |
SEC
News |
Chart |
Request a new note
C
A
S
I |
CLFD
-
NASDAQ
Clearfield Inc
TELECOMMUNICATIONS - Cables / Satalite Equipment
|
$42.08
|
-0.25
-0.59% |
$42.74
|
59,692
46.63% of 50 DAV
50 DAV is 128,000
|
$45.36
-7.23%
|
7/23/2021
|
$40.23
|
PP = $43.74
|
|
MB = $45.93
|
Most Recent Note - 8/11/2021 3:58:11 PM
Y - Still holding its ground stubbornly near its high with volume totals cooling after recent volume-driven gains. Fundamentals remain strong. Bullish action came after it reported Jun '21 quarterly earnings +100% on +49% sales revenues.
>>> FEATURED STOCK ARTICLE : Big Volume-Driven Gain Challenging Prior High After Earnings - 7/23/2021 |
View all notes |
Set NEW NOTE alert |
Company Profile |
SEC
News |
Chart |
Request a new note
C
A
S
I |
POOL
-
NASDAQ
Pool Corp
WHOLESALE - Basic Materials Wholesale
|
$483.17
|
-0.21
-0.04% |
$487.19
|
166,751
66.70% of 50 DAV
50 DAV is 250,000
|
$495.22
-2.43%
|
6/21/2021
|
$455.09
|
PP = $449.54
|
|
MB = $472.02
|
Most Recent Note - 8/6/2021 5:20:01 PM
G - Volume totals are cooling while perched at its all-time high, extended from any sound base. Its 50 DMA line ($456) defines important near-term support to watch.
>>> FEATURED STOCK ARTICLE : Churned Heavy Volume While Testing 50-Day Moving Average - 7/22/2021 |
View all notes |
Set NEW NOTE alert |
Company Profile |
SEC
News |
Chart |
Request a new note
C
A
S
I |
FSBW
-
NASDAQ
F S Bancorp
Banks-West/Southwest
|
$35.65
|
+0.75
2.15% |
$36.37
|
21,308
74.24% of 50 DAV
50 DAV is 28,700
|
$36.85
-3.26%
|
5/18/2021
|
$35.08
|
PP = $36.85
|
|
MB = $38.69
|
Most Recent Note - 8/11/2021 4:07:14 PM
G - Consolidating above its 50 DMA line and near its 52-week high with today's gain backed by light volume. Recently reported Jun '21 quarterly earnings -16% on -11% sales revenues versus the year ago period raising fundamental concerns. Do not be confused by a 2:1 stock split which impacted share prices as of 7/15/21 (Featured Price, Pivot Point, and Max Buy levels were updated accordingly).
>>> FEATURED STOCK ARTICLE : Latest Earnings Report Broke Streak of Strong Increases - 7/29/2021 |
View all notes |
Set NEW NOTE alert |
Company Profile |
SEC
News |
Chart |
Request a new note
C
A
S
I |
SMPL
-
NASDAQ
Simply Good Foods Co
Food-Confectionery
|
$36.11
|
+0.64
1.80% |
$36.77
|
712,615
151.94% of 50 DAV
50 DAV is 469,000
|
$38.50
-6.21%
|
12/28/2020
|
$30.40
|
PP = $31.44
|
|
MB = $33.01
|
Most Recent Note - 8/11/2021 4:05:44 PM
G - Consolidating near its 50 DMA line ($36.31) and testing near prior highs in the $35 area. More damaging losses would raise greater concerns. Reported May '21 quarterly earnings +65% on +32% sales revenues versus the year ago period, well above the +25% minimum earnings guideline (C criteria).
>>> FEATURED STOCK ARTICLE : Pulled Back from High With Small Losses on Light Volume - 7/15/2021 |
View all notes |
Set NEW NOTE alert |
Company Profile |
SEC
News |
Chart |
Request a new note
C
A
S
I |
Symbol/Exchange
Company Name
Industry Group |
PRICE |
CHANGE
(%Change) |
Day High |
Volume
(% DAV)
(% 50 day avg vol) |
52 Wk Hi
% From Hi |
Featured
Date |
Price
Featured |
Pivot Featured |
|
Max Buy |
PYPL
-
NASDAQ
"PayPal Holdings, Inc"
Finance-CrdtCard/PmtPr
|
$276.41
|
+2.04
0.74% |
$278.24
|
5,766,093
92.11% of 50 DAV
50 DAV is 6,260,300
|
$310.16
-10.88%
|
7/27/2021
|
$296.69
|
PP = $307.82
|
|
MB = $323.21
|
Most Recent Note - 8/6/2021 5:21:59 PM
G - Still sputtering after slumping below its 50 DMA line ($284) with damaging volume-driven losses recently raising concerns, technically. Weak action came after it reported Jun '21 quarterly earnings +7% on +19% sales revenues versus the year ago period, below the +25% minimum earnings guideline (C criteria), raising fundamental concerns.
>>> FEATURED STOCK ARTICLE : Paypal Perched at Record High - 7/28/2021 |
View all notes |
Set NEW NOTE alert |
Company Profile |
SEC
News |
Chart |
Request a new note
C
A
S
I |
SQ
-
NYSE
Square Inc Cl A
Finance-CrdtCard/PmtPr
|
$271.09
|
-1.99
-0.73% |
$281.34
|
7,862,702
90.70% of 50 DAV
50 DAV is 8,669,000
|
$289.23
-6.27%
|
8/2/2021
|
$273.78
|
PP = $283.29
|
|
MB = $297.45
|
Most Recent Note - 8/6/2021 5:27:54 PM
Y - Pulled back today with lighter (average) volume. Hit a new all-time high on the prior session with a big volume-driven gain above the pivot point triggering a technical buy signal. It reported Jun '21 quarterly earnings +267% on +143% sales revenues versus the year ago period, its 4th strong comparison well above the +25% minimum guideline (C criteria).
>>> FEATURED STOCK ARTICLE : Pullback Following Big Gain on Strong Earnings and M&A News - 8/3/2021 |
View all notes |
Set NEW NOTE alert |
Company Profile |
SEC
News |
Chart |
Request a new note
C
A
S
I |
SHOP
-
NYSE
Shopify Inc Cl A
Computer Sftwr-Enterprse
|
$1,485.23
|
-40.71
-2.67% |
$1,537.43
|
913,440
66.05% of 50 DAV
50 DAV is 1,383,000
|
$1,650.00
-9.99%
|
7/2/2021
|
$1,468.00
|
PP = $1,552.23
|
|
MB = $1,629.84
|
Most Recent Note - 8/9/2021 5:38:48 PM
Y - Consolidating near its pivot point after encountering distributional pressure. Its 50 DMA line ($1,442) and recent low define near term support to watch. Reported Jun '21 quarterly earnings +113% on +57% sales revenues versus the year ago period.
>>> FEATURED STOCK ARTICLE : Managed a Positive Reversal After Early Weakness - 7/19/2021 |
View all notes |
Set NEW NOTE alert |
Company Profile |
SEC
News |
Chart |
Request a new note
C
A
S
I |
YETI
-
NYSE
Yeti Holdings Inc
Leisure-Products
|
$102.25
|
+0.30
0.29% |
$102.96
|
542,611
47.60% of 50 DAV
50 DAV is 1,140,000
|
$105.62
-3.19%
|
5/13/2021
|
$84.20
|
PP = $90.65
|
|
MB = $95.18
|
Most Recent Note - 8/6/2021 5:25:35 PM
G - There was a "negative reversal" today on light volume after hitting new all-time highs with recent gains backed by above average volume. Reported Jun '21 quarterly earnings +66% on +45% sales revenues versus the year ago period, continuing its strong earnings track record. Its 50 DMA line ($92.51) defines near-term support to watch on pullbacks.
>>> FEATURED STOCK ARTICLE : Volume Totals Cooling While Consolidating Near High - 7/9/2021 |
View all notes |
Set NEW NOTE alert |
Company Profile |
SEC
News |
Chart |
Request a new note
C
A
S
I |
DOCU
-
NASDAQ
Docusign Inc
Computer Sftwr-Enterprse
|
$293.06
|
-8.38
-2.78% |
$303.49
|
1,776,877
62.30% of 50 DAV
50 DAV is 2,852,000
|
$314.76
-6.89%
|
7/6/2021
|
$288.96
|
PP = $290.33
|
|
MB = $304.85
|
Most Recent Note - 8/11/2021 4:00:41 PM
Y - Pulled back today with below average volume after a "negative reversal" on the prior session at its all-time high. Wedged into new high territory with recent gains lacking great volume conviction. Prior low ($270.41 on 7/15/21) defines initial support above its 50 DMA line ($278).
>>> FEATURED STOCK ARTICLE : Touched New High With Average Volume Behind Today's Gain - 7/6/2021 |
View all notes |
Set NEW NOTE alert |
Company Profile |
SEC
News |
Chart |
Request a new note
C
A
S
I |
Symbol/Exchange
Company Name
Industry Group |
PRICE |
CHANGE
(%Change) |
Day High |
Volume
(% DAV)
(% 50 day avg vol) |
52 Wk Hi
% From Hi |
Featured
Date |
Price
Featured |
Pivot Featured |
|
Max Buy |
XPEL
-
NASDAQ
Xpel Inc
Auto/Truck-Tires andamp; Misc
|
$86.71
|
+1.21
1.42% |
$87.63
|
167,290
73.37% of 50 DAV
50 DAV is 228,000
|
$103.84
-16.50%
|
7/21/2021
|
$92.25
|
PP = $94.31
|
|
MB = $99.03
|
Most Recent Note - 8/10/2021 5:35:13 PM
G - Posted a gain with average volume but it remains below its 50 DMA line ($87.53). Raised concerns as it fell back into the previously noted base. Prior lows in the $78.50 area define the next important support. Fundamentals remain strong after it reported Jun '21 quarterly earnings +164% on +92% sales revenues versus the year ago period.
>>> FEATURED STOCK ARTICLE : New Base Formed May Be "Late Stage" - 7/21/2021 |
View all notes |
Set NEW NOTE alert |
Company Profile |
SEC
News |
Chart |
Request a new note
C
A
S
I |
JEF
-
NYSE
Jefferies Financial Grp
Finance-Invest Bnk/Bkrs
|
$35.76
|
+0.49
1.39% |
$35.78
|
962,514
47.84% of 50 DAV
50 DAV is 2,012,000
|
$35.77
-0.03%
|
6/28/2021
|
$31.81
|
PP = $34.42
|
|
MB = $36.14
|
Most Recent Note - 8/10/2021 5:32:30 PM
Y - Posted a 4th consecutive gain with light volume, wedging up for new high closes. Found support when recently testing its 50 DMA line ($32.56). More damaging losses would raise concerns and trigger a technical sell signal. As previously noted - "Subsequent gains above the pivot point backed by at least +40% above average volume are necessary to trigger a technical buy signal." See the latest FSU analysis for more details and a new annotated graph.
>>> FEATURED STOCK ARTICLE : Quiet Gains for New High Closes - 8/10/2021 |
View all notes |
Set NEW NOTE alert |
Company Profile |
SEC
News |
Chart |
Request a new note
C
A
S
I |
CLAR
-
NASDAQ
Clarus Corporation
Leisure-Products
|
$29.07
|
+0.38
1.32% |
$29.10
|
119,771
52.53% of 50 DAV
50 DAV is 228,000
|
$32.36
-10.17%
|
5/12/2021
|
$21.40
|
PP = $19.73
|
|
MB = $20.72
|
Most Recent Note - 8/11/2021 3:57:29 PM
G - Consolidating after volume-driven gains into new 52-week high territory. Very extended from any sound base. Bullish action came after it reported Jun '21 quarterly earnings +244% on +41% sales revenues versus the year ago period, showing impressive sales revenues and earnings acceleration in sequential quarterly comparisons. Its 50 DMA line ($26.64) defines important near-term support to watch on pullbacks.
>>> FEATURED STOCK ARTICLE : Extended From Prior Base and Hitting Another New High - 7/20/2021 |
View all notes |
Set NEW NOTE alert |
Company Profile |
SEC
News |
Chart |
Request a new note
C
A
S
I |
AVTR
-
NYSE
Avantor Inc
Medical-Research Eqp/Svc
|
$37.85
|
-0.57
-1.48% |
$38.50
|
2,885,442
78.20% of 50 DAV
50 DAV is 3,690,000
|
$38.86
-2.60%
|
6/10/2021
|
$32.94
|
PP = $34.09
|
|
MB = $35.79
|
Most Recent Note - 8/6/2021 5:11:50 PM
G - Volume totals have been cooling while stubbornly holding its ground perched at its all-time high, extended from any sound base. Reported Jun '21 earnings +84% on +26% sales revenues versus the year ago period. Its 50 DMA line ($35.21) defines support above the prior high in the $34 area.
>>> FEATURED STOCK ARTICLE : Held Ground But Made Little Price Progress Since Featured - 7/14/2021 |
View all notes |
Set NEW NOTE alert |
Company Profile |
SEC
News |
Chart |
Request a new note
C
A
S
I |
MIME
-
NASDAQ
Mimecast Limited
Computer Sftwr-Security
|
$58.65
|
-0.02
-0.03% |
$58.67
|
491,197
86.33% of 50 DAV
50 DAV is 569,000
|
$59.96
-2.18%
|
8/2/2021
|
$56.12
|
PP = $59.58
|
|
MB = $62.56
|
Most Recent Note - 8/9/2021 5:44:12 PM
Y - Stubbornly holding its ground with volume totals cooling after a big volume-driven gain on 8/03/21 for a new all-time high. Bullish action came after reporting Jun '21 quarterly earnings +45% on +24% sales revenues versus the year ago period. It was highlighted in yellow in the prior mid-day report with pivot point cited based on its 12/28/20 high plus 10 cents when noted - "Subsequent gains above the pivot point backed by at least +40% above average volume may trigger a technical buy signal."
>>> FEATURED STOCK ARTICLE : Perched Not Far From High With Earnings News Due Pre-Open - 8/2/2021 |
View all notes |
Set NEW NOTE alert |
Company Profile |
SEC
News |
Chart |
Request a new note
C
A
S
I |
Symbol/Exchange
Company Name
Industry Group |
PRICE |
CHANGE
(%Change) |
Day High |
Volume
(% DAV)
(% 50 day avg vol) |
52 Wk Hi
% From Hi |
Featured
Date |
Price
Featured |
Pivot Featured |
|
Max Buy |