You are not logged in.
This means you
CAN ONLY VIEW reports that were published prior to Thursday, April 17, 2025.
You
MUST UPGRADE YOUR MEMBERSHIP if you want to see any current reports.
AFTER MARKET UPDATE - FRIDAY, JULY 23RD, 2021
Previous After Market Report Next After Market Report >>>
|
|
|
|
DOW |
+238.20 |
35,061.55 |
+0.68% |
|
Volume |
813,080,176 |
+10% |
|
Volume |
3,923,133,100 |
+11% |
|
NASDAQ |
+151.67 |
14,836.26 |
+1.03% |
|
Advancers |
2,013 |
63% |
|
Advancers |
2,134 |
49% |
|
S&P 500 |
+44.30 |
4,411.78 |
+1.01% |
|
Decliners |
1,192 |
37% |
|
Decliners |
2,192 |
51% |
|
Russell 2000 |
+10.17 |
2,209.65 |
+0.46% |
|
52 Wk Highs |
147 |
|
|
52 Wk Highs |
138 |
|
|
S&P 600 |
+9.40 |
1,318.56 |
+0.72% |
|
52 Wk Lows |
50 |
|
|
52 Wk Lows |
126 |
|
|
 |
Major Indices Closed at New Record Highs
Kenneth J. Gruneisen - Passed the CAN SLIM® Master's Exam
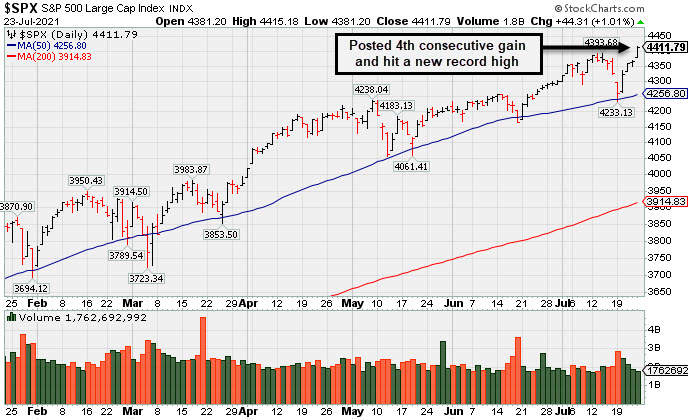
The S&P 500 advanced 1% to notch its 40th record close of 2021, capping a weekly gain of 2%. The Dow added 238 points, ending above the 35,000 level for the first time and bringing the blue chip index 1.1% higher on the week. The Nasdaq Composite jumped 1%, posting a 2.8% weekly rally. The small-cap Russell 2000 snapped a three-week losing streak, climbing more than 2% for the week. The volume totals reported were higher than the prior session on the NYSE and on the Nasdaq exchange. Breadth was positive as advancers led decliners by almost a 2-1 margin on the NYSE and while the mix was nearly even on the Nasdaq exchange. There were 42 high-ranked companies from the Leaders List that hit new 52-week highs and were listed on the BreakOuts Page, versus 42 on the prior session. New 52-week highs totals expanded and outnumbered the also expanding list of new 52-week lows on both the NYSE and the Nasdaq exchange. The major indices (M criteria) are in an uptrend that has come under pressure. Investors are reminded to always make buying and selling decisions on case-by-case basis under the strict criteria and rules of the fact-based investment system.
PICTURED: The S&P 500 Index posted a 4th consecutive gain and hit a new record high after finding prompt support at its 50-day moving average (DMA) line. More damaging losses would raise concerns.
U.S. stocks finished higher on Friday, with the major averages reclaiming record territory after a volatile week. Upbeat earnings reports seemed to overshadow worries surrounding the economic impact of the COVID-19 delta variant.
Ten of 11 S&P 500 sectors closed in positive territory, with Energy the lone declining group. The Communication Services group paced the gains, helped by strength in social media companies. Facebook and Google parent Alphabet were among the standouts following street-high price target increases from a Wall Street analyst. Meanwhile, Twitter and Snap, Inc. each reported robust quarterly results, helped by rebounding ad sales. In other earnings, chipmaker Intel (INTC -5.3%) fell as supply chain issues appeared to outweigh otherwise positive quarterly results.
On the data front, a preliminary July reading on U.S. manufacturing activity unexpectedly improved to a new record, while the comparable measure of the services sector slipped to a five-month low, albeit still in firmly expansionary territory. Longer-dated Treasuries drifted lower, with the 10-year note yield up two basis points to 1.28%, ending the week little changed. In commodities, WTI crude closed the week modestly higher at $72.03/barrel. |
 Kenneth J. Gruneisen started out as a licensed stockbroker in August 1987, a couple of months prior to the historic stock market crash that took the Dow Jones Industrial Average down -22.6% in a single day. He has published daily fact-based fundamental and technical analysis on high-ranked stocks online for two decades. Through FACTBASEDINVESTING.COM, Kenneth provides educational articles, news, market commentary, and other information regarding proven investment systems that work in good times and bad.
Comments contained in the body of this report are technical opinions only and are not necessarily those of Gruneisen Growth Corp. The material herein has been obtained from sources believed to be reliable and accurate, however, its accuracy and completeness cannot be guaranteed. Our firm, employees, and customers may effect transactions, including transactions contrary to any recommendation herein, or have positions in the securities mentioned herein or options with respect thereto. Any recommendation contained in this report may not be suitable for all investors and it is not to be deemed an offer or solicitation on our part with respect to the purchase or sale of any securities. |
|
 |
Retail, Broker/Dealer, and Tech Indices Rose
Kenneth J. Gruneisen - Passed the CAN SLIM® Master's Exam
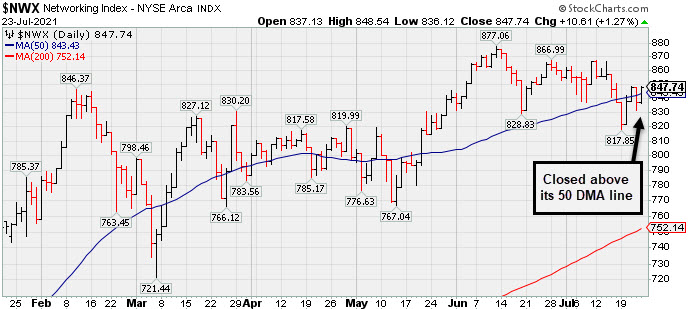
The Retail Index ($RLX +1.05%) had a positive influence on the major averages and the Broker/Dealer Index ($XBD +0.54%) also edged higher while the Bank Index ($BKX +0.02%) finished flat. The tech sector had a positive bias as the Networking Index ($NWX +1.27%) outpaced the Semiconductor Index ($SOX +0.63%) and Biotech Index ($BTK +0.24%). Commodity-linked groups had a negative bias as the Oil Services Index ($OSX -1.82%), Integrated Oil Index ($XOI -0.68%), and Gold & Silver Index ($XAU -0.72%) finished unanimously lower.
PICTURED: The Networking Index ($NWX +1.27%) rebounded and closed the week above its 50-day moving average (DMA) line.
| Oil Services |
$OSX |
55.17 |
-1.02 |
-1.82% |
+24.46% |
| Integrated Oil |
$XOI |
1,000.60 |
-6.84 |
-0.68% |
+26.26% |
| Semiconductor |
$SOX |
3,280.07 |
+20.64 |
+0.63% |
+17.33% |
| Networking |
$NWX |
847.74 |
+10.61 |
+1.27% |
+18.21% |
| Broker/Dealer |
$XBD |
458.14 |
+2.46 |
+0.54% |
+21.33% |
| Retail |
$RLX |
4,195.25 |
+43.68 |
+1.05% |
+17.74% |
| Gold & Silver |
$XAU |
135.61 |
-0.98 |
-0.72% |
-5.95% |
| Bank |
$BKX |
121.09 |
+0.02 |
+0.02% |
+23.68% |
| Biotech |
$BTK |
5,750.73 |
+13.98 |
+0.24% |
+0.20% |
|
|
|
 |
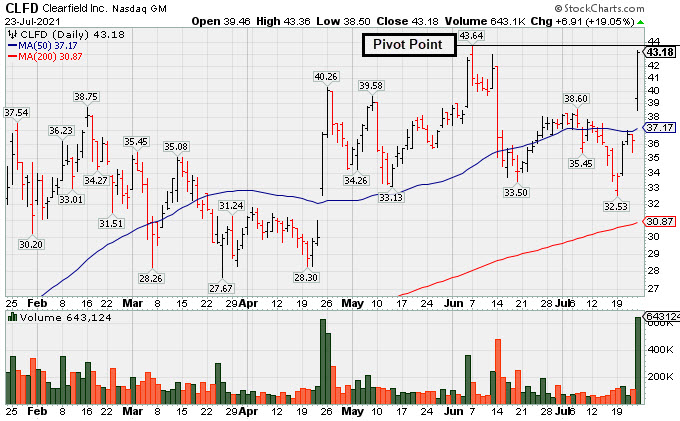
Big Volume-Driven Gain Challenging Prior High After Earnings
Kenneth J. Gruneisen - Passed the CAN SLIM® Master's Exam
Clearfield Inc (CLFD +$6.91 or +19.05% to $43.18) finished strong after highlighted in yellow in the earlier mid-day report (read here) with new pivot point cited based on its 6/07/21 high plus 10 cents. it gapped up today rebounding above its 50-day moving average (DMA) line with heavy volume behind the gain, helping its outlook to improve. Subsequent gains above the pivot point with volume may trigger a new (or add-on) technical buy signal.
Fundamentals remain strong. The latest bullish action came after it reported Jun '21 quarterly earnings +100% on +49% sales revenues versus the year ago period, continuing its strong earnings track record. CLFD was last shown in this FSU section on 6/30/21 with an annotated graph under the headline "Consolidating Above 50-Day Moving Average Helped Outlook". It was dropped from the Featured Stocks list on 7/16/21.
The high-ranked TELECOMMUNICATIONS - Fiber Optics firm has reported 6 consecutive quarterly earnings comparisons above the +25% minimum guideline (C criteria). Annual earnings (A criteria) history has improved after a downturn in FY '17.
CLFD traded up more than 75% since first highlighted in yellow with pivot point cited based on its 11/09/20 high plus 10 cents in the 11/17/20 mid-day report (read here).
The number of top-rated funds owning its shares rose from 132 in Jun '20 to 177 in Jun '21. Its current Up/Down Volume Ratio of 0.9 is an unbiased indication its shares have been under slight distributional pressure over the past 50 days. Its Accumulation/Distribution Rating is C+ and Timeliness Rating is B, and its Sponsorship Rating is D.
|
|
|
Color Codes Explained :
Y - Better candidates highlighted by our
staff of experts.
G - Previously featured
in past reports as yellow but may no longer be buyable under the
guidelines.
***Last / Change / Volume data in this table is the closing quote data***
Symbol/Exchange
Company Name
Industry Group |
PRICE |
CHANGE
(%Change) |
Day High |
Volume
(% DAV)
(% 50 day avg vol) |
52 Wk Hi
% From Hi |
Featured
Date |
Price
Featured |
Pivot Featured |
|
Max Buy |
 SIVB
-
NASDAQ
SIVB
-
NASDAQ
S V B Financial Group
BANKING - Regional - Pacific Banks
|
$570.87
|
+1.55
0.27% |
$578.97
|
407,211
109.17% of 50 DAV
50 DAV is 373,000
|
$608.84
-6.24%
|
4/23/2021
|
$579.70
|
PP = $577.16
|
|
MB = $606.02
|
Most Recent Note - 7/20/2021 5:20:09 PM
G - Posted a big gain today but remains below its 50 DMA line ($568.47). Only a prompt rebound above the 50 DMA line would help its outlook improve.
>>> FEATURED STOCK ARTICLE : Consolidating Near 50-Day Average After Distributional Pressure - 6/25/2021 |
View all notes |
Set NEW NOTE alert |
Company Profile |
SEC
News |
Chart |
Request a new note
C
A
S
I |
LOGI
-
NASDAQ
Logitech Intl Sa
COMPUTER HARDWARE - Computer Peripherals
|
$120.26
|
-0.04
-0.03% |
$121.17
|
1,254,996
165.13% of 50 DAV
50 DAV is 760,000
|
$140.17
-14.20%
|
5/26/2021
|
$119.13
|
PP = $120.34
|
|
MB = $126.36
|
 Most Recent Note - 7/23/2021 12:26:05 PM
G - Met resistance after rebounding near its 50 DMA line ($122). A gain and strong close above the 50 DMA line would help its outlook improve. Due to report Jun '21 quarterly results on 7/27/21. Volume and volatility often increase near earnings news.
>>> FEATURED STOCK ARTICLE : Recent Pullback is Testing Important Technical Support - 7/2/2021 |
View all notes |
Set NEW NOTE alert |
Company Profile |
SEC
News |
Chart |
Request a new note
C
A
S
I |
CROX
-
NASDAQ
Crocs Inc
CONSUMER NON-DURABLES - Textile - Apparel Footwear
|
$131.29
|
-0.64
-0.49% |
$134.48
|
1,521,201
101.35% of 50 DAV
50 DAV is 1,501,000
|
$120.92
8.58%
|
6/14/2021
|
$112.64
|
PP = $110.01
|
|
MB = $115.51
|
Most Recent Note - 7/22/2021 12:45:39 PM
G - Gapped up today for a 4th consecutive gain, powering into new all-time high territory, getting extended from any sound base. Found support at its 50 DMA line ($108.97).
>>> FEATURED STOCK ARTICLE : Quietly Consolidating Below "Max Buy" Level - 7/7/2021 |
View all notes |
Set NEW NOTE alert |
Company Profile |
SEC
News |
Chart |
Request a new note
C
A
S
I |
CRL
-
NYSE
Charles River Labs Intl
DRUGS - Biotechnology
|
$396.32
|
+3.07
0.78% |
$397.61
|
223,506
34.28% of 50 DAV
50 DAV is 652,000
|
$386.57
2.52%
|
6/9/2021
|
$345.91
|
PP = $349.23
|
|
MB = $366.69
|
Most Recent Note - 7/19/2021 5:43:10 PM
G - Volume totals have been below average while consolidating after wedging into record high territory. Prior highs in the $349 area and its 50 DMA line ($351) define near-term support to watch on pullbacks. Two of the past 3 quarterly comparisons through Mar '21 have been above the +25% minimum earnings guideline (C criteria).
>>> FEATURED STOCK ARTICLE : Volume Totals Cooling While Perched at High - 7/13/2021 |
View all notes |
Set NEW NOTE alert |
Company Profile |
SEC
News |
Chart |
Request a new note
C
A
S
I |
GNRC
-
NYSE
Generac Hldgs Inc
Electrical-Power/Equipmt
|
$449.64
|
+5.05
1.14% |
$451.02
|
338,202
44.21% of 50 DAV
50 DAV is 765,000
|
$452.92
-0.72%
|
6/8/2021
|
$348.46
|
PP = $342.38
|
|
MB = $359.50
|
Most Recent Note - 7/21/2021 2:13:45 PM
G - Perched near its all-time high, very extended from the previously noted base. Its 50 DMA line ($368) and prior high ($364) define important near-term support to watch on pullbacks. Fundamentals remain strong.
>>> FEATURED STOCK ARTICLE : Gain for New High Leaves GNRC Very Extended From Prior Base - 7/12/2021 |
View all notes |
Set NEW NOTE alert |
Company Profile |
SEC
News |
Chart |
Request a new note
C
A
S
I |
Symbol/Exchange
Company Name
Industry Group |
PRICE |
CHANGE
(%Change) |
Day High |
Volume
(% DAV)
(% 50 day avg vol) |
52 Wk Hi
% From Hi |
Featured
Date |
Price
Featured |
Pivot Featured |
|
Max Buy |
CAMT
-
NASDAQ
Camtek Ltd
ELECTRONICS - Scientific and Technical Instrum
|
$34.85
|
+0.11
0.32% |
$34.96
|
63,742
23.61% of 50 DAV
50 DAV is 270,000
|
$40.47
-13.89%
|
4/28/2021
|
$35.03
|
PP = $35.34
|
|
MB = $37.11
|
Most Recent Note - 7/20/2021 5:23:45 PM
G - Rebounded near its 50 DMA line ($34.82) with light volume behind today's gain. Subsequent gains above the 50 DMA line would help its outlook improve.
>>> FEATURED STOCK ARTICLE : Loss With Light Volume Undercut 50-Day Moving Average - 7/8/2021 |
View all notes |
Set NEW NOTE alert |
Company Profile |
SEC
News |
Chart |
Request a new note
C
A
S
I |
ASML
-
NASDAQ
A S M L Holding N.V. NY
ELECTRONICS - Semiconductor Equipment and Mate
|
$748.14
|
+18.22
2.50% |
$756.78
|
1,066,472
141.07% of 50 DAV
50 DAV is 756,000
|
$723.01
3.48%
|
5/25/2021
|
$669.59
|
PP = $675.75
|
|
MB = $709.54
|
Most Recent Note - 7/23/2021 12:10:46 PM
G - Rallying further above its "max buy" level and hitting new all-time highs with today's 4th consecutive volume-driven gain. Its 50 DMA line ($683) defines important near-term support to watch on pullbacks
>>> FEATURED STOCK ARTICLE : Volume Higher While Pulling Back Toward 50-Day Moving Average - 7/1/2021 |
View all notes |
Set NEW NOTE alert |
Company Profile |
SEC
News |
Chart |
Request a new note
C
A
S
I |
CLFD
-
NASDAQ
Clearfield Inc
TELECOMMUNICATIONS - Cables / Satalite Equipment
|
$43.18
|
+6.91
19.05% |
$43.36
|
643,131
590.03% of 50 DAV
50 DAV is 109,000
|
$43.64
-1.05%
|
7/23/2021
|
$40.23
|
PP = $43.74
|
|
MB = $45.93
|
Most Recent Note - 7/23/2021 4:42:37 PM
Y - Finished strong after highlighted in yellow with new pivot point cited based on its 6/07/21 high plus 10 cents. Gapped up today rebounding above its 50 DMA line with heavy volume behind the gain helping its outlook to improve. Subsequent gains above the pivot point with volume may trigger a new (or add-on) technical buy signal. Fundamentals remain strong. Bullish action came after it reported Jun '21 quarterly earnings +100% on +49% sales revenues. See the latest FSU analysis for more details and a new annotated graph.
>>> FEATURED STOCK ARTICLE : Big Volume-Driven Gain Challenging Prior High After Earnings - 7/23/2021 |
View all notes |
Set NEW NOTE alert |
Company Profile |
SEC
News |
Chart |
Request a new note
C
A
S
I |
POOL
-
NASDAQ
Pool Corp
WHOLESALE - Basic Materials Wholesale
|
$462.37
|
+11.85
2.63% |
$463.45
|
345,524
130.93% of 50 DAV
50 DAV is 263,900
|
$472.33
-2.11%
|
6/21/2021
|
$455.09
|
PP = $449.54
|
|
MB = $472.02
|
Most Recent Note - 7/23/2021 5:01:37 PM
Y - Posted a gain today, finding support at its 50 DMA line ($447). Reported Jun '21 quarterly earnings +66% on +40% sales revenues versus the year ago period. Recent losses have tested prior highs in the $449-444 range and its 50 DMA line which define important support. More damaging losses would raise concerns and trigger a technical sell signal. See the latest FSU analysis for more details and an annotated graph.
>>> FEATURED STOCK ARTICLE : Churned Heavy Volume While Testing 50-Day Moving Average - 7/22/2021 |
View all notes |
Set NEW NOTE alert |
Company Profile |
SEC
News |
Chart |
Request a new note
C
A
S
I |
FSBW
-
NASDAQ
F S Bancorp
Banks-West/Southwest
|
$35.43
|
+0.57
1.64% |
$35.83
|
28,267
91.18% of 50 DAV
50 DAV is 31,000
|
$36.85
-3.85%
|
5/18/2021
|
$35.08
|
PP = $36.85
|
|
MB = $38.69
|
Most Recent Note - 7/20/2021 5:16:51 PM
Y - Color code is changed to yellow after promptly rebounding above its 50 DMA line ($35.14) with today's big gain helping its outlook to improve. Subsequent gains above the pivot point backed by at least +40% above average volume are needed to trigger a technical buy signal. Do not be confused by a 2:1 stock split which impacted share prices as of 7/15/21 (Featured Price, Pivot Point, and Max Buy levels were updated accordingly).
>>> FEATURED STOCK ARTICLE : Still Consolidating With Close Striking Distance of All-Time High - 6/24/2021 |
View all notes |
Set NEW NOTE alert |
Company Profile |
SEC
News |
Chart |
Request a new note
C
A
S
I |
Symbol/Exchange
Company Name
Industry Group |
PRICE |
CHANGE
(%Change) |
Day High |
Volume
(% DAV)
(% 50 day avg vol) |
52 Wk Hi
% From Hi |
Featured
Date |
Price
Featured |
Pivot Featured |
|
Max Buy |
SMPL
-
NASDAQ
Simply Good Foods Co
Food-Confectionery
|
$37.80
|
+0.90
2.44% |
$37.85
|
316,429
56.10% of 50 DAV
50 DAV is 564,000
|
$38.50
-1.82%
|
12/28/2020
|
$30.40
|
PP = $31.44
|
|
MB = $33.01
|
Most Recent Note - 7/20/2021 5:27:36 PM
G - Stubbornly holding its ground near its all-time high. Its 50 DMA line ($35.40) and prior highs in the $35 area define important near-term support to watch on pullbacks. Reported May '21 quarterly earnings +65% on +32% sales revenues versus the year ago period, well above the +25% minimum earnings guideline (C criteria).
>>> FEATURED STOCK ARTICLE : Pulled Back from High With Small Losses on Light Volume - 7/15/2021 |
View all notes |
Set NEW NOTE alert |
Company Profile |
SEC
News |
Chart |
Request a new note
C
A
S
I |
SHOP
-
NYSE
Shopify Inc Cl A
Computer Sftwr-Enterprse
|
$1,643.32
|
+49.23
3.09% |
$1,650.00
|
1,388,251
99.16% of 50 DAV
50 DAV is 1,400,000
|
$1,587.74
3.50%
|
7/2/2021
|
$1,468.00
|
PP = $1,552.23
|
|
MB = $1,629.84
|
Most Recent Note - 7/23/2021 4:59:55 PM
G - Color code is changed to green after wedging higher with today's 6th consecutive gain above its "max buy" level into new high territory.
>>> FEATURED STOCK ARTICLE : Managed a Positive Reversal After Early Weakness - 7/19/2021 |
View all notes |
Set NEW NOTE alert |
Company Profile |
SEC
News |
Chart |
Request a new note
C
A
S
I |
YETI
-
NYSE
Yeti Holdings Inc
Leisure-Products
|
$97.34
|
+3.53
3.76% |
$97.84
|
1,055,278
75.97% of 50 DAV
50 DAV is 1,389,000
|
$96.62
0.75%
|
5/13/2021
|
$84.20
|
PP = $90.65
|
|
MB = $95.18
|
Most Recent Note - 7/23/2021 4:57:43 PM
G - Color code was changed to green after today's gain above its "max buy" level for a new high backed by average volume. Its 50 DMA line ($90) and recent low define important near-term support where more damaging losses would raise greater concerns. Fundamentals remain strong.
>>> FEATURED STOCK ARTICLE : Volume Totals Cooling While Consolidating Near High - 7/9/2021 |
View all notes |
Set NEW NOTE alert |
Company Profile |
SEC
News |
Chart |
Request a new note
C
A
S
I |
DOCU
-
NASDAQ
Docusign Inc
Computer Sftwr-Enterprse
|
$308.50
|
+0.50
0.16% |
$310.29
|
1,590,268
52.17% of 50 DAV
50 DAV is 3,048,000
|
$306.00
0.82%
|
7/6/2021
|
$288.96
|
PP = $290.33
|
|
MB = $304.85
|
Most Recent Note - 7/20/2021 11:54:17 AM
Y - Posting a 4th consecutive gain today and hitting a new all-time high. Wedging into new high territory with gains in recent weeks lacking great volume conviction. Highlighted in yellow with pivot point cited based on its 9/02/20 high plus 10 cents. A gain and strong close above the pivot point cited backed by at least +40% above average volume may trigger a convincing new (or add-on) technical buy signal. Fundamentals remain strong after reporting very strong Apr '21 quarterly results.
>>> FEATURED STOCK ARTICLE : Touched New High With Average Volume Behind Today's Gain - 7/6/2021 |
View all notes |
Set NEW NOTE alert |
Company Profile |
SEC
News |
Chart |
Request a new note
C
A
S
I |
XPEL
-
NASDAQ
Xpel Inc
Auto/Truck-Tires andamp; Misc
|
$101.40
|
+2.74
2.78% |
$102.89
|
349,551
161.08% of 50 DAV
50 DAV is 217,000
|
$94.21
7.63%
|
7/21/2021
|
$92.25
|
PP = $94.31
|
|
MB = $99.03
|
Most Recent Note - 7/23/2021 5:03:30 PM
G - Color code is changed to green after hitting new all-time highs above its "max buy" level with today's 5th consecutive gain. Rallied from a 6-week base noted as a riskier "late-stage" base after finding prompt support again at its 50 DMA line ($85). Reported Mar '21 quarterly earnings +317% on +83% sales revenues versus the year ago period, adding to its strong earnings track record.
>>> FEATURED STOCK ARTICLE : New Base Formed May Be "Late Stage" - 7/21/2021 |
View all notes |
Set NEW NOTE alert |
Company Profile |
SEC
News |
Chart |
Request a new note
C
A
S
I |
Symbol/Exchange
Company Name
Industry Group |
PRICE |
CHANGE
(%Change) |
Day High |
Volume
(% DAV)
(% 50 day avg vol) |
52 Wk Hi
% From Hi |
Featured
Date |
Price
Featured |
Pivot Featured |
|
Max Buy |
JEF
-
NYSE
Jefferies Financial Grp
Finance-Invest Bnk/Bkrs
|
$32.52
|
-0.41
-1.25% |
$33.38
|
937,784
43.18% of 50 DAV
50 DAV is 2,172,000
|
$35.69
-8.88%
|
6/28/2021
|
$31.81
|
PP = $34.42
|
|
MB = $36.14
|
Most Recent Note - 7/19/2021 5:54:21 PM
Y - Gapped down today testing its 50 DMA line ($32.08). More damaging losses would raise concerns and trigger a technical sell signal. As previously noted - "Subsequent gains above the pivot point backed by at least +40% above average volume are necessary to trigger a technical buy signal."
>>> FEATURED STOCK ARTICLE : High-Ranked Financial Firm Formed "Double Bottom" Base - 6/28/2021 |
View all notes |
Set NEW NOTE alert |
Company Profile |
SEC
News |
Chart |
Request a new note
C
A
S
I |
CLAR
-
NASDAQ
Clarus Corporation
Leisure-Products
|
$28.27
|
+0.19
0.68% |
$28.54
|
106,909
46.28% of 50 DAV
50 DAV is 231,000
|
$28.70
-1.50%
|
5/12/2021
|
$21.40
|
PP = $19.73
|
|
MB = $20.72
|
Most Recent Note - 7/21/2021 12:38:42 PM
G - Hitting another new 52-week high today with a gain backed by above average volume. It did not form a sound base of sufficient length. Its 50 DMA line ($24.67) defines important near-term support to watch. See the latest FSU analysis for more details and an annotated graph.
>>> FEATURED STOCK ARTICLE : Extended From Prior Base and Hitting Another New High - 7/20/2021 |
View all notes |
Set NEW NOTE alert |
Company Profile |
SEC
News |
Chart |
Request a new note
C
A
S
I |
AVTR
-
NYSE
Avantor Inc
Medical-Research Eqp/Svc
|
$37.18
|
+0.08
0.22% |
$37.50
|
2,930,388
76.29% of 50 DAV
50 DAV is 3,841,000
|
$37.35
-0.46%
|
6/10/2021
|
$32.94
|
PP = $34.09
|
|
MB = $35.79
|
Most Recent Note - 7/20/2021 5:21:50 PM
G - Posted a solid gain today for a new all-time high. Prior highs in the $33 area coincide with its 50 DMA line defining important support to watch on pullbacks.
>>> FEATURED STOCK ARTICLE : Held Ground But Made Little Price Progress Since Featured - 7/14/2021 |
View all notes |
Set NEW NOTE alert |
Company Profile |
SEC
News |
Chart |
Request a new note
C
A
S
I |
|
|
|
THESE ARE NOT BUY RECOMMENDATIONS!
Comments contained in the body of this report are technical
opinions only. The material herein has been obtained
from sources believed to be reliable and accurate, however,
its accuracy and completeness cannot be guaranteed.
This site is not an investment advisor, hence it does
not endorse or recommend any securities or other investments.
Any recommendation contained in this report may not
be suitable for all investors and it is not to be deemed
an offer or solicitation on our part with respect to
the purchase or sale of any securities. All trademarks,
service marks and trade names appearing in this report
are the property of their respective owners, and are
likewise used for identification purposes only.
This report is a service available
only to active Paid Premium Members.
You may opt-out of receiving report notifications
at any time. Questions or comments may be submitted
by writing to Premium Membership Services 665 S.E. 10 Street, Suite 201 Deerfield Beach, FL 33441-5634 or by calling 1-800-965-8307
or 954-785-1121.
|
|
|