You are not logged in.
This means you
CAN ONLY VIEW reports that were published prior to Thursday, March 20, 2025.
You
MUST UPGRADE YOUR MEMBERSHIP if you want to see any current reports.
AFTER MARKET UPDATE - TUESDAY, JULY 27TH, 2021
Previous After Market Report Next After Market Report >>>
|
|
|
|
DOW |
-85.79 |
35,058.52 |
-0.24% |
|
Volume |
881,110,588 |
+1% |
|
Volume |
4,261,187,200 |
-2% |
|
NASDAQ |
-178.40 |
14,662.31 |
-1.20% |
|
Advancers |
1,163 |
36% |
|
Advancers |
1,215 |
28% |
|
S&P 500 |
-20.80 |
4,401.50 |
-0.47% |
|
Decliners |
2,061 |
64% |
|
Decliners |
3,090 |
72% |
|
Russell 2000 |
-25.09 |
2,191.83 |
-1.13% |
|
52 Wk Highs |
98 |
|
|
52 Wk Highs |
58 |
|
|
S&P 600 |
-11.27 |
1,318.72 |
-0.85% |
|
52 Wk Lows |
65 |
|
|
52 Wk Lows |
241 |
|
|
 |
Leadership Thinned as Major Indices Retreated From Record Levels
Kenneth J. Gruneisen - Passed the CAN SLIM® Master's Exam
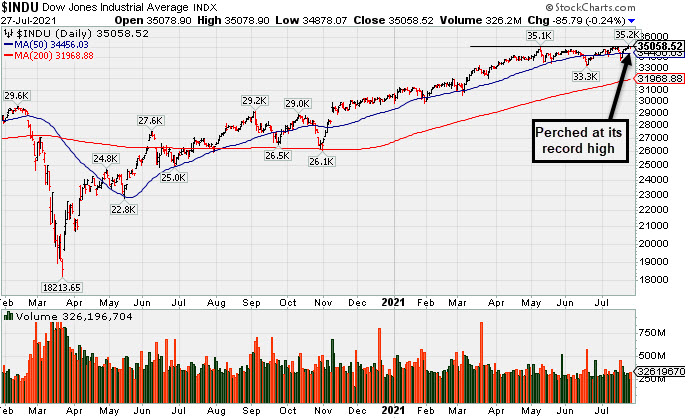
The Dow lost 85 points, while the S&P 500 fell 0.5%. The Nasdaq Composite dropped 1.2%, for its biggest single-day decline since mid-May. All three benchmarks retreated from yesterday’s record levels, snapping a five-session winning streak. The volume totals reported were mixed, higher than the prior session on the NYSE and lighter on the Nasdaq exchange. Breadth was negative as decliners led advancers by almost a 2-1 margin on the NYSE and nearly 3-1 on the Nasdaq exchange. There were 18 high-ranked companies from the Leaders List that hit new 52-week highs and were listed on the BreakOuts Page versus 51 on the prior session. New 52-week highs totals contracted but still outnumbered new 52-week lows on the NYSE, however, new lows easily outnumbered new highs on the Nasdaq exchange. The major indices (M criteria) are in an uptrend that has come under pressure. Investors are reminded to always make buying and selling decisions on case-by-case basis under the strict criteria and rules of the fact-based investment system.
PICTURED: The Dow Jones Industrial average is perched near its new record high.
U.S. stocks ended firmly lower on Tuesday as investors assessed another steep sell-off in Asia and digest a deluge of corporate earnings and economic data. Overnight in Asia, Hong Kong's Hang Seng Index shed more than 4% for a second day as market participants digested Beijing's most recent wave of regulatory overhauls. On the data front in the US, the Conference Board's gauge of consumer confidence posted a surprise jump to a fresh pandemic-era peak. Separately, a preliminary reading showed durable goods orders increased by less than expected in June, though the prior figure was upwardly revised by nearly 1% to reflect a robust 3.2% gain. Rounding out the docket, a measure of national home prices once again surged the most on record since 1988 in May.
Longer-dated Treasuries strengthened, with the yield on the 10-year note down five basis points to 1.24%. Six of 11 S&P 500 sectors closed in positive territory, with the traditionally defensive groups outperforming. The Information Technology, Communication Services and Consumer Discretionary shares each fell more than 1% with the oft-cited “FAANG” group sinking 1.6% ahead of the cohort’s earnings releases. United Parcel Service (UPS -6.99%) fell as a decline in shipping volume overshadowed upbeat quarterly figures. Meg-cap Tesla (TSLA -1.95%) fell despite surpassing the $1 billion in quarterly net income level. |
 Kenneth J. Gruneisen started out as a licensed stockbroker in August 1987, a couple of months prior to the historic stock market crash that took the Dow Jones Industrial Average down -22.6% in a single day. He has published daily fact-based fundamental and technical analysis on high-ranked stocks online for two decades. Through FACTBASEDINVESTING.COM, Kenneth provides educational articles, news, market commentary, and other information regarding proven investment systems that work in good times and bad.
Comments contained in the body of this report are technical opinions only and are not necessarily those of Gruneisen Growth Corp. The material herein has been obtained from sources believed to be reliable and accurate, however, its accuracy and completeness cannot be guaranteed. Our firm, employees, and customers may effect transactions, including transactions contrary to any recommendation herein, or have positions in the securities mentioned herein or options with respect thereto. Any recommendation contained in this report may not be suitable for all investors and it is not to be deemed an offer or solicitation on our part with respect to the purchase or sale of any securities. |
|
 |
Retail, Energy, and Semiconductor Indexes Led Group Decliners
Kenneth J. Gruneisen - Passed the CAN SLIM® Master's Exam
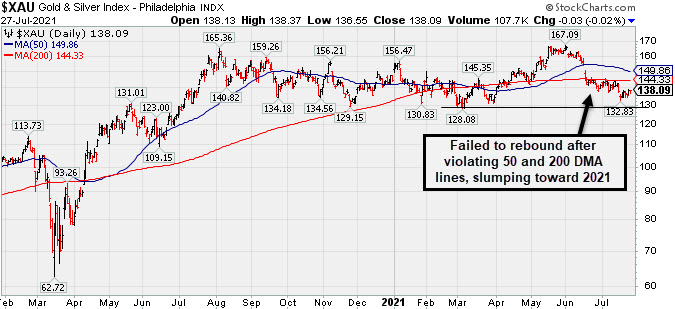
A loss for the Retail Index ($RLX -1.58%) created a drag on the major indices while the Broker/Dealer Index ($XBD -0.87%) also slumped and the Bank Index ($BKX -0.12%) edged lower. The Semiconductor Index ($SOX -1.83%) led the tech sector lower while the Networking Index ($NWX -0.76%) and Biotech Index ($BTK -0.47%) also suffered modest losses. The Oil Services Index ($OSX -1.63%) and Integrated Oil Index ($XOI -1.10%) both had a negative bias while the Gold & Silver Index ($XAU -0.02%) finished flat.
PICTURED: The Gold & Silver Index ($XAU -0.02%) failed to rebound after slumping below its 50-day and 200-day moving average (DMA) lines, and it has been slumping back toward the 2021 low.
| Oil Services |
$OSX |
56.03 |
-0.93 |
-1.63% |
+26.40% |
| Integrated Oil |
$XOI |
1,013.15 |
-11.27 |
-1.10% |
+27.85% |
| Semiconductor |
$SOX |
3,216.80 |
-60.11 |
-1.83% |
+15.07% |
| Networking |
$NWX |
841.34 |
-6.43 |
-0.76% |
+17.32% |
| Broker/Dealer |
$XBD |
456.82 |
-4.03 |
-0.87% |
+20.98% |
| Retail |
$RLX |
4,152.56 |
-66.79 |
-1.58% |
+16.54% |
| Gold & Silver |
$XAU |
138.09 |
-0.03 |
-0.02% |
-4.23% |
| Bank |
$BKX |
121.99 |
-0.14 |
-0.12% |
+24.60% |
| Biotech |
$BTK |
5,659.10 |
-26.95 |
-0.47% |
-1.39% |
|
|
|
 |
Pulled Back After Streak of Gains Challenging 52-Week High
Kenneth J. Gruneisen - Passed the CAN SLIM® Master's Exam
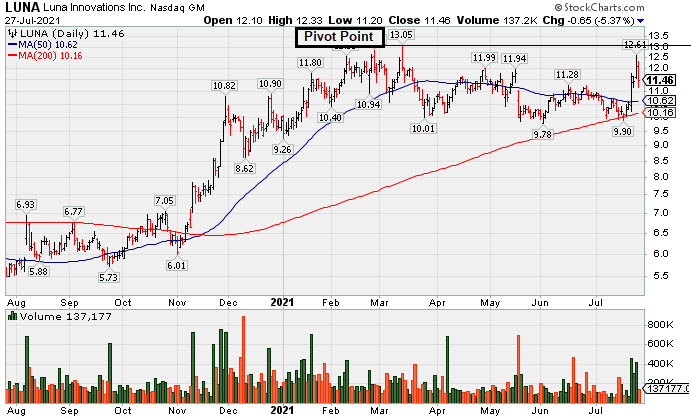
Luna Innovations Inc (LUNA -$0.69 or -5.70% to $11.42) pulled back today with average volume after a streak of 5 consecutive gains with the 3 latest marked by higher volume. It was highlighted in yellow in the 7/26/21 mid-day report (read here) with pivot point cited based on its 3/12/21 high plus 10 cents. LUNA rallied impressively from support at its 200 DMA line, nearly challenging its 52-week high. Subsequent gains above the pivot point backed by at least +40% above average volume may trigger a technical buy signal.
The company has a 96 Earnings Per Share Rating. It reported Mar '21 quarterly earnings +50% on +53% sales revenues versus the year ago period, its 4th strong quarterly comparison (C criteria). Annual earnings (A criteria) history has improved in recent years, helping it match with the fundamental guidelines of the fact-based investment systems.
There are only 31.4 million shares outstanding (S criteria). The number of top-rated funds owning its shares rose from 130 in Sep '20 to 149 in Mar '21, a reassuring sign concerning the I criteria. Its current Up/Down Volume Ratio is 1.1 an unbiased indication its shares have been under slight accumulation over the past 50 days. It has a Timeliness Rating of C and a Sponsorship Rating of C.
|
|
|
Color Codes Explained :
Y - Better candidates highlighted by our
staff of experts.
G - Previously featured
in past reports as yellow but may no longer be buyable under the
guidelines.
***Last / Change / Volume data in this table is the closing quote data***
Symbol/Exchange
Company Name
Industry Group |
PRICE |
CHANGE
(%Change) |
Day High |
Volume
(% DAV)
(% 50 day avg vol) |
52 Wk Hi
% From Hi |
Featured
Date |
Price
Featured |
Pivot Featured |
|
Max Buy |
 SIVB
-
NASDAQ
SIVB
-
NASDAQ
S V B Financial Group
BANKING - Regional - Pacific Banks
|
$554.32
|
-10.64
-1.88% |
$560.18
|
265,998
71.89% of 50 DAV
50 DAV is 370,000
|
$608.84
-8.95%
|
4/23/2021
|
$579.70
|
PP = $577.16
|
|
MB = $606.02
|
 Most Recent Note - 7/27/2021 1:27:23 PM
G - Reported Jun '21 quarterly earnings +106% on +69% sales revenues versus the year ago period, continuing its strong earnings track record. Remains below its 50 DMA line ($568). A rebound above the 50 DMA line is needed for its outlook to improve.
>>> FEATURED STOCK ARTICLE : Consolidating Near 50-Day Average After Distributional Pressure - 6/25/2021 |
View all notes |
Set NEW NOTE alert |
Company Profile |
SEC
News |
Chart |
Request a new note
C
A
S
I |
LOGI
-
NASDAQ
Logitech Intl Sa
COMPUTER HARDWARE - Computer Peripherals
|
$108.45
|
-12.42
-10.28% |
$111.71
|
4,058,771
533.35% of 50 DAV
50 DAV is 761,000
|
$140.17
-22.63%
|
5/26/2021
|
$119.13
|
PP = $120.34
|
|
MB = $126.36
|
Most Recent Note - 7/27/2021 9:55:38 AM
G - Gapped down today after reporting Jun '21 quarterly earnings +91% on +66% sales revenues versus the year ago period. Volume and volatility often increase near earnings news. Met noted resistance when rebounding near its 50 DMA line. Its 200 DMA line ($105) defines the next important chart support.
>>> FEATURED STOCK ARTICLE : Recent Pullback is Testing Important Technical Support - 7/2/2021 |
View all notes |
Set NEW NOTE alert |
Company Profile |
SEC
News |
Chart |
Request a new note
C
A
S
I |
CROX
-
NASDAQ
Crocs Inc
CONSUMER NON-DURABLES - Textile - Apparel Footwear
|
$128.69
|
-3.13
-2.37% |
$131.37
|
1,060,325
70.97% of 50 DAV
50 DAV is 1,494,000
|
$136.50
-5.72%
|
6/14/2021
|
$112.64
|
PP = $110.01
|
|
MB = $115.51
|
Most Recent Note - 7/27/2021 1:31:32 PM
G - Slumping today with light volume. Powered into new all-time high territory on 7/22/21 when last noted "getting extended from any sound base." Found support at its 50 DMA line ($110.87).
>>> FEATURED STOCK ARTICLE : Quietly Consolidating Below "Max Buy" Level - 7/7/2021 |
View all notes |
Set NEW NOTE alert |
Company Profile |
SEC
News |
Chart |
Request a new note
C
A
S
I |
CRL
-
NYSE
Charles River Labs Intl
DRUGS - Biotechnology
|
$392.75
|
-0.52
-0.13% |
$393.87
|
314,267
72.58% of 50 DAV
50 DAV is 433,000
|
$397.61
-1.22%
|
6/9/2021
|
$345.91
|
PP = $349.23
|
|
MB = $366.69
|
Most Recent Note - 7/26/2021 5:08:10 PM
G - Recent volume totals have been below average while wedging into record high territory. Its 50 DMA line ($358) and prior high in the $349 area define near-term support to watch on pullbacks. Two of the past 3 quarterly comparisons through Mar '21 have been above the +25% minimum earnings guideline (C criteria).
>>> FEATURED STOCK ARTICLE : Volume Totals Cooling While Perched at High - 7/13/2021 |
View all notes |
Set NEW NOTE alert |
Company Profile |
SEC
News |
Chart |
Request a new note
C
A
S
I |
GNRC
-
NYSE
Generac Hldgs Inc
Electrical-Power/Equipmt
|
$438.92
|
-5.73
-1.29% |
$442.24
|
645,115
86.83% of 50 DAV
50 DAV is 743,000
|
$457.00
-3.96%
|
6/8/2021
|
$348.46
|
PP = $342.38
|
|
MB = $359.50
|
Most Recent Note - 7/27/2021 1:25:04 PM
G - Quietly pulling back after recently wedging to new all-time highs, very extended from the previously noted base. Its 50 DMA line ($380) and prior high ($364) define important near-term support to watch on pullbacks. Fundamentals remain strong.
>>> FEATURED STOCK ARTICLE : Gain for New High Leaves GNRC Very Extended From Prior Base - 7/12/2021 |
View all notes |
Set NEW NOTE alert |
Company Profile |
SEC
News |
Chart |
Request a new note
C
A
S
I |
Symbol/Exchange
Company Name
Industry Group |
PRICE |
CHANGE
(%Change) |
Day High |
Volume
(% DAV)
(% 50 day avg vol) |
52 Wk Hi
% From Hi |
Featured
Date |
Price
Featured |
Pivot Featured |
|
Max Buy |
CAMT
-
NASDAQ
Camtek Ltd
ELECTRONICS - Scientific and Technical Instrum
|
$33.78
|
-1.48
-4.20% |
$35.12
|
155,112
59.20% of 50 DAV
50 DAV is 262,000
|
$40.47
-16.53%
|
4/28/2021
|
$35.03
|
PP = $35.34
|
|
MB = $37.11
|
Most Recent Note - 7/27/2021 1:16:26 PM
G - Slumping well below its 50 DMA line ($35.51) with today's big loss. Subsequent gains above the 50 DMA line would help its outlook improve. Due to report Jun '21 quarterly results on 8/04/21.
>>> FEATURED STOCK ARTICLE : Loss With Light Volume Undercut 50-Day Moving Average - 7/8/2021 |
View all notes |
Set NEW NOTE alert |
Company Profile |
SEC
News |
Chart |
Request a new note
C
A
S
I |
PKI
-
NYSE
Perkinelmer Inc
ELECTRONICS - Scientific and Technical Instrum
|
$170.16
|
-1.95
-1.13% |
$174.52
|
949,785
131.55% of 50 DAV
50 DAV is 722,000
|
$173.39
-1.86%
|
7/26/2021
|
$168.06
|
PP = $162.80
|
|
MB = $170.94
|
Most Recent Note - 7/27/2021 12:24:58 PM
Y - Finished strong on the prior session after highlighted in yellow in the mid-day report with pivot point cited based on its 1/11/21 high plus 10 cents . Hit a new all-time high with +186% above average volume behind its 8th consecutive gain triggering a technical buy signal. Reported earnings +80% on +51% sales revenues for the Jun '21 quarter versus the year ago period, its 6th strong quarterly comparison above the +25% minimum guideline (C criteria). Annual earnings (A criteria) history has improved steadily. See the latest FSU report for more detailed analysis and an annotated graph.
>>> FEATURED STOCK ARTICLE : Powerful Volume-Driven Breakout After Earnings Report - 7/26/2021 |
View all notes |
Set NEW NOTE alert |
Company Profile |
SEC
News |
Chart |
Request a new note
C
A
S
I |
ASML
-
NASDAQ
A S M L Holding N.V. NY
ELECTRONICS - Semiconductor Equipment and Mate
|
$745.60
|
-8.49
-1.13% |
$752.15
|
874,131
117.97% of 50 DAV
50 DAV is 741,000
|
$759.00
-1.77%
|
5/25/2021
|
$669.59
|
PP = $675.75
|
|
MB = $709.54
|
Most Recent Note - 7/27/2021 12:07:37 PM
G - Retreating today, it rallied well above its "max buy" level and hit new all-time highs with 5 consecutive volume-driven gains. Its 50 DMA line ($687) defines important near-term support to watch on pullbacks.
>>> FEATURED STOCK ARTICLE : Volume Higher While Pulling Back Toward 50-Day Moving Average - 7/1/2021 |
View all notes |
Set NEW NOTE alert |
Company Profile |
SEC
News |
Chart |
Request a new note
C
A
S
I |
LUNA
-
NASDAQ
Luna Innovations Inc
Medical-Research Eqp/Svc
|
$11.42
|
-0.69
-5.70% |
$12.33
|
162,928
96.98% of 50 DAV
50 DAV is 168,000
|
$13.05
-12.49%
|
7/26/2021
|
$12.46
|
PP = $13.15
|
|
MB = $13.81
|
Most Recent Note - 7/27/2021 4:14:07 PM
Y - Pulled back today with average volume after a streak of 5 consecutive gains with the 3 latest marked by higher volume. Highlighted in yellow in the 7/26/21 mid-day report with pivot point cited based on its 3/12/21 high plus 10 cents. Rallied impressively from support at its 200 DMA line, nearly challenging its 52-week high. Subsequent gains above the pivot point backed by at least +40% above average volume may trigger a technical buy signal. Reported Mar '21 quarterly earnings +50% on +53% sales revenues versus the year ago period, its 4th strong quarterly comparison (C criteria). Annual earnings (A criteria) history has improved in recent years, helping it match with the fundamental guidelines of the fact-based investment system. See the latest FSU analysis for more details and a new annotated graph.
>>> FEATURED STOCK ARTICLE : Pulled Back After Streak of Gains Challenging 52-Week High - 7/27/2021 |
View all notes |
Set NEW NOTE alert |
Company Profile |
SEC
News |
Chart |
Request a new note
C
A
S
I |
CLFD
-
NASDAQ
Clearfield Inc
TELECOMMUNICATIONS - Cables / Satalite Equipment
|
$40.20
|
-0.96
-2.33% |
$41.69
|
167,237
135.97% of 50 DAV
50 DAV is 123,000
|
$45.36
-11.38%
|
7/23/2021
|
$40.23
|
PP = $43.74
|
|
MB = $45.93
|
Most Recent Note - 7/26/2021 12:03:27 PM
Y - Reversed into the red, encountering distributional pressure after its early gain today into new high territory. Finished strong on the prior session after highlighted in yellow with new pivot point cited based on its 6/07/21 high plus 10 cents. Gapped up rebounding above its 50 DMA line with heavy volume behind the gain helping its outlook to improve as it was noted - "Subsequent gains above the pivot point with volume may trigger a new (or add-on) technical buy signal. Fundamentals remain strong. Bullish action came after it reported Jun '21 quarterly earnings +100% on +49% sales revenues."
>>> FEATURED STOCK ARTICLE : Big Volume-Driven Gain Challenging Prior High After Earnings - 7/23/2021 |
View all notes |
Set NEW NOTE alert |
Company Profile |
SEC
News |
Chart |
Request a new note
C
A
S
I |
Symbol/Exchange
Company Name
Industry Group |
PRICE |
CHANGE
(%Change) |
Day High |
Volume
(% DAV)
(% 50 day avg vol) |
52 Wk Hi
% From Hi |
Featured
Date |
Price
Featured |
Pivot Featured |
|
Max Buy |
POOL
-
NASDAQ
Pool Corp
WHOLESALE - Basic Materials Wholesale
|
$471.87
|
+4.91
1.05% |
$472.79
|
236,571
88.40% of 50 DAV
50 DAV is 267,600
|
$478.67
-1.42%
|
6/21/2021
|
$455.09
|
PP = $449.54
|
|
MB = $472.02
|
Most Recent Note - 7/26/2021 12:31:18 PM
Y - Posting a 2nd consecutive gain today challenging its high after finding support at its 50 DMA line ($448) last week. Reported Jun '21 quarterly earnings +66% on +40% sales revenues versus the year ago period. Recent losses have tested prior highs in the $449-444 range and its 50 DMA line which define important support. More damaging losses would raise concerns and trigger a technical sell signal.
>>> FEATURED STOCK ARTICLE : Churned Heavy Volume While Testing 50-Day Moving Average - 7/22/2021 |
View all notes |
Set NEW NOTE alert |
Company Profile |
SEC
News |
Chart |
Request a new note
C
A
S
I |
FSBW
-
NASDAQ
F S Bancorp
Banks-West/Southwest
|
$34.78
|
-1.13
-3.15% |
$35.99
|
35,784
115.43% of 50 DAV
50 DAV is 31,000
|
$36.85
-5.62%
|
5/18/2021
|
$35.08
|
PP = $36.85
|
|
MB = $38.69
|
Most Recent Note - 7/27/2021 1:23:47 PM
Y - Consolidating near its 50 DMA line ($35.21). Reported Jun '21 quarterly earnings -16% on -11% sales revenues versus the year ago period raising fundamental concerns. Do not be confused by a 2:1 stock split which impacted share prices as of 7/15/21 (Featured Price, Pivot Point, and Max Buy levels were updated accordingly).
>>> FEATURED STOCK ARTICLE : Still Consolidating With Close Striking Distance of All-Time High - 6/24/2021 |
View all notes |
Set NEW NOTE alert |
Company Profile |
SEC
News |
Chart |
Request a new note
C
A
S
I |
SMPL
-
NASDAQ
Simply Good Foods Co
Food-Confectionery
|
$37.05
|
-0.54
-1.44% |
$37.60
|
257,513
47.95% of 50 DAV
50 DAV is 537,000
|
$38.50
-3.77%
|
12/28/2020
|
$30.40
|
PP = $31.44
|
|
MB = $33.01
|
Most Recent Note - 7/27/2021 1:28:28 PM
G - Still holding its ground near its all-time high with volume totals cooling. Its 50 DMA line ($35.77) and prior highs in the $35 area define important near-term support to watch on pullbacks. Reported May '21 quarterly earnings +65% on +32% sales revenues versus the year ago period, well above the +25% minimum earnings guideline (C criteria).
>>> FEATURED STOCK ARTICLE : Pulled Back from High With Small Losses on Light Volume - 7/15/2021 |
View all notes |
Set NEW NOTE alert |
Company Profile |
SEC
News |
Chart |
Request a new note
C
A
S
I |
PYPL
-
NASDAQ
Paypal Holdings Inc
Finance-CrdtCard/PmtPr
|
$300.48
|
-6.32
-2.06% |
$306.34
|
6,856,095
120.24% of 50 DAV
50 DAV is 5,702,000
|
$310.16
-3.12%
|
7/27/2021
|
$296.69
|
PP = $307.82
|
|
MB = $323.21
|
Most Recent Note - 7/27/2021 12:34:32 PM
Y - Color code is changed to yellow with new pivot point cited based on its 7/13/21 high after a cup-with-handle base. Pulling back after quietly wedging to a new all-time high. Subsequent gains above its pivot point backed by at least +40% above average volume may trigger a new buy signal. Due to report Jun '21 quarterly results tomorrow. Volume and volatility often increase near earnings news. Reported Mar '21 quarterly earnings +85% on +31% sales revenues versus the year ago period, its 4th strong comparison above the +25% minimum guideline (C criteria). Annual earnings (A criteria) growth has been strong and steady.
>>> FEATURED STOCK ARTICLE : Perched Near Record High Ahead of Earnings News - 7/23/2019 |
View all notes |
Set NEW NOTE alert |
Company Profile |
SEC
News |
Chart |
Request a new note
C
A
S
I |
SHOP
-
NYSE
Shopify Inc Cl A
Computer Sftwr-Enterprse
|
$1,555.10
|
-27.18
-1.72% |
$1,602.42
|
1,697,846
121.45% of 50 DAV
50 DAV is 1,398,000
|
$1,650.00
-5.75%
|
7/2/2021
|
$1,468.00
|
PP = $1,552.23
|
|
MB = $1,629.84
|
Most Recent Note - 7/26/2021 12:37:19 PM
Y - Color code is changed to yellow after pulling back below its "max buy" level today following a streak of 6 consecutive gains. Its recent low and 50 DMA line ($1373) define near term support to watch.
>>> FEATURED STOCK ARTICLE : Managed a Positive Reversal After Early Weakness - 7/19/2021 |
View all notes |
Set NEW NOTE alert |
Company Profile |
SEC
News |
Chart |
Request a new note
C
A
S
I |
Symbol/Exchange
Company Name
Industry Group |
PRICE |
CHANGE
(%Change) |
Day High |
Volume
(% DAV)
(% 50 day avg vol) |
52 Wk Hi
% From Hi |
Featured
Date |
Price
Featured |
Pivot Featured |
|
Max Buy |
YETI
-
NYSE
Yeti Holdings Inc
Leisure-Products
|
$96.02
|
-1.54
-1.58% |
$97.55
|
519,730
40.01% of 50 DAV
50 DAV is 1,299,000
|
$98.79
-2.80%
|
5/13/2021
|
$84.20
|
PP = $90.65
|
|
MB = $95.18
|
Most Recent Note - 7/27/2021 4:08:24 PM
G - Holding its ground above its "max buy" level with volume totals cooling. Its 50 DMA line ($90.44) and recent low define important near-term support where more damaging losses would raise greater concerns. Fundamentals remain strong.
>>> FEATURED STOCK ARTICLE : Volume Totals Cooling While Consolidating Near High - 7/9/2021 |
View all notes |
Set NEW NOTE alert |
Company Profile |
SEC
News |
Chart |
Request a new note
C
A
S
I |
DOCU
-
NASDAQ
Docusign Inc
Computer Sftwr-Enterprse
|
$302.04
|
-3.73
-1.22% |
$306.94
|
1,711,700
57.44% of 50 DAV
50 DAV is 2,980,000
|
$310.51
-2.73%
|
7/6/2021
|
$288.96
|
PP = $290.33
|
|
MB = $304.85
|
Most Recent Note - 7/27/2021 1:21:37 PM
Y - Quietly pulling back from its all-time high after wedging into new high territory with recent gains lacking great volume conviction. Prior low ($270.41 on 7/15/21) defines initial support above its 50 DMA line.
>>> FEATURED STOCK ARTICLE : Touched New High With Average Volume Behind Today's Gain - 7/6/2021 |
View all notes |
Set NEW NOTE alert |
Company Profile |
SEC
News |
Chart |
Request a new note
C
A
S
I |
XPEL
-
NASDAQ
Xpel Inc
Auto/Truck-Tires andamp; Misc
|
$85.59
|
-9.75
-10.23% |
$95.07
|
572,313
263.74% of 50 DAV
50 DAV is 217,000
|
$103.84
-17.58%
|
7/21/2021
|
$92.25
|
PP = $94.31
|
|
MB = $99.03
|
Most Recent Note - 7/27/2021 1:35:21 PM
G - Color code is changed to green with today's big volume-driven loss after abruptly reversing from its all-time high raising concerns. Fell below its 50 DMA line ($85.71) and back into the prior base noted as a riskier "late-stage" base. Reported Mar '21 quarterly earnings +317% on +83% sales revenues versus the year ago period, adding to its strong earnings track record.
>>> FEATURED STOCK ARTICLE : New Base Formed May Be "Late Stage" - 7/21/2021 |
View all notes |
Set NEW NOTE alert |
Company Profile |
SEC
News |
Chart |
Request a new note
C
A
S
I |
JEF
-
NYSE
Jefferies Financial Grp
Finance-Invest Bnk/Bkrs
|
$32.84
|
-0.05
-0.15% |
$32.87
|
1,051,057
49.74% of 50 DAV
50 DAV is 2,113,000
|
$35.69
-7.99%
|
6/28/2021
|
$31.81
|
PP = $34.42
|
|
MB = $36.14
|
Most Recent Note - 7/26/2021 5:09:22 PM
Y - Found support when recently testing its 50 DMA line ($32.13). More damaging losses would raise concerns and trigger a technical sell signal. As previously noted - "Subsequent gains above the pivot point backed by at least +40% above average volume are necessary to trigger a technical buy signal."
>>> FEATURED STOCK ARTICLE : High-Ranked Financial Firm Formed "Double Bottom" Base - 6/28/2021 |
View all notes |
Set NEW NOTE alert |
Company Profile |
SEC
News |
Chart |
Request a new note
C
A
S
I |
CLAR
-
NASDAQ
Clarus Corporation
Leisure-Products
|
$28.34
|
-0.23
-0.81% |
$28.55
|
112,104
50.27% of 50 DAV
50 DAV is 223,000
|
$28.86
-1.80%
|
5/12/2021
|
$21.40
|
PP = $19.73
|
|
MB = $20.72
|
Most Recent Note - 7/27/2021 1:18:01 PM
G - Hovering near its 52-week high with volume totals cooling, extended from any sound base of sufficient length. Its 50 DMA line ($25.24) defines important near-term support to watch.
>>> FEATURED STOCK ARTICLE : Extended From Prior Base and Hitting Another New High - 7/20/2021 |
View all notes |
Set NEW NOTE alert |
Company Profile |
SEC
News |
Chart |
Request a new note
C
A
S
I |
Symbol/Exchange
Company Name
Industry Group |
PRICE |
CHANGE
(%Change) |
Day High |
Volume
(% DAV)
(% 50 day avg vol) |
52 Wk Hi
% From Hi |
Featured
Date |
Price
Featured |
Pivot Featured |
|
Max Buy |
AVTR
-
NYSE
Avantor Inc
Medical-Research Eqp/Svc
|
$36.96
|
+0.09
0.24% |
$37.05
|
2,896,048
77.46% of 50 DAV
50 DAV is 3,739,000
|
$37.50
-1.44%
|
6/10/2021
|
$32.94
|
PP = $34.09
|
|
MB = $35.79
|
Most Recent Note - 7/27/2021 1:08:20 PM
G - Volume totals have been cooling while stubbornly holding ground near its all-time high. Due to release its financial results for the second quarter 2021 after the market closes on Thursday, July 29, 2021. Volume and volatility often increase near earnings news. Its 50 DMA line coincides with the prior high in the $34 area defining important support to watch on pullbacks.
>>> FEATURED STOCK ARTICLE : Held Ground But Made Little Price Progress Since Featured - 7/14/2021 |
View all notes |
Set NEW NOTE alert |
Company Profile |
SEC
News |
Chart |
Request a new note
C
A
S
I |
|
|
|
THESE ARE NOT BUY RECOMMENDATIONS!
Comments contained in the body of this report are technical
opinions only. The material herein has been obtained
from sources believed to be reliable and accurate, however,
its accuracy and completeness cannot be guaranteed.
This site is not an investment advisor, hence it does
not endorse or recommend any securities or other investments.
Any recommendation contained in this report may not
be suitable for all investors and it is not to be deemed
an offer or solicitation on our part with respect to
the purchase or sale of any securities. All trademarks,
service marks and trade names appearing in this report
are the property of their respective owners, and are
likewise used for identification purposes only.
This report is a service available
only to active Paid Premium Members.
You may opt-out of receiving report notifications
at any time. Questions or comments may be submitted
by writing to Premium Membership Services 665 S.E. 10 Street, Suite 201 Deerfield Beach, FL 33441-5634 or by calling 1-800-965-8307
or 954-785-1121.
|
|
|