You are not logged in.
This means you
CAN ONLY VIEW reports that were published prior to Thursday, March 20, 2025.
You
MUST UPGRADE YOUR MEMBERSHIP if you want to see any current reports.
AFTER MARKET UPDATE - TUESDAY, JULY 13TH, 2021
Previous After Market Report Next After Market Report >>>
|
|
|
|
DOW |
-107.39 |
34,888.79 |
-0.31% |
|
Volume |
779,516,356 |
-1% |
|
Volume |
4,520,889,800 |
+18% |
|
NASDAQ |
-58.92 |
14,674.31 |
-0.40% |
|
Advancers |
838 |
26% |
|
Advancers |
1,055 |
25% |
|
S&P 500 |
-15.42 |
4,369.21 |
-0.35% |
|
Decliners |
2,413 |
74% |
|
Decliners |
3,209 |
75% |
|
Russell 2000 |
-42.96 |
2,238.86 |
-1.88% |
|
52 Wk Highs |
140 |
|
|
52 Wk Highs |
128 |
|
|
S&P 600 |
-26.20 |
1,338.99 |
-1.92% |
|
52 Wk Lows |
19 |
|
|
52 Wk Lows |
75 |
|
|
 |
Breadth Negative and Leadership Thinned as Major Indices Retreated
Kenneth J. Gruneisen - Passed the CAN SLIM® Master's Exam
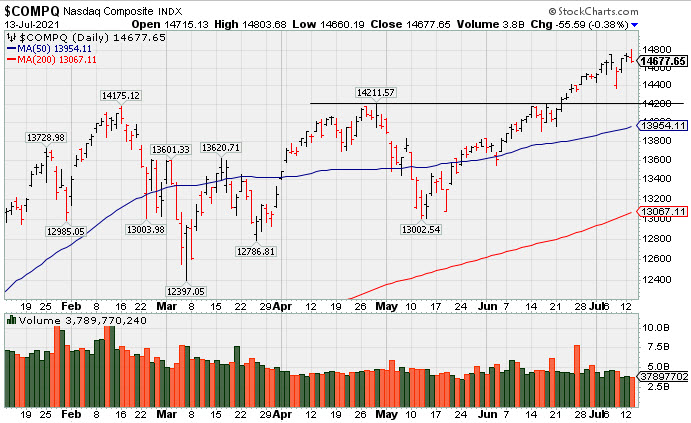
All three major averages drifted from their record closing levels notched on Monday, with the Dow falling 107 points. The S&P 500 and Nasdaq Composite each shed 0.4%. The volume totals reported were mixed, slightly lighter than the prior session on the NYSE and higher on the Nasdaq exchange. Breadth was negative as decliners led advancers by almost a 3-1 margin on the NYSE and on the Nasdaq exchange. There were 23 high-ranked companies from the Leaders List that hit new 52-week highs and were listed on the BreakOuts Page, versus 55 on the prior session. New 52-week highs totals contracted yet still outnumbered new 52-week lows on the NYSE and on the Nasdaq exchange. The major indices (M criteria) are in an uptrend. Investors are reminded to always make buying and selling decisions on case-by-case basis under the strict criteria and rules of the fact-based investment system.
PICTURED: The Nasdaq Composite Index reversed into the red after an early gain into record high.
The U.S. stocks closed lower on Tuesday as investors assessed corporate earnings reports and hotter-than-anticipated inflation data. Treasuries declined, with the longer-dated securities reversing earlier gains following weak demand for the 30-year bond auction. The yield on the 10-year note added three basis points to 1.40%.
Ten of 11 S&P 500 sectors ended in negative territory, with Information Technology the lone advancer. In earnings, Goldman Sachs (GS -1.19%) and JPMorgan Chase & Co (JPM -1.41%) both lost ground despite each firm easily surpassing Wall Street’s top and bottom line expectations. Elsewhere, PepsiCo (PEP +2.31%) rose after raising its full-year forecast. Conagra (CAG -5.43%) gapped down on the heels of downbeat guidance stemming from building price pressures. In other corporate news, Boeing (BA -4.23%) fell after cutting its delivery target for its 787 Dreamliner planes as a new defect was detected.
On the data front, the consumer price index (CPI) unexpectedly climbed 5.4% year-over-year in June, the highest since the onset of the 2008 Financial Crisis. Core CPI (excluding food and energy) jumped the most in nearly three decades (+4.5% annualized pace). Separately, the NFIB's gauge of small business optimism hit the highest level in eight months in June. Another update showed the U.S. budget deficit surpassed $2 trillion during the first three quarters of the fiscal year. In commodities, WTI crude rose to its highest level in 33-months amid concerns of tightening global supplies. In FOREX trading, the U.S. dollar gained 0.5%. |
 Kenneth J. Gruneisen started out as a licensed stockbroker in August 1987, a couple of months prior to the historic stock market crash that took the Dow Jones Industrial Average down -22.6% in a single day. He has published daily fact-based fundamental and technical analysis on high-ranked stocks online for two decades. Through FACTBASEDINVESTING.COM, Kenneth provides educational articles, news, market commentary, and other information regarding proven investment systems that work in good times and bad.
Comments contained in the body of this report are technical opinions only and are not necessarily those of Gruneisen Growth Corp. The material herein has been obtained from sources believed to be reliable and accurate, however, its accuracy and completeness cannot be guaranteed. Our firm, employees, and customers may effect transactions, including transactions contrary to any recommendation herein, or have positions in the securities mentioned herein or options with respect thereto. Any recommendation contained in this report may not be suitable for all investors and it is not to be deemed an offer or solicitation on our part with respect to the purchase or sale of any securities. |
|
 |
Gold & Silver Index Posts Small Gain on Widely Negative Session
Kenneth J. Gruneisen - Passed the CAN SLIM® Master's Exam
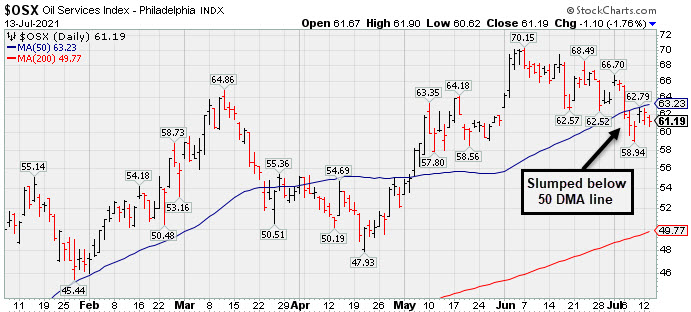
The Retail Index ($RLX -1.08%), Broker/Dealer Index ($XBD -0.78%), and Bank Index ($BKX -1.55%) ended unanimously lower, weighing on the major averages. The Semiconductor Index ($SOX -0.58%) and Biotech Index ($BTK -1.02%) both lost ground while the Networking Index ($NWX +0.01%) finished flat. Commodity-linked groups were mixed as the Oil Services Index ($OSX -1.79%) and Integrated Oil Index ($XOI -0.64%) both lost ground while the Gold & Silver Index ($XAU +0.92%) posted a gain.
PICTURED: The Oil Services Index ($OSX -1.79%) recently slumped below its 50-day moving average (DMA) line.
| Oil Services |
$OSX |
61.17 |
-1.12 |
-1.79% |
+37.99% |
| Integrated Oil |
$XOI |
1,094.69 |
-7.06 |
-0.64% |
+38.13% |
| Semiconductor |
$SOX |
3,299.72 |
-19.28 |
-0.58% |
+18.04% |
| Networking |
$NWX |
855.81 |
+0.12 |
+0.01% |
+19.34% |
| Broker/Dealer |
$XBD |
464.77 |
-3.64 |
-0.78% |
+23.09% |
| Retail |
$RLX |
4,146.23 |
-45.10 |
-1.08% |
+16.36% |
| Gold & Silver |
$XAU |
140.62 |
+1.28 |
+0.92% |
-2.48% |
| Bank |
$BKX |
123.96 |
-1.95 |
-1.55% |
+26.60% |
| Biotech |
$BTK |
5,783.70 |
-59.76 |
-1.02% |
+0.78% |
|
|
|
 |
Volume Totals Cooling While Perched at High
Kenneth J. Gruneisen - Passed the CAN SLIM® Master's Exam
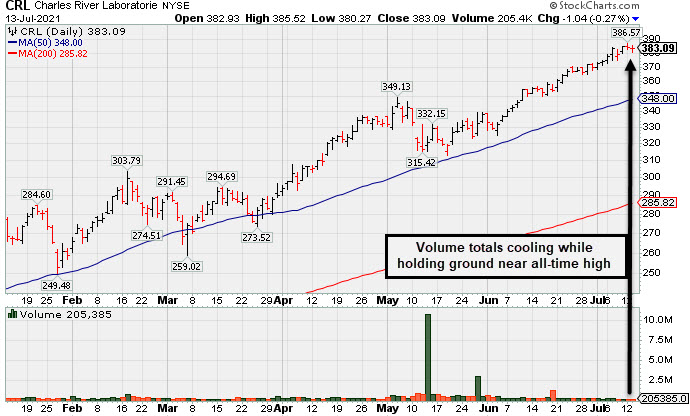
Charles River Labs Intl (CRL -$1.04 or -0.27% to $383.09) has seen volume totals cooling. Below average volume was behind recent gains as it wedged into record high territory. Prior highs in the $349 area and its 50-day moving average (DMA) line ($348) define near-term support to watch on pullbacks.
CRL has a 90 Earnings Per Share Rating. It reported Mar '21 quarterly earnings +38% on +17% sales revenues versus the year ago period. Two of the past 3 quarterly comparisons have been above the +25% minimum earnings guideline (C criteria).
The Medical - Research Equipment/Services industry group currently has an A- (77) Group Relative Strength Rating (L criteria). CRL traded up as much as +102% since it was highlighted in yellow with pivot point cited based on its 6/03/20 high plus 10 cents in the 7/15/20 mid-day report (read here). It was last shown in this FSU section on 6/09/21 with an annotated graph under the headline, "Building New Base After Strong Quarterly Earnings Report".
The number of top-rated funds owning its shares rose from 681 in Dec '19 to 1,042 in Jun '21. Its current Up/Down Volume Ratio of 2.3 is an unbiased indication its shares have been under accumulation over the past 50 days. There is a small number of only 50.3 million shares (S criteria) outstanding, which can contribute to greater price volatility in the event of institutional buying or selling.
|
|
|
Color Codes Explained :
Y - Better candidates highlighted by our
staff of experts.
G - Previously featured
in past reports as yellow but may no longer be buyable under the
guidelines.
***Last / Change / Volume data in this table is the closing quote data***
Symbol/Exchange
Company Name
Industry Group |
PRICE |
CHANGE
(%Change) |
Day High |
Volume
(% DAV)
(% 50 day avg vol) |
52 Wk Hi
% From Hi |
Featured
Date |
Price
Featured |
Pivot Featured |
|
Max Buy |
 SIVB
-
NASDAQ
SIVB
-
NASDAQ
S V B Financial Group
BANKING - Regional - Pacific Banks
|
$578.85
|
-14.81
-2.49% |
$588.02
|
278,312
73.24% of 50 DAV
50 DAV is 380,000
|
$608.84
-4.93%
|
4/23/2021
|
$579.70
|
PP = $577.16
|
|
MB = $606.02
|
Most Recent Note - 7/12/2021 1:00:49 PM
Y - With today's 2nd consecutive big gain it has rebounded above its 50 DMA line ($569.40) to nearly challenge its 52-week high and little resistance remains. Previously noted - "Confirming gains above the pivot point backed by at least +40% above average volume are still needed to help clinch a convincing technical buy signal. Reported earnings +293% on +64% sales revenues for the Mar '21 quarter versus the year ago period, its 3rd strong comparison. Completed a new Public Offering on 3/24/21."
>>> FEATURED STOCK ARTICLE : Consolidating Near 50-Day Average After Distributional Pressure - 6/25/2021 |
View all notes |
Set NEW NOTE alert |
Company Profile |
SEC
News |
Chart |
Request a new note
C
A
S
I |
LOGI
-
NASDAQ
Logitech Intl Sa
COMPUTER HARDWARE - Computer Peripherals
|
$122.23
|
-2.67
-2.14% |
$123.63
|
554,097
67.33% of 50 DAV
50 DAV is 823,000
|
$140.17
-12.80%
|
5/26/2021
|
$119.13
|
PP = $120.34
|
|
MB = $126.36
|
 Most Recent Note - 7/13/2021 5:31:44 PM
Y - Color code is changed to yellow after today's 4th consecutive small loss with below average volume, consolidating below its "max buy" level. Retesting near prior highs in the $120-117 area which define important support to watch along with its 50 DMA line ($120.61).
>>> FEATURED STOCK ARTICLE : Recent Pullback is Testing Important Technical Support - 7/2/2021 |
View all notes |
Set NEW NOTE alert |
Company Profile |
SEC
News |
Chart |
Request a new note
C
A
S
I |
CROX
-
NASDAQ
Crocs Inc
CONSUMER NON-DURABLES - Textile - Apparel Footwear
|
$117.06
|
-0.55
-0.47% |
$117.99
|
571,428
37.62% of 50 DAV
50 DAV is 1,519,000
|
$118.68
-1.37%
|
6/14/2021
|
$112.64
|
PP = $110.01
|
|
MB = $115.51
|
Most Recent Note - 7/9/2021 5:20:07 PM
G - Color code is changed to green after matching its best-ever close with today's gain backed by light volume as it rose above its "max buy" level. Its prior highs in the $109 area and its 50 DMA line ($106.55) define support to watch on pullbacks. See the latest FSU analysis for more details and a new annotated graph.
>>> FEATURED STOCK ARTICLE : Quietly Consolidating Below "Max Buy" Level - 7/7/2021 |
View all notes |
Set NEW NOTE alert |
Company Profile |
SEC
News |
Chart |
Request a new note
C
A
S
I |
CRL
-
NYSE
Charles River Labs Intl
DRUGS - Biotechnology
|
$383.09
|
-1.04
-0.27% |
$385.52
|
205,385
29.42% of 50 DAV
50 DAV is 698,000
|
$386.57
-0.90%
|
6/9/2021
|
$345.91
|
PP = $349.23
|
|
MB = $366.69
|
Most Recent Note - 7/13/2021 5:26:46 PM
G - Volume totals have been cooling. Below average volume was behind recent gains as it wedged into record high territory. Prior highs in the $349 area and its 50 DMA line ($348) define near-term support to watch on pullbacks. Two of the past 3 quarterly comparisons through Mar '21 have been above the +25% minimum earnings guideline (C criteria). See the latest FSU analysis for more details and a new annotated graph.
>>> FEATURED STOCK ARTICLE : Volume Totals Cooling While Perched at High - 7/13/2021 |
View all notes |
Set NEW NOTE alert |
Company Profile |
SEC
News |
Chart |
Request a new note
C
A
S
I |
GNRC
-
NYSE
Generac Hldgs Inc
Electrical-Power/Equipmt
|
$445.23
|
-2.92
-0.65% |
$451.44
|
888,234
117.18% of 50 DAV
50 DAV is 758,000
|
$452.92
-1.70%
|
6/8/2021
|
$348.46
|
PP = $342.38
|
|
MB = $359.50
|
Most Recent Note - 7/12/2021 5:15:22 PM
G - Volume was just +7% above average behind today's gain for yet another new all-time high, getting more extended from the previously noted base. Prior high ($364) defines initial support to watch on pullbacks. Fundamentals remain strong. See the latest FSU analysis for more details and a new annotated graph.
>>> FEATURED STOCK ARTICLE : Gain for New High Leaves GNRC Very Extended From Prior Base - 7/12/2021 |
View all notes |
Set NEW NOTE alert |
Company Profile |
SEC
News |
Chart |
Request a new note
C
A
S
I |
Symbol/Exchange
Company Name
Industry Group |
PRICE |
CHANGE
(%Change) |
Day High |
Volume
(% DAV)
(% 50 day avg vol) |
52 Wk Hi
% From Hi |
Featured
Date |
Price
Featured |
Pivot Featured |
|
Max Buy |
CAMT
-
NASDAQ
Camtek Ltd
ELECTRONICS - Scientific and Technical Instrum
|
$35.42
|
-0.15
-0.42% |
$35.73
|
118,602
40.07% of 50 DAV
50 DAV is 296,000
|
$40.47
-12.48%
|
4/28/2021
|
$35.03
|
PP = $35.34
|
|
MB = $37.11
|
Most Recent Note - 7/12/2021 5:18:47 PM
Y - Color code is changed to yellow after posting gains with light volume yet finding prompt support near its 50 DMA line ($34.53). More damaging losses would raise greater concerns and trigger a technical sell signal.
>>> FEATURED STOCK ARTICLE : Loss With Light Volume Undercut 50-Day Moving Average - 7/8/2021 |
View all notes |
Set NEW NOTE alert |
Company Profile |
SEC
News |
Chart |
Request a new note
C
A
S
I |
ASML
-
NASDAQ
A S M L Holding N.V. NY
ELECTRONICS - Semiconductor Equipment and Mate
|
$706.42
|
-1.39
-0.20% |
$710.66
|
618,258
81.78% of 50 DAV
50 DAV is 756,000
|
$710.97
-0.64%
|
5/25/2021
|
$669.59
|
PP = $675.75
|
|
MB = $709.54
|
Most Recent Note - 7/8/2021 12:17:48 PM
Y - Recently encountering distributional pressure, testing the prior high ($675) and its 50 DMA line ($668) which define important near-term support. More damaging losses would raise concerns and trigger technical sell signals.
>>> FEATURED STOCK ARTICLE : Volume Higher While Pulling Back Toward 50-Day Moving Average - 7/1/2021 |
View all notes |
Set NEW NOTE alert |
Company Profile |
SEC
News |
Chart |
Request a new note
C
A
S
I |
MED
-
NYSE
Medifast Inc
SPECIALTY RETAIL - Specialty Retail, Other
|
$276.57
|
-6.87
-2.42% |
$285.13
|
97,311
79.11% of 50 DAV
50 DAV is 123,000
|
$336.99
-17.93%
|
5/11/2021
|
$285.72
|
PP = $279.56
|
|
MB = $293.54
|
Most Recent Note - 7/13/2021 5:34:38 PM
G - Recently slumping below its 50 DMA line ($290.47) and undercutting the prior high in the $279 area. More damaging losses below the prior low ($258.77 on 6/17/21) would raise greater concerns and trigger a worrisome technical sell signal.
>>> FEATURED STOCK ARTICLE : Halted 10-Session Losing Streak Near Prior High and 50 DMA - 6/15/2021 |
View all notes |
Set NEW NOTE alert |
Company Profile |
SEC
News |
Chart |
Request a new note
C
A
S
I |
CLFD
-
NASDAQ
Clearfield Inc
TELECOMMUNICATIONS - Cables / Satalite Equipment
|
$36.60
|
-0.68
-1.82% |
$37.25
|
47,123
39.93% of 50 DAV
50 DAV is 118,000
|
$43.64
-16.13%
|
6/4/2021
|
$40.01
|
PP = $40.36
|
|
MB = $42.38
|
Most Recent Note - 7/9/2021 5:18:30 PM
G - Posted a gain today with lighter than average volume yet closed above its 50 DMA line ($37.10) helping its outlook improve. Faces some resistance due to overhead supply up to the $43 level. Fundamentals remain strong.
>>> FEATURED STOCK ARTICLE : Consolidating Above 50-Day Moving Average Helped Outlook - 6/30/2021 |
View all notes |
Set NEW NOTE alert |
Company Profile |
SEC
News |
Chart |
Request a new note
C
A
S
I |
POOL
-
NASDAQ
Pool Corp
WHOLESALE - Basic Materials Wholesale
|
$470.88
|
-4.63
-0.97% |
$477.05
|
232,168
92.87% of 50 DAV
50 DAV is 250,000
|
$478.67
-1.63%
|
6/21/2021
|
$455.09
|
PP = $449.54
|
|
MB = $472.02
|
Most Recent Note - 7/12/2021 5:22:57 PM
G - Perched at its 52-week high and its color code is changed to green after getting extended from the latest base. Prior highs in the $449-444 range define initial support to watch above its 50 DMA line ($442) on pullbacks.
>>> FEATURED STOCK ARTICLE : Volume-Driven Breakout After Orderly Consolidation - 6/21/2021 |
View all notes |
Set NEW NOTE alert |
Company Profile |
SEC
News |
Chart |
Request a new note
C
A
S
I |
Symbol/Exchange
Company Name
Industry Group |
PRICE |
CHANGE
(%Change) |
Day High |
Volume
(% DAV)
(% 50 day avg vol) |
52 Wk Hi
% From Hi |
Featured
Date |
Price
Featured |
Pivot Featured |
|
Max Buy |
FSBW
-
NASDAQ
F S Bancorp
Banks-West/Southwest
|
$69.55
|
-2.05
-2.86% |
$71.24
|
17,012
113.41% of 50 DAV
50 DAV is 15,000
|
$73.62
-5.53%
|
5/18/2021
|
$70.16
|
PP = $73.72
|
|
MB = $77.41
|
Most Recent Note - 7/12/2021 12:47:52 PM
Y - Still perched within striking distance of the pivot point cited based on its 3/08/21 high plus 10 cents. Near its 50 DMA line ($70.14) it has found prompt support during its ongoing ascent. Subsequent gains above the pivot point backed by at least +40% above average volume are needed to trigger a technical buy signal.
>>> FEATURED STOCK ARTICLE : Still Consolidating With Close Striking Distance of All-Time High - 6/24/2021 |
View all notes |
Set NEW NOTE alert |
Company Profile |
SEC
News |
Chart |
Request a new note
C
A
S
I |
SMPL
-
NASDAQ
Simply Good Foods Co
Food-Confectionery
|
$36.79
|
-0.42
-1.13% |
$37.40
|
338,631
60.80% of 50 DAV
50 DAV is 557,000
|
$38.50
-4.44%
|
12/28/2020
|
$30.40
|
PP = $31.44
|
|
MB = $33.01
|
Most Recent Note - 7/7/2021 3:13:40 PM
G - Holding its ground stubbornly with volume totals cooling after hitting a new all-time high on 7/01/21 when last noted. Prior highs in the $35 area define near-term support to watch along with its 50 DMA line ($34.96). Reported May '21 quarterly earnings +65% on +32% sales revenues versus the year ago period, well above the +25% minimum earnings guideline (C criteria).
>>> FEATURED STOCK ARTICLE : Simply Wedging Into New High Territory - 6/14/2021 |
View all notes |
Set NEW NOTE alert |
Company Profile |
SEC
News |
Chart |
Request a new note
C
A
S
I |
SHOP
-
NYSE
Shopify Inc Cl A
Computer Sftwr-Enterprse
|
$1,516.47
|
+21.73
1.45% |
$1,532.27
|
1,184,332
82.07% of 50 DAV
50 DAV is 1,443,000
|
$1,587.74
-4.49%
|
7/2/2021
|
$1,468.00
|
PP = $1,552.23
|
|
MB = $1,629.84
|
Most Recent Note - 7/7/2021 1:04:06 PM
Y - Reversed into the red today after hitting a new high. A new pivot point was recently cited based on its 6/21/21 high while building on a cup-with-high-handle base. Confirming gains with at least +40% above average volume for new highs would trigger a new (or add-on) technical buy signal and be a reassuring sign of fresh institutional buying demand.
>>> FEATURED STOCK ARTICLE : Rebounding After Choppy 4-Month Consolidation - 6/16/2021 |
View all notes |
Set NEW NOTE alert |
Company Profile |
SEC
News |
Chart |
Request a new note
C
A
S
I |
YETI
-
NYSE
Yeti Holdings Inc
Leisure-Products
|
$92.32
|
-0.77
-0.83% |
$93.15
|
443,678
30.04% of 50 DAV
50 DAV is 1,477,000
|
$95.76
-3.59%
|
5/13/2021
|
$84.20
|
PP = $90.65
|
|
MB = $95.18
|
Most Recent Note - 7/9/2021 5:15:00 PM
Y - Volume totals still have been cooling while consolidating near its 52-week high. The 50 DMA line ($89.10) and prior low ($85.08 on 6/18/21) define near-term support to watch on pullbacks. Fundamentals remain strong. See the latest FSU analysis for more details and a new annotated graph.
>>> FEATURED STOCK ARTICLE : Volume Totals Cooling While Consolidating Near High - 7/9/2021 |
View all notes |
Set NEW NOTE alert |
Company Profile |
SEC
News |
Chart |
Request a new note
C
A
S
I |
DOCU
-
NASDAQ
Docusign Inc
Computer Sftwr-Enterprse
|
$283.68
|
-4.42
-1.53% |
$288.55
|
1,489,142
47.27% of 50 DAV
50 DAV is 3,150,000
|
$298.75
-5.04%
|
7/6/2021
|
$288.96
|
PP = $290.33
|
|
MB = $304.85
|
Most Recent Note - 7/13/2021 5:28:58 PM
Y - Pulled back today with lighter volume after wedging into new high territory with gains in recent weeks lacking great volume conviction. Highlighted in yellow with pivot point cited based on its 9/02/20 high plus 10 cents. A gain and strong close above the pivot point cited backed by at least +40% above average volume may trigger a convincing new (or add-on) technical buy signal. Fundamentals remain strong after reporting very strong Apr '21 quarterly results.
>>> FEATURED STOCK ARTICLE : Touched New High With Average Volume Behind Today's Gain - 7/6/2021 |
View all notes |
Set NEW NOTE alert |
Company Profile |
SEC
News |
Chart |
Request a new note
C
A
S
I |
Symbol/Exchange
Company Name
Industry Group |
PRICE |
CHANGE
(%Change) |
Day High |
Volume
(% DAV)
(% 50 day avg vol) |
52 Wk Hi
% From Hi |
Featured
Date |
Price
Featured |
Pivot Featured |
|
Max Buy |
JEF
-
NYSE
Jefferies Financial Grp
Finance-Invest Bnk/Bkrs
|
$31.92
|
-0.44
-1.36% |
$32.35
|
1,659,204
79.69% of 50 DAV
50 DAV is 2,082,000
|
$34.98
-8.75%
|
6/28/2021
|
$31.81
|
PP = $34.42
|
|
MB = $36.14
|
Most Recent Note - 7/8/2021 5:23:27 PM
G - Color code is changed to green after a gap down today and 6th consecutive loss violated its 50 DMA line ($32.09) triggering a technical sell signal. Only a prompt rebound above the 50 DMA line would help its outlook improve. Subsequent gains above the pivot point backed by at least +40% above average volume are necessary to trigger a technical buy signal.
>>> FEATURED STOCK ARTICLE : High-Ranked Financial Firm Formed "Double Bottom" Base - 6/28/2021 |
View all notes |
Set NEW NOTE alert |
Company Profile |
SEC
News |
Chart |
Request a new note
C
A
S
I |
CLAR
-
NASDAQ
Clarus Corporation
Leisure-Products
|
$27.54
|
-0.43
-1.54% |
$28.21
|
123,025
55.42% of 50 DAV
50 DAV is 222,000
|
$28.00
-1.64%
|
5/12/2021
|
$21.40
|
PP = $19.73
|
|
MB = $20.72
|
Most Recent Note - 7/12/2021 5:20:49 PM
G - Posted a big gain with below average volume and hit a new 52-week high today. It did not form a sound base of sufficient length. Its 50 DMA line ($23.46) defines important near-term support to watch.
>>> FEATURED STOCK ARTICLE : Encountering Distributional Pressure After Recent Rally - 6/17/2021 |
View all notes |
Set NEW NOTE alert |
Company Profile |
SEC
News |
Chart |
Request a new note
C
A
S
I |
AVTR
-
NYSE
Avantor Inc
Medical-Research Eqp/Svc
|
$36.03
|
-0.19
-0.52% |
$36.35
|
2,467,101
61.63% of 50 DAV
50 DAV is 4,003,000
|
$36.50
-1.29%
|
6/10/2021
|
$32.94
|
PP = $34.09
|
|
MB = $35.79
|
Most Recent Note - 7/12/2021 5:17:21 PM
G - Inched to a new high today. Stubbornly held its ground and made gradual progress since triggering a technical buy signal. Prior highs in the $33 area define initial support to watch on pullbacks.
>>> FEATURED STOCK ARTICLE : Medical Research Firm Challenging Prior High - 6/10/2021 |
View all notes |
Set NEW NOTE alert |
Company Profile |
SEC
News |
Chart |
Request a new note
C
A
S
I |
|
|
|
THESE ARE NOT BUY RECOMMENDATIONS!
Comments contained in the body of this report are technical
opinions only. The material herein has been obtained
from sources believed to be reliable and accurate, however,
its accuracy and completeness cannot be guaranteed.
This site is not an investment advisor, hence it does
not endorse or recommend any securities or other investments.
Any recommendation contained in this report may not
be suitable for all investors and it is not to be deemed
an offer or solicitation on our part with respect to
the purchase or sale of any securities. All trademarks,
service marks and trade names appearing in this report
are the property of their respective owners, and are
likewise used for identification purposes only.
This report is a service available
only to active Paid Premium Members.
You may opt-out of receiving report notifications
at any time. Questions or comments may be submitted
by writing to Premium Membership Services 665 S.E. 10 Street, Suite 201 Deerfield Beach, FL 33441-5634 or by calling 1-800-965-8307
or 954-785-1121.
|
|
|