You are not logged in.
This means you
CAN ONLY VIEW reports that were published prior to Thursday, March 20, 2025.
You
MUST UPGRADE YOUR MEMBERSHIP if you want to see any current reports.
AFTER MARKET UPDATE - THURSDAY, JULY 29TH, 2021
Previous After Market Report Next After Market Report >>>
|
|
|
|
DOW |
+153.60 |
35,084.53 |
+0.44% |
|
Volume |
817,365,518 |
-7% |
|
Volume |
3,881,304,200 |
-8% |
|
NASDAQ |
+15.67 |
14,778.26 |
+0.11% |
|
Advancers |
2,242 |
69% |
|
Advancers |
2,345 |
54% |
|
S&P 500 |
+18.51 |
4,419.15 |
+0.42% |
|
Decliners |
1,011 |
31% |
|
Decliners |
1,995 |
46% |
|
Russell 2000 |
+15.07 |
2,240.03 |
+0.68% |
|
52 Wk Highs |
207 |
|
|
52 Wk Highs |
165 |
|
|
S&P 600 |
+15.24 |
1,344.64 |
+1.15% |
|
52 Wk Lows |
24 |
|
|
52 Wk Lows |
57 |
|
|
 |
Major Indices Rose With Lighter Volume Totals
Kenneth J. Gruneisen - Passed the CAN SLIM® Master's Exam
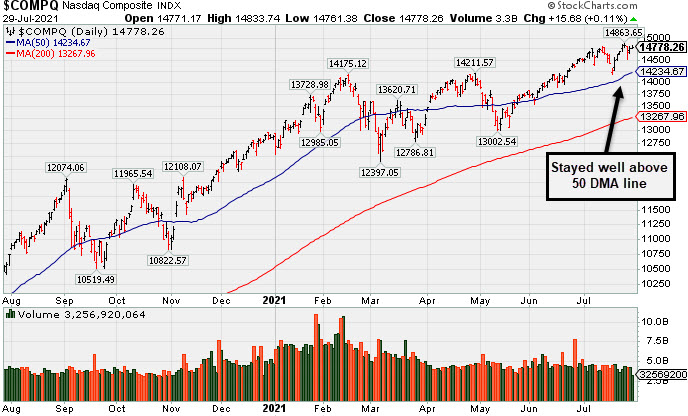
The Dow and S&P 500 each closed within striking distance of their record closing levels reached on Monday, rising 153 points and 0.4%, respectively. The Nasdaq Composite gained 0.1%. The volume totals reported were lighter than the prior session on the NYSE and on the Nasdaq exchange. Breadth was positive as advancers led decliners by more than a 2-1 margin on the NYSE but advancers led decliners by only a 6-5 margin on the Nasdaq exchange. There were 70 high-ranked companies from the Leaders List that hit new 52-week highs and were listed on the BreakOuts Page versus 29 on the prior session. New 52-week highs totals expanded and outnumbered new 52-week lows on the NYSE and on the Nasdaq exchange. The major indices (M criteria) are in an uptrend that has come under pressure. Investors are reminded to always make buying and selling decisions on case-by-case basis under the strict criteria and rules of the fact-based investment system.
PICTURED: The S&P 500 Index is perched near its new record high.
U.S. stocks finished higher on Thursday as investors digested corporate earnings results and economic data releases. Updates out of Washington were also in focus, after a roughly $1 trillion bipartisan infrastructure package secured enough votes in the Senate to clear a crucial procedural hurdle Wednesday night.
On the data front, the first reading of second quarter GDP revealed the U.S. economy expanded at a 6.5% annualized rate in the April thru June period, disappointing consensus estimates of 8.4% but gaining momentum from first quarter's 6.3% annualized clip. The underlying components of the release showed robust consumer spending fueled economic output to pre-pandemic levels. Separately, weekly initial jobless claims came in at 400,000, above expectations of 385,000 but lower than the prior 424,000 figure. Treasuries weakened, with the yield on the 10-year note up four basis points to 1.27%. In commodities, COMEX gold rose 1.6% to $1828.50/ounce amid a weaker dollar.
Nine of 11 S&P 500 sectors closed in positive territory with the Communication Services and Real Estate groups the lone laggards. Energy stocks paced the gains, with WTI crude adding 1.7% to $73.61/barrel. In earnings, Facebook (FB -4.01%) fell as warnings of slowing growth weighed on its quarterly figures, which exceeded Wall Street’s projections. Qualcomm (QCOM +6.00%) rose after providing upbeat forecasts amid increasing demand for 5G smartphones. Ford (F +3.68%) jumped after posting a profit in the second quarter and lifting its full-year outlook.
|
 Kenneth J. Gruneisen started out as a licensed stockbroker in August 1987, a couple of months prior to the historic stock market crash that took the Dow Jones Industrial Average down -22.6% in a single day. He has published daily fact-based fundamental and technical analysis on high-ranked stocks online for two decades. Through FACTBASEDINVESTING.COM, Kenneth provides educational articles, news, market commentary, and other information regarding proven investment systems that work in good times and bad.
Comments contained in the body of this report are technical opinions only and are not necessarily those of Gruneisen Growth Corp. The material herein has been obtained from sources believed to be reliable and accurate, however, its accuracy and completeness cannot be guaranteed. Our firm, employees, and customers may effect transactions, including transactions contrary to any recommendation herein, or have positions in the securities mentioned herein or options with respect thereto. Any recommendation contained in this report may not be suitable for all investors and it is not to be deemed an offer or solicitation on our part with respect to the purchase or sale of any securities. |
|
 |
Financial, Tech, and Commodity-Linked Groups Rose
Kenneth J. Gruneisen - Passed the CAN SLIM® Master's Exam
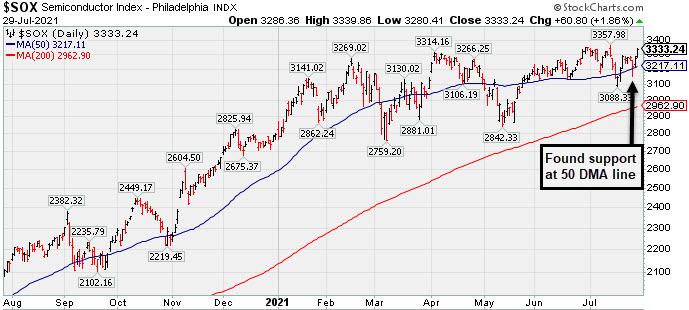
The Broker/Dealer Index ($XBD +1.15%) and Bank Index ($BKX +1.09%) both posted gains but the Retail Index ($RLX -0.16%) ended slightly lower on Friday. The Semiconductor Index ($SOX +1.86%) and Networking Index ($NWX +1.87%) both posted solid gains but the Biotech Index ($BTK -0.54%) edged lower. The Gold & Silver Index ($XAU +2.76%) posted a standout gain while the Oil Services Index ($OSX +0.96%) and Integrated Oil Index ($XOI +0.60%) both posted smaller gains.
PICTURED: The Semiconductor Index ($SOX +1.86%) found support at its 50-day moving average (DMA) line and rebounded near the 2021 record high.
| Oil Services |
$OSX |
56.94 |
+0.54 |
+0.96% |
+28.45% |
| Integrated Oil |
$XOI |
1,034.78 |
+6.17 |
+0.60% |
+30.57% |
| Semiconductor |
$SOX |
3,333.18 |
+60.74 |
+1.86% |
+19.23% |
| Networking |
$NWX |
866.68 |
+15.89 |
+1.87% |
+20.86% |
| Broker/Dealer |
$XBD |
466.89 |
+5.32 |
+1.15% |
+23.65% |
| Retail |
$RLX |
4,139.60 |
-6.64 |
-0.16% |
+16.17% |
| Gold & Silver |
$XAU |
144.35 |
+3.88 |
+2.76% |
+0.11% |
| Bank |
$BKX |
123.68 |
+1.33 |
+1.09% |
+26.32% |
| Biotech |
$BTK |
5,759.28 |
-31.54 |
-0.54% |
+0.35% |
|
|
|
 |
Latest Earnings Report Broke Streak of Strong Increases
Kenneth J. Gruneisen - Passed the CAN SLIM® Master's Exam
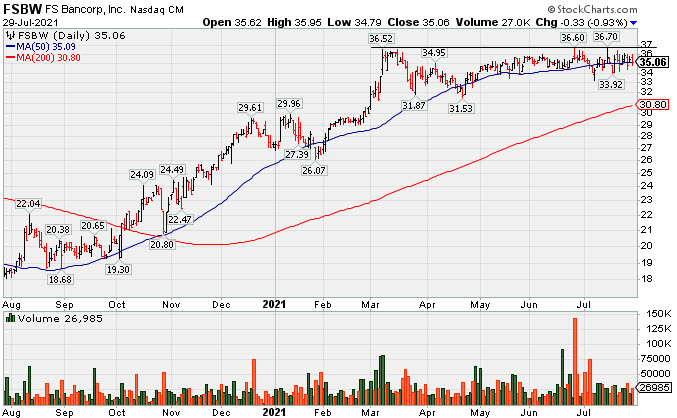
F S Bancorp (FSBW -$0.33 or -0.93% to $35.06) is still consolidating near its 50-day moving average (DMA) line ($35.21). It recently reported Jun '21 quarterly earnings -16% on -11% sales revenues versus the year ago period raising fundamental concerns. That broke a streak of 4 consecutive strong quarterly comparisons above the +25% minimum earnings guideline (C criteria). Its Earnings Per Share Rating fell from 97 to 81 since last shown in this FSU section on 6/24/21 with an annotated graph under the headline "Still Consolidating With Close Striking Distance of All-Time High".
Do not be confused by a 2:1 stock split which impacted share prices as of 7/15/21 (Featured Price, Pivot Point, and Max Buy levels were updated accordingly). This thinly-traded Bank was highlighted in yellow with pivot point cited based on its 3/08/21 high plus 10 cents in the 5/18/21 mid-day report (read here).
Its annual earnings (A criteria) history has been great. It completed a new Public Offering on 9/08/17. The number of top-rated funds owning its shares rose from 168 in Jun '20 to 187 in Mar '21, a reassuring sign concerning the I criteria. Its small supply of only 8.5 million shares outstanding can contribute to greater price volatility in the event of institutional buying or selling. It has a Timeliness Rating of C and Sponsorship Rating of B.
|
|
|
Color Codes Explained :
Y - Better candidates highlighted by our
staff of experts.
G - Previously featured
in past reports as yellow but may no longer be buyable under the
guidelines.
***Last / Change / Volume data in this table is the closing quote data***
Symbol/Exchange
Company Name
Industry Group |
PRICE |
CHANGE
(%Change) |
Day High |
Volume
(% DAV)
(% 50 day avg vol) |
52 Wk Hi
% From Hi |
Featured
Date |
Price
Featured |
Pivot Featured |
|
Max Buy |
 SIVB
-
NASDAQ
SIVB
-
NASDAQ
S V B Financial Group
BANKING - Regional - Pacific Banks
|
$566.71
|
+5.01
0.89% |
$571.01
|
251,372
67.76% of 50 DAV
50 DAV is 371,000
|
$608.84
-6.92%
|
4/23/2021
|
$579.70
|
PP = $577.16
|
|
MB = $606.02
|
Most Recent Note - 7/27/2021 1:27:23 PM
G - Reported Jun '21 quarterly earnings +106% on +69% sales revenues versus the year ago period, continuing its strong earnings track record. Remains below its 50 DMA line ($568). A rebound above the 50 DMA line is needed for its outlook to improve.
>>> FEATURED STOCK ARTICLE : Consolidating Near 50-Day Average After Distributional Pressure - 6/25/2021 |
View all notes |
Set NEW NOTE alert |
Company Profile |
SEC
News |
Chart |
Request a new note
C
A
S
I |
LOGI
-
NASDAQ
Logitech Intl Sa
COMPUTER HARDWARE - Computer Peripherals
|
$108.25
|
+0.20
0.19% |
$109.60
|
1,393,773
165.53% of 50 DAV
50 DAV is 842,000
|
$140.17
-22.77%
|
5/26/2021
|
$119.13
|
PP = $120.34
|
|
MB = $126.36
|
Most Recent Note - 7/27/2021 9:55:38 AM
G - Gapped down today after reporting Jun '21 quarterly earnings +91% on +66% sales revenues versus the year ago period. Volume and volatility often increase near earnings news. Met noted resistance when rebounding near its 50 DMA line. Its 200 DMA line ($105) defines the next important chart support.
>>> FEATURED STOCK ARTICLE : Recent Pullback is Testing Important Technical Support - 7/2/2021 |
View all notes |
Set NEW NOTE alert |
Company Profile |
SEC
News |
Chart |
Request a new note
C
A
S
I |
CROX
-
NASDAQ
Crocs Inc
CONSUMER NON-DURABLES - Textile - Apparel Footwear
|
$136.05
|
+4.80
3.66% |
$137.65
|
1,716,009
114.02% of 50 DAV
50 DAV is 1,505,000
|
$136.50
-0.33%
|
6/14/2021
|
$112.64
|
PP = $110.01
|
|
MB = $115.51
|
 Most Recent Note - 7/29/2021 5:27:51 PM
G - Powered into new all-time high territory with a solid gain today, getting more extended from any sound base. Found support at its 50 DMA line ($112).
>>> FEATURED STOCK ARTICLE : Quietly Consolidating Below "Max Buy" Level - 7/7/2021 |
View all notes |
Set NEW NOTE alert |
Company Profile |
SEC
News |
Chart |
Request a new note
C
A
S
I |
CRL
-
NYSE
Charles River Labs Intl
DRUGS - Biotechnology
|
$405.52
|
+5.90
1.48% |
$407.66
|
225,458
53.81% of 50 DAV
50 DAV is 419,000
|
$401.90
0.90%
|
6/9/2021
|
$345.91
|
PP = $349.23
|
|
MB = $366.69
|
Most Recent Note - 7/26/2021 5:08:10 PM
G - Recent volume totals have been below average while wedging into record high territory. Its 50 DMA line ($358) and prior high in the $349 area define near-term support to watch on pullbacks. Two of the past 3 quarterly comparisons through Mar '21 have been above the +25% minimum earnings guideline (C criteria).
>>> FEATURED STOCK ARTICLE : Volume Totals Cooling While Perched at High - 7/13/2021 |
View all notes |
Set NEW NOTE alert |
Company Profile |
SEC
News |
Chart |
Request a new note
C
A
S
I |
GNRC
-
NYSE
Generac Hldgs Inc
Electrical-Power/Equipmt
|
$419.30
|
-11.74
-2.72% |
$436.98
|
1,509,677
190.14% of 50 DAV
50 DAV is 794,000
|
$457.00
-8.25%
|
6/8/2021
|
$348.46
|
PP = $342.38
|
|
MB = $359.50
|
Most Recent Note - 7/28/2021 12:46:27 PM
G - Extended from any sound base, it abruptly pulled back from its all-time high and its earlier low tested support at its 50 DMA line ($383) before rebounding impressively. Reported Jun '21 quarterly earnings +71% on +68% sales revenues versus the year ago period. Volume and volatility often increase near earnings news. Fundamentals remain strong.
>>> FEATURED STOCK ARTICLE : Gain for New High Leaves GNRC Very Extended From Prior Base - 7/12/2021 |
View all notes |
Set NEW NOTE alert |
Company Profile |
SEC
News |
Chart |
Request a new note
C
A
S
I |
Symbol/Exchange
Company Name
Industry Group |
PRICE |
CHANGE
(%Change) |
Day High |
Volume
(% DAV)
(% 50 day avg vol) |
52 Wk Hi
% From Hi |
Featured
Date |
Price
Featured |
Pivot Featured |
|
Max Buy |
CAMT
-
NASDAQ
Camtek Ltd
ELECTRONICS - Scientific and Technical Instrum
|
$37.38
|
+2.13
6.04% |
$37.46
|
227,804
88.64% of 50 DAV
50 DAV is 257,000
|
$40.47
-7.64%
|
4/28/2021
|
$35.03
|
PP = $35.34
|
|
MB = $37.11
|
Most Recent Note - 7/29/2021 5:24:02 PM
Y - Color code is changed to yellow after it posted a solid gain today with below average volume, rebounding well above the 50 DMA line ($35.87) helping its outlook improve. Due to report Jun '21 quarterly results on 8/04/21.
>>> FEATURED STOCK ARTICLE : Loss With Light Volume Undercut 50-Day Moving Average - 7/8/2021 |
View all notes |
Set NEW NOTE alert |
Company Profile |
SEC
News |
Chart |
Request a new note
C
A
S
I |
PKI
-
NYSE
Perkinelmer Inc
ELECTRONICS - Scientific and Technical Instrum
|
$179.30
|
+4.84
2.77% |
$180.20
|
1,231,313
167.07% of 50 DAV
50 DAV is 737,000
|
$175.28
2.29%
|
7/26/2021
|
$168.06
|
PP = $162.80
|
|
MB = $170.94
|
Most Recent Note - 7/29/2021 12:48:04 PM
G - Rallied above its "max buy" level hitting another new all-time high today and its color code is changed to green. Bullish action came after it reported earnings +80% on +51% sales revenues for the Jun '21 quarter versus the year ago period. Prior high ($162) defines initial support to watch on pullbacks.
>>> FEATURED STOCK ARTICLE : Powerful Volume-Driven Breakout After Earnings Report - 7/26/2021 |
View all notes |
Set NEW NOTE alert |
Company Profile |
SEC
News |
Chart |
Request a new note
C
A
S
I |
ASML
-
NASDAQ
A S M L Holding N.V. NY
ELECTRONICS - Semiconductor Equipment and Mate
|
$765.71
|
+5.85
0.77% |
$767.89
|
631,432
86.74% of 50 DAV
50 DAV is 728,000
|
$761.04
0.61%
|
5/25/2021
|
$669.59
|
PP = $675.75
|
|
MB = $709.54
|
Most Recent Note - 7/27/2021 12:07:37 PM
G - Retreating today, it rallied well above its "max buy" level and hit new all-time highs with 5 consecutive volume-driven gains. Its 50 DMA line ($687) defines important near-term support to watch on pullbacks.
>>> FEATURED STOCK ARTICLE : Volume Higher While Pulling Back Toward 50-Day Moving Average - 7/1/2021 |
View all notes |
Set NEW NOTE alert |
Company Profile |
SEC
News |
Chart |
Request a new note
C
A
S
I |
LUNA
-
NASDAQ
Luna Innovations Inc
Medical-Research Eqp/Svc
|
$12.26
|
+0.04
0.33% |
$12.48
|
115,280
68.62% of 50 DAV
50 DAV is 168,000
|
$13.05
-6.05%
|
7/26/2021
|
$12.46
|
PP = $13.15
|
|
MB = $13.81
|
Most Recent Note - 7/28/2021 5:28:15 PM
Y - Posted another volume-driven gain today, adding to a spurt of gains marked by volume. Highlighted in yellow in the 7/26/21 mid-day report with pivot point cited based on its 3/12/21 high plus 10 cents. Rallied impressively from support at its 200 DMA line, nearly challenging its 52-week high. Subsequent gains above the pivot point backed by at least +40% above average volume may trigger a technical buy signal. Reported Mar '21 quarterly earnings +50% on +53% sales revenues versus the year ago period, its 4th strong quarterly comparison (C criteria). Annual earnings (A criteria) history has improved in recent years, helping it match with the fundamental guidelines of the fact-based investment system. See the latest FSU analysis for more details and an annotated graph.
>>> FEATURED STOCK ARTICLE : Pulled Back After Streak of Gains Challenging 52-Week High - 7/27/2021 |
View all notes |
Set NEW NOTE alert |
Company Profile |
SEC
News |
Chart |
Request a new note
C
A
S
I |
CLFD
-
NASDAQ
Clearfield Inc
TELECOMMUNICATIONS - Cables / Satalite Equipment
|
$44.17
|
+1.82
4.30% |
$45.25
|
194,079
154.03% of 50 DAV
50 DAV is 126,000
|
$45.36
-2.62%
|
7/23/2021
|
$40.23
|
PP = $43.74
|
|
MB = $45.93
|
Most Recent Note - 7/29/2021 5:25:46 PM
Y - Posted a solid gain today with +53% above average volume for a best ever close. The big gain and close above the pivot point with volume triggered a new (or add-on) technical buy signal. Fundamentals remain strong. Bullish action came after it reported Jun '21 quarterly earnings +100% on +49% sales revenues."
>>> FEATURED STOCK ARTICLE : Big Volume-Driven Gain Challenging Prior High After Earnings - 7/23/2021 |
View all notes |
Set NEW NOTE alert |
Company Profile |
SEC
News |
Chart |
Request a new note
C
A
S
I |
Symbol/Exchange
Company Name
Industry Group |
PRICE |
CHANGE
(%Change) |
Day High |
Volume
(% DAV)
(% 50 day avg vol) |
52 Wk Hi
% From Hi |
Featured
Date |
Price
Featured |
Pivot Featured |
|
Max Buy |
POOL
-
NASDAQ
Pool Corp
WHOLESALE - Basic Materials Wholesale
|
$477.80
|
+10.17
2.17% |
$478.57
|
176,023
65.61% of 50 DAV
50 DAV is 268,300
|
$478.67
-0.18%
|
6/21/2021
|
$455.09
|
PP = $449.54
|
|
MB = $472.02
|
Most Recent Note - 7/29/2021 5:32:33 PM
G - Posted a gain today with light volume for a new all-time high above its "max buy" level and its color code is changed to green. Found support at its 50 DMA line ($450) last week. Reported Jun '21 quarterly earnings +66% on +40% sales revenues versus the year ago period. Recent losses have tested prior highs in the $449-444 range and its 50 DMA line which define important support. More damaging losses would raise concerns and trigger a technical sell signal.
>>> FEATURED STOCK ARTICLE : Churned Heavy Volume While Testing 50-Day Moving Average - 7/22/2021 |
View all notes |
Set NEW NOTE alert |
Company Profile |
SEC
News |
Chart |
Request a new note
C
A
S
I |
FSBW
-
NASDAQ
F S Bancorp
Banks-West/Southwest
|
$35.06
|
-0.33
-0.93% |
$35.95
|
26,985
89.95% of 50 DAV
50 DAV is 30,000
|
$36.85
-4.86%
|
5/18/2021
|
$35.08
|
PP = $36.85
|
|
MB = $38.69
|
Most Recent Note - 7/29/2021 5:33:05 PM
G - Color code is changed to green while consolidating near its 50 DMA line ($35.21). Recently reported Jun '21 quarterly earnings -16% on -11% sales revenues versus the year ago period raising fundamental concerns. Do not be confused by a 2:1 stock split which impacted share prices as of 7/15/21 (Featured Price, Pivot Point, and Max Buy levels were updated accordingly). See the latest FSU analysis for more details and a new annotated graph.
>>> FEATURED STOCK ARTICLE : Latest Earnings Report Broke Streak of Strong Increases - 7/29/2021 |
View all notes |
Set NEW NOTE alert |
Company Profile |
SEC
News |
Chart |
Request a new note
C
A
S
I |
SMPL
-
NASDAQ
Simply Good Foods Co
Food-Confectionery
|
$37.35
|
+0.04
0.11% |
$37.73
|
276,661
54.89% of 50 DAV
50 DAV is 504,000
|
$38.50
-2.99%
|
12/28/2020
|
$30.40
|
PP = $31.44
|
|
MB = $33.01
|
Most Recent Note - 7/27/2021 1:28:28 PM
G - Still holding its ground near its all-time high with volume totals cooling. Its 50 DMA line ($35.77) and prior highs in the $35 area define important near-term support to watch on pullbacks. Reported May '21 quarterly earnings +65% on +32% sales revenues versus the year ago period, well above the +25% minimum earnings guideline (C criteria).
>>> FEATURED STOCK ARTICLE : Pulled Back from High With Small Losses on Light Volume - 7/15/2021 |
View all notes |
Set NEW NOTE alert |
Company Profile |
SEC
News |
Chart |
Request a new note
C
A
S
I |
PYPL
-
NASDAQ
Paypal Holdings Inc
Finance-CrdtCard/PmtPr
|
$283.17
|
-18.81
-6.23% |
$289.00
|
18,088,480
311.28% of 50 DAV
50 DAV is 5,811,000
|
$310.16
-8.70%
|
7/27/2021
|
$296.69
|
PP = $307.82
|
|
MB = $323.21
|
Most Recent Note - 7/29/2021 12:57:42 PM
G - Color code is changed to green following a gap down today after it reported Jun '21 quarterly earnings +7% on +19% sales revenues versus the year ago period, below the +25% minimum earnings guideline (C criteria), raising fundamental concerns. Volume and volatility often increase near earnings news. It was highlighted in yellow in the 7/27/21 mid-day report with new pivot point cited based on its 7/13/21 high after a cup-with-handle base while noted - "Subsequent gains above its pivot point backed by at least +40% above average volume may trigger a new buy signal. Reported Mar '21 quarterly earnings +85% on +31% sales revenues versus the year ago period, its 4th strong comparison above the +25% minimum guideline (C criteria). Annual earnings (A criteria) growth has been strong and steady."
>>> FEATURED STOCK ARTICLE : Paypal Perched at Record High - 7/28/2021 |
View all notes |
Set NEW NOTE alert |
Company Profile |
SEC
News |
Chart |
Request a new note
C
A
S
I |
SHOP
-
NYSE
Shopify Inc Cl A
Computer Sftwr-Enterprse
|
$1,525.00
|
-13.00
-0.85% |
$1,560.22
|
1,740,555
121.21% of 50 DAV
50 DAV is 1,436,000
|
$1,650.00
-7.58%
|
7/2/2021
|
$1,468.00
|
PP = $1,552.23
|
|
MB = $1,629.84
|
Most Recent Note - 7/28/2021 12:57:31 PM
Y - Color code was changed to yellow after pulling back below its "max buy" level. Its recent low and 50 DMA line ($1391) define near term support to watch. Reported Jun '21 quarterly earnings +113% on +57% sales revenues versus the year ago period.
>>> FEATURED STOCK ARTICLE : Managed a Positive Reversal After Early Weakness - 7/19/2021 |
View all notes |
Set NEW NOTE alert |
Company Profile |
SEC
News |
Chart |
Request a new note
C
A
S
I |
Symbol/Exchange
Company Name
Industry Group |
PRICE |
CHANGE
(%Change) |
Day High |
Volume
(% DAV)
(% 50 day avg vol) |
52 Wk Hi
% From Hi |
Featured
Date |
Price
Featured |
Pivot Featured |
|
Max Buy |
YETI
-
NYSE
Yeti Holdings Inc
Leisure-Products
|
$96.77
|
+0.29
0.30% |
$98.93
|
810,175
66.08% of 50 DAV
50 DAV is 1,226,000
|
$98.79
-2.04%
|
5/13/2021
|
$84.20
|
PP = $90.65
|
|
MB = $95.18
|
Most Recent Note - 7/27/2021 4:08:24 PM
G - Holding its ground above its "max buy" level with volume totals cooling. Its 50 DMA line ($90.44) and recent low define important near-term support where more damaging losses would raise greater concerns. Fundamentals remain strong.
>>> FEATURED STOCK ARTICLE : Volume Totals Cooling While Consolidating Near High - 7/9/2021 |
View all notes |
Set NEW NOTE alert |
Company Profile |
SEC
News |
Chart |
Request a new note
C
A
S
I |
DOCU
-
NASDAQ
Docusign Inc
Computer Sftwr-Enterprse
|
$301.18
|
-3.64
-1.19% |
$308.49
|
1,473,486
49.63% of 50 DAV
50 DAV is 2,969,000
|
$310.51
-3.00%
|
7/6/2021
|
$288.96
|
PP = $290.33
|
|
MB = $304.85
|
Most Recent Note - 7/27/2021 1:21:37 PM
Y - Quietly pulling back from its all-time high after wedging into new high territory with recent gains lacking great volume conviction. Prior low ($270.41 on 7/15/21) defines initial support above its 50 DMA line.
>>> FEATURED STOCK ARTICLE : Touched New High With Average Volume Behind Today's Gain - 7/6/2021 |
View all notes |
Set NEW NOTE alert |
Company Profile |
SEC
News |
Chart |
Request a new note
C
A
S
I |
XPEL
-
NASDAQ
Xpel Inc
Auto/Truck-Tires andamp; Misc
|
$91.98
|
+4.37
4.99% |
$92.76
|
244,926
108.37% of 50 DAV
50 DAV is 226,000
|
$103.84
-11.42%
|
7/21/2021
|
$92.25
|
PP = $94.31
|
|
MB = $99.03
|
Most Recent Note - 7/29/2021 5:30:41 PM
G - Posted a gain today with average volume after bouncing at its 50 DMA line ($86.28) and finding prompt support. Raised concerns this week as it fell back into the previously noted base. Reported Mar '21 quarterly earnings +317% on +83% sales revenues versus the year ago period, adding to its strong earnings track record.
>>> FEATURED STOCK ARTICLE : New Base Formed May Be "Late Stage" - 7/21/2021 |
View all notes |
Set NEW NOTE alert |
Company Profile |
SEC
News |
Chart |
Request a new note
C
A
S
I |
JEF
-
NYSE
Jefferies Financial Grp
Finance-Invest Bnk/Bkrs
|
$33.48
|
+0.53
1.61% |
$33.70
|
862,950
41.25% of 50 DAV
50 DAV is 2,092,000
|
$35.69
-6.19%
|
6/28/2021
|
$31.81
|
PP = $34.42
|
|
MB = $36.14
|
Most Recent Note - 7/26/2021 5:09:22 PM
Y - Found support when recently testing its 50 DMA line ($32.13). More damaging losses would raise concerns and trigger a technical sell signal. As previously noted - "Subsequent gains above the pivot point backed by at least +40% above average volume are necessary to trigger a technical buy signal."
>>> FEATURED STOCK ARTICLE : High-Ranked Financial Firm Formed "Double Bottom" Base - 6/28/2021 |
View all notes |
Set NEW NOTE alert |
Company Profile |
SEC
News |
Chart |
Request a new note
C
A
S
I |
CLAR
-
NASDAQ
Clarus Corporation
Leisure-Products
|
$28.49
|
+0.21
0.74% |
$28.84
|
152,015
68.17% of 50 DAV
50 DAV is 223,000
|
$28.86
-1.28%
|
5/12/2021
|
$21.40
|
PP = $19.73
|
|
MB = $20.72
|
Most Recent Note - 7/27/2021 1:18:01 PM
G - Hovering near its 52-week high with volume totals cooling, extended from any sound base of sufficient length. Its 50 DMA line ($25.24) defines important near-term support to watch.
>>> FEATURED STOCK ARTICLE : Extended From Prior Base and Hitting Another New High - 7/20/2021 |
View all notes |
Set NEW NOTE alert |
Company Profile |
SEC
News |
Chart |
Request a new note
C
A
S
I |
Symbol/Exchange
Company Name
Industry Group |
PRICE |
CHANGE
(%Change) |
Day High |
Volume
(% DAV)
(% 50 day avg vol) |
52 Wk Hi
% From Hi |
Featured
Date |
Price
Featured |
Pivot Featured |
|
Max Buy |
AVTR
-
NYSE
Avantor Inc
Medical-Research Eqp/Svc
|
$37.23
|
-0.25
-0.67% |
$38.04
|
4,210,374
114.01% of 50 DAV
50 DAV is 3,693,000
|
$37.60
-0.98%
|
6/10/2021
|
$32.94
|
PP = $34.09
|
|
MB = $35.79
|
Most Recent Note - 7/27/2021 1:08:20 PM
G - Volume totals have been cooling while stubbornly holding ground near its all-time high. Due to release its financial results for the second quarter 2021 after the market closes on Thursday, July 29, 2021. Volume and volatility often increase near earnings news. Its 50 DMA line coincides with the prior high in the $34 area defining important support to watch on pullbacks.
>>> FEATURED STOCK ARTICLE : Held Ground But Made Little Price Progress Since Featured - 7/14/2021 |
View all notes |
Set NEW NOTE alert |
Company Profile |
SEC
News |
Chart |
Request a new note
C
A
S
I |
|
|
|
THESE ARE NOT BUY RECOMMENDATIONS!
Comments contained in the body of this report are technical
opinions only. The material herein has been obtained
from sources believed to be reliable and accurate, however,
its accuracy and completeness cannot be guaranteed.
This site is not an investment advisor, hence it does
not endorse or recommend any securities or other investments.
Any recommendation contained in this report may not
be suitable for all investors and it is not to be deemed
an offer or solicitation on our part with respect to
the purchase or sale of any securities. All trademarks,
service marks and trade names appearing in this report
are the property of their respective owners, and are
likewise used for identification purposes only.
This report is a service available
only to active Paid Premium Members.
You may opt-out of receiving report notifications
at any time. Questions or comments may be submitted
by writing to Premium Membership Services 665 S.E. 10 Street, Suite 201 Deerfield Beach, FL 33441-5634 or by calling 1-800-965-8307
or 954-785-1121.
|
|
|