***Last / Change / Volume data in this table is the closing quote data***
Symbol/Exchange
Company Name
Industry Group |
PRICE |
CHANGE
(%Change) |
Day High |
Volume
(% DAV)
(% 50 day avg vol) |
52 Wk Hi
% From Hi |
Featured
Date |
Price
Featured |
Pivot Featured |
|
Max Buy |
 SIVB
-
NASDAQ
SIVB
-
NASDAQ
S V B Financial Group
BANKING - Regional - Pacific Banks
|
$589.70
|
+20.41
3.59% |
$590.05
|
365,002
100.55% of 50 DAV
50 DAV is 363,000
|
$608.84
-3.14%
|
8/6/2021
|
$589.70
|
PP = $608.94
|
|
MB = $639.39
|
 Most Recent Note - 8/6/2021 5:32:12 PM
Y - Posted a big gain today with average volume and rebounded further above its 50 DMA line ($566) helping its outlook improve. Color code is changed to yellow with new pivot point cited based on its 6/08/21 high plus 10 cents. Subsequent gains above the pivot point backed by at least +40% above average volume may trigger a new technical buy signal. Reported Jun '21 quarterly earnings +106% on +69% sales revenues versus the year ago period, continuing its strong earnings track record. Prior lows in the $531-529 area define important near-term support to watch.
>>> FEATURED STOCK ARTICLE : Consolidating Near 50-Day Average After Distributional Pressure - 6/25/2021 |
View all notes |
Set NEW NOTE alert |
Company Profile |
SEC
News |
Chart |
Request a new note
C
A
S
I |
CROX
-
NASDAQ
Crocs Inc
CONSUMER NON-DURABLES - Textile - Apparel Footwear
|
$140.81
|
-1.10
-0.78% |
$143.42
|
601,324
39.61% of 50 DAV
50 DAV is 1,518,000
|
$144.26
-2.39%
|
6/14/2021
|
$112.64
|
PP = $110.01
|
|
MB = $115.51
|
Most Recent Note - 8/4/2021 5:14:28 PM
G - Hit another new all-time high with light volume behind today's 3rd consecutive gain, getting more extended from any sound base. Found support at its 50 DMA line ($115.19).
>>> FEATURED STOCK ARTICLE : Quietly Consolidating Below "Max Buy" Level - 7/7/2021 |
View all notes |
Set NEW NOTE alert |
Company Profile |
SEC
News |
Chart |
Request a new note
C
A
S
I |
CRL
-
NYSE
Charles River Labs Intl
DRUGS - Biotechnology
|
$408.41
|
-1.56
-0.38% |
$411.09
|
307,159
76.79% of 50 DAV
50 DAV is 400,000
|
$420.25
-2.82%
|
6/9/2021
|
$345.91
|
PP = $349.23
|
|
MB = $366.69
|
Most Recent Note - 8/2/2021 5:27:57 PM
G - Extended from any sound base and perched at its all-time high. Recent volume totals have been lackluster while wedging into record high territory. Its 50 DMA line ($365) and prior high in the $349 area define near-term support to watch on pullbacks. Two of the past 3 quarterly comparisons through Mar '21 have been above the +25% minimum earnings guideline (C criteria).
>>> FEATURED STOCK ARTICLE : Volume Totals Cooling While Perched at High - 7/13/2021 |
View all notes |
Set NEW NOTE alert |
Company Profile |
SEC
News |
Chart |
Request a new note
C
A
S
I |
GNRC
-
NYSE
Generac Hldgs Inc
Electrical-Power/Equipmt
|
$415.04
|
+11.32
2.80% |
$423.79
|
756,549
89.96% of 50 DAV
50 DAV is 841,000
|
$457.00
-9.18%
|
6/8/2021
|
$348.46
|
PP = $342.38
|
|
MB = $359.50
|
Most Recent Note - 8/6/2021 5:33:50 PM
G - Posted a 2nd consecutive gain with near average volume, finding support above its 50 DMA line ($390). Reported Jun '21 quarterly earnings +71% on +68% sales revenues versus the year ago period. Fundamentals remain strong.
>>> FEATURED STOCK ARTICLE : Gain for New High Leaves GNRC Very Extended From Prior Base - 7/12/2021 |
View all notes |
Set NEW NOTE alert |
Company Profile |
SEC
News |
Chart |
Request a new note
C
A
S
I |
CAMT
-
NASDAQ
Camtek Ltd
ELECTRONICS - Scientific and Technical Instrum
|
$37.64
|
+0.39
1.05% |
$38.36
|
106,460
46.49% of 50 DAV
50 DAV is 229,000
|
$40.47
-6.99%
|
8/4/2021
|
$39.67
|
PP = $40.57
|
|
MB = $42.60
|
Most Recent Note - 8/5/2021 12:45:33 PM
Y - Reversed into the red after hitting a new all-time high today. Posted a solid gain on the prior session with above average volume and closed at the session high for a best-ever close. Bullish action came after it reported Jun '21 quarterly earnings +138% on +82% sales revenues versus the year-ago period, continuing its strong earnings track record. A new pivot point was cited based on its 6/09/21 high plus 10 cents. Subsequent gains and a close above the pivot point backed by at least +40% above average volume may trigger a new (or add-on) technical buy signal. The 50 DMA line ($36.43) defines important near-term support to watch on pullbacks.
>>> FEATURED STOCK ARTICLE : Loss With Light Volume Undercut 50-Day Moving Average - 7/8/2021 |
View all notes |
Set NEW NOTE alert |
Company Profile |
SEC
News |
Chart |
Request a new note
C
A
S
I |
Symbol/Exchange
Company Name
Industry Group |
PRICE |
CHANGE
(%Change) |
Day High |
Volume
(% DAV)
(% 50 day avg vol) |
52 Wk Hi
% From Hi |
Featured
Date |
Price
Featured |
Pivot Featured |
|
Max Buy |
PKI
-
NYSE
Perkinelmer Inc
ELECTRONICS - Scientific and Technical Instrum
|
$185.43
|
-1.62
-0.87% |
$186.23
|
468,492
62.47% of 50 DAV
50 DAV is 750,000
|
$188.40
-1.58%
|
7/26/2021
|
$168.06
|
PP = $162.80
|
|
MB = $170.94
|
Most Recent Note - 8/6/2021 5:17:17 PM
G - Extended from any sound base. A small loss today on light volume followed a streak of 15 gains in the prior 16 sessions, many with above average volume as it hit new all-time highs. Bullish action came after it reported earnings +80% on +51% sales revenues for the Jun '21 quarter versus the year ago period. Prior high ($162) defines initial support to watch on pullbacks.
>>> FEATURED STOCK ARTICLE : Powerful Volume-Driven Breakout After Earnings Report - 7/26/2021 |
View all notes |
Set NEW NOTE alert |
Company Profile |
SEC
News |
Chart |
Request a new note
C
A
S
I |
TRMB
-
NASDAQ
Trimble Inc
ELECTRONICS - Scientific and Technical Instrum
|
$89.36
|
-0.06
-0.07% |
$90.25
|
1,089,466
108.30% of 50 DAV
50 DAV is 1,006,000
|
$89.62
-0.29%
|
8/5/2021
|
$88.83
|
PP = $84.97
|
|
MB = $89.22
|
Most Recent Note - 8/5/2021 5:07:08 PM
Y - Finished strong today after highlighted in yellow with pivot point cited based on its 4/06/21 high plus 10 cents in the earlier mid-day report. The big gain above the pivot point was backed by +72% above average volume to clinch a proper technical buy signal. Found support at its 50 DMA line ($81.14). Reported earnings +38% on +29% sales revenues for the Jun '21 quarter versus the year ago period. Three of the past 4 quarterly comparisons were above the +25% minimum earnings guideline (C criteria). Annual earnings (A criteria) growth has been strong and steady. See the latest FSU analysis for more details and a new annotated graph.
>>> FEATURED STOCK ARTICLE : Finished Strong With Gain for New High Backed by Volume - 8/5/2021 |
View all notes |
Set NEW NOTE alert |
Company Profile |
SEC
News |
Chart |
Request a new note
C
A
S
I |
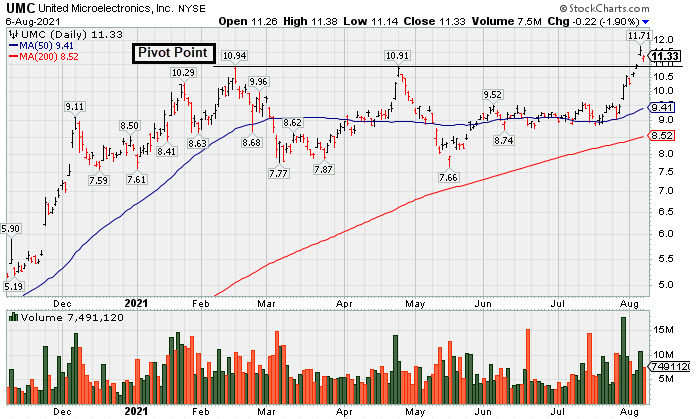
UMC
-
NYSE
United Microelectrnc Adr
ELECTRONICS - Semiconductor - Integrated Cir
|
$11.33
|
-0.22
-1.90% |
$11.38
|
7,491,034
120.13% of 50 DAV
50 DAV is 6,236,000
|
$11.71
-3.25%
|
8/5/2021
|
$11.62
|
PP = $11.38
|
|
MB = $11.95
|
Most Recent Note - 8/6/2021 5:09:16 PM
Y - Pulled back today but showed resilience and closed in the upper third of its intra-day range. It was highlighted in yellow in the 8/05/21 mid-day report with pivot point cited based on its 2/16/21 high plus 10 cents. The gap gain helped it rally above the pivot point for a new all-time high backed by +72% above average volume triggering a proper technical buy signal. Reported Jun '21 quarterly earnings +100% on +21% sales revenues versus the year ago period. Recent quarters showed solid earnings and improved sales revenues increases satisfying the C criteria. Annual earnings (A criteria) growth has been strong after a noted downturn in FY '18. See the latest FSU analysis for more details and a new annotated graph.
>>> FEATURED STOCK ARTICLE : Taiwan-Based Semiconductor Firm's Breakout Highlighted This Week - 8/6/2021 |
View all notes |
Set NEW NOTE alert |
Company Profile |
SEC
News |
Chart |
Request a new note
C
A
S
I |
ASML
-
NASDAQ
A S M L Holding N.V. NY
ELECTRONICS - Semiconductor Equipment and Mate
|
$783.28
|
-11.47
-1.44% |
$787.19
|
551,911
80.22% of 50 DAV
50 DAV is 688,000
|
$805.64
-2.78%
|
5/25/2021
|
$669.59
|
PP = $675.75
|
|
MB = $709.54
|
Most Recent Note - 8/3/2021 5:43:55 PM
G - Hit another new all-time high with lighter volume behind today's 10th gain in the span of 11 sessions. Its 50 DMA line ($700) defines important near-term support to watch on pullbacks.
>>> FEATURED STOCK ARTICLE : Volume Higher While Pulling Back Toward 50-Day Moving Average - 7/1/2021 |
View all notes |
Set NEW NOTE alert |
Company Profile |
SEC
News |
Chart |
Request a new note
C
A
S
I |
ENTG
-
NASDAQ
Entegris Inc
ELECTRONICS - Semiconductor Equipment and Mate
|
$121.58
|
-0.38
-0.31% |
$122.06
|
512,069
74.21% of 50 DAV
50 DAV is 690,000
|
$126.41
-3.82%
|
8/4/2021
|
$125.33
|
PP = $126.51
|
|
MB = $132.84
|
Most Recent Note - 8/4/2021 5:01:20 PM
Y - Color code was changed to yellow with pivot point cited based on its 4/05/21 high plus 10 cents. Matched its 52-week high with today's 6th consecutive gain. Subsequent gains and a close above the pivot point backed by at least +40% above average volume may trigger a proper technical buy signal. Fundamentals remain strong as it reported Jun '21 quarterly earnings +42% on +27% sales revenues. Its Relative Strength Rating is 85, above the 80+ minimum guideline for buy candidates. See the latest FSU analysis for more details and a new annotated graph.
>>> FEATURED STOCK ARTICLE : Perched Near High After 6th Consecutive Gain - 8/4/2021 |
View all notes |
Set NEW NOTE alert |
Company Profile |
SEC
News |
Chart |
Request a new note
C
A
S
I |
Symbol/Exchange
Company Name
Industry Group |
PRICE |
CHANGE
(%Change) |
Day High |
Volume
(% DAV)
(% 50 day avg vol) |
52 Wk Hi
% From Hi |
Featured
Date |
Price
Featured |
Pivot Featured |
|
Max Buy |
LUNA
-
NASDAQ
Luna Innovations Inc
Medical-Research Eqp/Svc
|
$12.59
|
-0.17
-1.33% |
$12.99
|
111,620
73.43% of 50 DAV
50 DAV is 152,000
|
$13.05
-3.52%
|
7/26/2021
|
$12.46
|
PP = $13.15
|
|
MB = $13.81
|
Most Recent Note - 8/5/2021 5:15:53 PM
Y - Managed a best-ever close with +24% above average volume today as it posted a 12th gain in the span of 13 sessions. Highlighted in yellow in the 7/26/21 mid-day report with pivot point cited based on its 3/12/21 high plus 10 cents. Rallied impressively from support at its 200 DMA line, nearly challenging its 52-week high. Subsequent gains above the pivot point backed by at least +40% above average volume may trigger a technical buy signal. Reported Mar '21 quarterly earnings +50% on +53% sales revenues versus the year ago period, its 4th strong quarterly comparison (C criteria). Annual earnings (A criteria) history has improved in recent years, helping it match with the fundamental guidelines of the fact-based investment system.
>>> FEATURED STOCK ARTICLE : Pulled Back After Streak of Gains Challenging 52-Week High - 7/27/2021 |
View all notes |
Set NEW NOTE alert |
Company Profile |
SEC
News |
Chart |
Request a new note
C
A
S
I |
CLFD
-
NASDAQ
Clearfield Inc
TELECOMMUNICATIONS - Cables / Satalite Equipment
|
$42.47
|
-0.13
-0.31% |
$43.07
|
63,168
49.35% of 50 DAV
50 DAV is 128,000
|
$45.36
-6.37%
|
7/23/2021
|
$40.23
|
PP = $43.74
|
|
MB = $45.93
|
Most Recent Note - 8/4/2021 5:04:42 PM
Y - Holding its ground near its high with volume totals cooling after recent volume-driven gains. Fundamentals remain strong. Bullish action came after it reported Jun '21 quarterly earnings +100% on +49% sales revenues.
>>> FEATURED STOCK ARTICLE : Big Volume-Driven Gain Challenging Prior High After Earnings - 7/23/2021 |
View all notes |
Set NEW NOTE alert |
Company Profile |
SEC
News |
Chart |
Request a new note
C
A
S
I |
POOL
-
NASDAQ
Pool Corp
WHOLESALE - Basic Materials Wholesale
|
$481.09
|
-5.72
-1.17% |
$490.23
|
147,549
55.68% of 50 DAV
50 DAV is 265,000
|
$495.22
-2.85%
|
6/21/2021
|
$455.09
|
PP = $449.54
|
|
MB = $472.02
|
Most Recent Note - 8/6/2021 5:20:01 PM
G - Volume totals are cooling while perched at its all-time high, extended from any sound base. Its 50 DMA line ($456) defines important near-term support to watch.
>>> FEATURED STOCK ARTICLE : Churned Heavy Volume While Testing 50-Day Moving Average - 7/22/2021 |
View all notes |
Set NEW NOTE alert |
Company Profile |
SEC
News |
Chart |
Request a new note
C
A
S
I |
FSBW
-
NASDAQ
F S Bancorp
Banks-West/Southwest
|
$35.87
|
+0.72
2.05% |
$36.49
|
12,434
44.41% of 50 DAV
50 DAV is 28,000
|
$36.85
-2.66%
|
5/18/2021
|
$35.08
|
PP = $36.85
|
|
MB = $38.69
|
Most Recent Note - 8/6/2021 5:13:41 PM
G - Gapped up and rose above its 50 DMA line near its 52-week high with today's gain backed by light volume. Recently reported Jun '21 quarterly earnings -16% on -11% sales revenues versus the year ago period raising fundamental concerns. Do not be confused by a 2:1 stock split which impacted share prices as of 7/15/21 (Featured Price, Pivot Point, and Max Buy levels were updated accordingly).
>>> FEATURED STOCK ARTICLE : Latest Earnings Report Broke Streak of Strong Increases - 7/29/2021 |
View all notes |
Set NEW NOTE alert |
Company Profile |
SEC
News |
Chart |
Request a new note
C
A
S
I |
SMPL
-
NASDAQ
Simply Good Foods Co
Food-Confectionery
|
$36.25
|
-0.29
-0.79% |
$37.03
|
327,984
69.64% of 50 DAV
50 DAV is 471,000
|
$38.50
-5.84%
|
12/28/2020
|
$30.40
|
PP = $31.44
|
|
MB = $33.01
|
Most Recent Note - 8/4/2021 5:07:05 PM
G - Volume totals are still cooling, but it undercut its 50 DMA line ($36.16) with today's loss testing near prior highs in the $35 area. More damaging losses would raise greater concerns. Reported May '21 quarterly earnings +65% on +32% sales revenues versus the year ago period, well above the +25% minimum earnings guideline (C criteria).
>>> FEATURED STOCK ARTICLE : Pulled Back from High With Small Losses on Light Volume - 7/15/2021 |
View all notes |
Set NEW NOTE alert |
Company Profile |
SEC
News |
Chart |
Request a new note
C
A
S
I |
Symbol/Exchange
Company Name
Industry Group |
PRICE |
CHANGE
(%Change) |
Day High |
Volume
(% DAV)
(% 50 day avg vol) |
52 Wk Hi
% From Hi |
Featured
Date |
Price
Featured |
Pivot Featured |
|
Max Buy |
PYPL
-
NASDAQ
"PayPal Holdings, Inc"
Finance-CrdtCard/PmtPr
|
$279.54
|
-1.13
-0.40% |
$282.37
|
6,014,062
95.89% of 50 DAV
50 DAV is 6,271,600
|
$310.16
-9.87%
|
7/27/2021
|
$296.69
|
PP = $307.82
|
|
MB = $323.21
|
Most Recent Note - 8/6/2021 5:21:59 PM
G - Still sputtering after slumping below its 50 DMA line ($284) with damaging volume-driven losses recently raising concerns, technically. Weak action came after it reported Jun '21 quarterly earnings +7% on +19% sales revenues versus the year ago period, below the +25% minimum earnings guideline (C criteria), raising fundamental concerns.
>>> FEATURED STOCK ARTICLE : Paypal Perched at Record High - 7/28/2021 |
View all notes |
Set NEW NOTE alert |
Company Profile |
SEC
News |
Chart |
Request a new note
C
A
S
I |
SQ
-
NYSE
Square Inc Cl A
Finance-CrdtCard/PmtPr
|
$275.10
|
-6.71
-2.38% |
$285.86
|
9,435,225
108.71% of 50 DAV
50 DAV is 8,679,000
|
$289.23
-4.89%
|
8/2/2021
|
$273.78
|
PP = $283.29
|
|
MB = $297.45
|
Most Recent Note - 8/6/2021 5:27:54 PM
Y - Pulled back today with lighter (average) volume. Hit a new all-time high on the prior session with a big volume-driven gain above the pivot point triggering a technical buy signal. It reported Jun '21 quarterly earnings +267% on +143% sales revenues versus the year ago period, its 4th strong comparison well above the +25% minimum guideline (C criteria).
>>> FEATURED STOCK ARTICLE : Pullback Following Big Gain on Strong Earnings and M&A News - 8/3/2021 |
View all notes |
Set NEW NOTE alert |
Company Profile |
SEC
News |
Chart |
Request a new note
C
A
S
I |
SHOP
-
NYSE
Shopify Inc Cl A
Computer Sftwr-Enterprse
|
$1,525.06
|
-20.49
-1.33% |
$1,550.99
|
690,325
49.88% of 50 DAV
50 DAV is 1,384,000
|
$1,650.00
-7.57%
|
7/2/2021
|
$1,468.00
|
PP = $1,552.23
|
|
MB = $1,629.84
|
Most Recent Note - 8/3/2021 1:30:36 PM
Y - Consolidating below its "max buy" level. Its 50 DMA line ($1,418) and recent low define near term support to watch. Reported Jun '21 quarterly earnings +113% on +57% sales revenues versus the year ago period.
>>> FEATURED STOCK ARTICLE : Managed a Positive Reversal After Early Weakness - 7/19/2021 |
View all notes |
Set NEW NOTE alert |
Company Profile |
SEC
News |
Chart |
Request a new note
C
A
S
I |
YETI
-
NYSE
Yeti Holdings Inc
Leisure-Products
|
$101.32
|
-3.29
-3.15% |
$105.62
|
919,466
79.54% of 50 DAV
50 DAV is 1,156,000
|
$104.69
-3.22%
|
5/13/2021
|
$84.20
|
PP = $90.65
|
|
MB = $95.18
|
Most Recent Note - 8/6/2021 5:25:35 PM
G - There was a "negative reversal" today on light volume after hitting new all-time highs with recent gains backed by above average volume. Reported Jun '21 quarterly earnings +66% on +45% sales revenues versus the year ago period, continuing its strong earnings track record. Its 50 DMA line ($92.51) defines near-term support to watch on pullbacks.
>>> FEATURED STOCK ARTICLE : Volume Totals Cooling While Consolidating Near High - 7/9/2021 |
View all notes |
Set NEW NOTE alert |
Company Profile |
SEC
News |
Chart |
Request a new note
C
A
S
I |
DOCU
-
NASDAQ
Docusign Inc
Computer Sftwr-Enterprse
|
$302.63
|
-2.98
-0.98% |
$307.95
|
1,008,463
34.68% of 50 DAV
50 DAV is 2,908,000
|
$310.51
-2.54%
|
7/6/2021
|
$288.96
|
PP = $290.33
|
|
MB = $304.85
|
Most Recent Note - 8/4/2021 5:15:34 PM
Y - Posted a gain today with light volume. Hovering near its all-time high after wedging into new high territory with recent gains lacking great volume conviction. Prior low ($270.41 on 7/15/21) defines initial support above its 50 DMA line ($268).
>>> FEATURED STOCK ARTICLE : Touched New High With Average Volume Behind Today's Gain - 7/6/2021 |
View all notes |
Set NEW NOTE alert |
Company Profile |
SEC
News |
Chart |
Request a new note
C
A
S
I |
Symbol/Exchange
Company Name
Industry Group |
PRICE |
CHANGE
(%Change) |
Day High |
Volume
(% DAV)
(% 50 day avg vol) |
52 Wk Hi
% From Hi |
Featured
Date |
Price
Featured |
Pivot Featured |
|
Max Buy |
XPEL
-
NASDAQ
Xpel Inc
Auto/Truck-Tires andamp; Misc
|
$83.89
|
-2.10
-2.44% |
$87.63
|
227,177
97.50% of 50 DAV
50 DAV is 233,000
|
$103.84
-19.21%
|
7/21/2021
|
$92.25
|
PP = $94.31
|
|
MB = $99.03
|
Most Recent Note - 8/6/2021 5:23:54 PM
G - Still sputtering below its 50 DMA line ($87.44) with today's loss on average volume. Raised concerns as it fell back into the previously noted base. Prior lows in the $78.50 are define the next important support. Due to report Jun '21 quarterly results on 8/09/21. Volume and volatility often increase near earnings news.
>>> FEATURED STOCK ARTICLE : New Base Formed May Be "Late Stage" - 7/21/2021 |
View all notes |
Set NEW NOTE alert |
Company Profile |
SEC
News |
Chart |
Request a new note
C
A
S
I |
JEF
-
NYSE
Jefferies Financial Grp
Finance-Invest Bnk/Bkrs
|
$34.92
|
+0.61
1.78% |
$35.06
|
1,079,426
52.45% of 50 DAV
50 DAV is 2,058,000
|
$35.69
-2.16%
|
6/28/2021
|
$31.81
|
PP = $34.42
|
|
MB = $36.14
|
Most Recent Note - 8/5/2021 5:14:00 PM
Y - Holding its ground stubbornly and volume totals have still been cooling since it found support when recently testing its 50 DMA line ($32.38). More damaging losses would raise concerns and trigger a technical sell signal. As previously noted - "Subsequent gains above the pivot point backed by at least +40% above average volume are necessary to trigger a technical buy signal."
>>> FEATURED STOCK ARTICLE : High-Ranked Financial Firm Formed "Double Bottom" Base - 6/28/2021 |
View all notes |
Set NEW NOTE alert |
Company Profile |
SEC
News |
Chart |
Request a new note
C
A
S
I |
CLAR
-
NASDAQ
Clarus Corporation
Leisure-Products
|
$28.97
|
-0.30
-1.01% |
$29.49
|
110,162
48.74% of 50 DAV
50 DAV is 226,000
|
$32.36
-10.48%
|
5/12/2021
|
$21.40
|
PP = $19.73
|
|
MB = $20.72
|
Most Recent Note - 8/4/2021 5:03:10 PM
G - Pulled back with lighter volume today following 4 consecutive volume-driven gains into new 52-week high territory. Very extended from any sound base. Bullish action came after it reported Jun '21 quarterly earnings +244% on +41% sales revenues versus the year ago period, showing impressive sales revenues and earnings acceleration in sequential quarterly comparisons. Its 50 DMA line ($26) defines important near-term support to watch on pullbacks.
>>> FEATURED STOCK ARTICLE : Extended From Prior Base and Hitting Another New High - 7/20/2021 |
View all notes |
Set NEW NOTE alert |
Company Profile |
SEC
News |
Chart |
Request a new note
C
A
S
I |
AVTR
-
NYSE
Avantor Inc
Medical-Research Eqp/Svc
|
$38.02
|
-0.02
-0.05% |
$38.13
|
2,211,695
58.76% of 50 DAV
50 DAV is 3,764,000
|
$38.65
-1.63%
|
6/10/2021
|
$32.94
|
PP = $34.09
|
|
MB = $35.79
|
Most Recent Note - 8/6/2021 5:11:50 PM
G - Volume totals have been cooling while stubbornly holding its ground perched at its all-time high, extended from any sound base. Reported Jun '21 earnings +84% on +26% sales revenues versus the year ago period. Its 50 DMA line ($35.21) defines support above the prior high in the $34 area.
>>> FEATURED STOCK ARTICLE : Held Ground But Made Little Price Progress Since Featured - 7/14/2021 |
View all notes |
Set NEW NOTE alert |
Company Profile |
SEC
News |
Chart |
Request a new note
C
A
S
I |
MIME
-
NASDAQ
Mimecast Limited
Computer Sftwr-Security
|
$58.59
|
-0.23
-0.39% |
$59.25
|
395,344
66.44% of 50 DAV
50 DAV is 595,000
|
$59.96
-2.28%
|
8/2/2021
|
$56.12
|
PP = $59.58
|
|
MB = $62.56
|
Most Recent Note - 8/3/2021 1:24:23 PM
Y - Posting a big volume-driven gain for a new all-time high today. Bullish action came after reporting Jun '21 quarterly earnings +45% on +24% sales revenues versus the year ago period. It was highlighted in yellow in the prior mid-day report with pivot point cited based on its 12/28/20 high plus 10 cents when noted - "Subsequent gains above the pivot point backed by at least +40% above average volume may trigger a technical buy signal. Due to report Jun '21 quarterly results. Volume and volatility often increase near earnings news. Quarterly and annual earnings (C and A criteria) history has been strong after a loss in FY '18."
>>> FEATURED STOCK ARTICLE : Perched Not Far From High With Earnings News Due Pre-Open - 8/2/2021 |
View all notes |
Set NEW NOTE alert |
Company Profile |
SEC
News |
Chart |
Request a new note
C
A
S
I |
Symbol/Exchange
Company Name
Industry Group |
PRICE |
CHANGE
(%Change) |
Day High |
Volume
(% DAV)
(% 50 day avg vol) |
52 Wk Hi
% From Hi |
Featured
Date |
Price
Featured |
Pivot Featured |
|
Max Buy |