You are not logged in.
This means you
CAN ONLY VIEW reports that were published prior to Thursday, March 20, 2025.
You
MUST UPGRADE YOUR MEMBERSHIP if you want to see any current reports.
AFTER MARKET UPDATE - THURSDAY, JULY 22ND, 2021
Previous After Market Report Next After Market Report >>>
|
|
|
|
DOW |
+25.35 |
34,823.35 |
+0.07% |
|
Volume |
742,291,068 |
-13% |
|
Volume |
3,522,737,800 |
-13% |
|
NASDAQ |
+52.29 |
14,684.25 |
+0.36% |
|
Advancers |
1,006 |
31% |
|
Advancers |
1,536 |
35% |
|
S&P 500 |
+8.79 |
4,367.48 |
+0.20% |
|
Decliners |
2,209 |
69% |
|
Decliners |
2,819 |
65% |
|
Russell 2000 |
-34.57 |
2,199.48 |
-1.55% |
|
52 Wk Highs |
77 |
|
|
52 Wk Highs |
92 |
|
|
S&P 600 |
-23.82 |
1,309.16 |
-1.79% |
|
52 Wk Lows |
22 |
|
|
52 Wk Lows |
53 |
|
|
 |
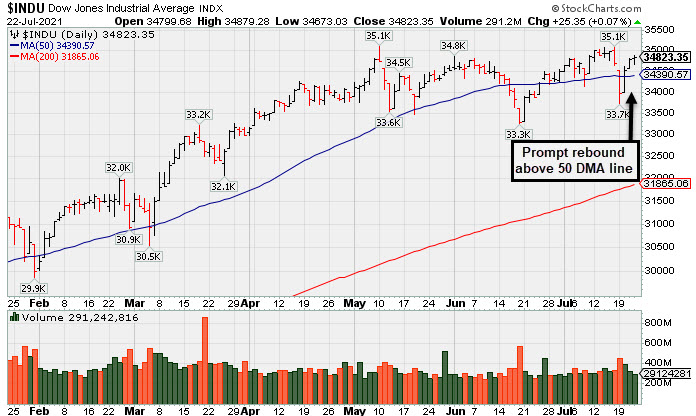
Breadth Positive as Indices Inch Higher With Lighter Volume
Kenneth J. Gruneisen - Passed the CAN SLIM® Master's Exam
The Dow added 25 points, reversing earlier losses. The S&P 500 capped a third consecutive day of gains with a 0.2% advance. The Nasdaq Composite climbed 0.4% amid strength in mega-cap tech stocks. All three major averages are now within 0.5% of their record closing levels and remain on track for weekly gains. The volume totals reported were lighter than the prior session on the NYSE and on the Nasdaq exchange. Breadth was negative as decliners led advancers by more than a 2-1 margin on the NYSE and nearly 2-1 on the Nasdaq exchange. There were 42 high-ranked companies from the Leaders List that hit new 52-week highs and were listed on the BreakOuts Page, versus 44 on the prior session. New 52-week highs totals contracted yet still outnumbered new 52-week lows on the NYSE and on the Nasdaq exchange. The major indices (M criteria) are in an uptrend that has come under pressure. Investors are reminded to always make buying and selling decisions on case-by-case basis under the strict criteria and rules of the fact-based investment system.
PICTURED: The Dow Jones Industrial Average found prompt support near its 50-day moving average (DMA) line. More damaging losses would raise concerns.
U.S. stocks finished higher on Thursday as investors digested a deluge of economic data and corporate earnings results. Six of 11 S&P 500 sectors ended in positive territory, with gains in the Technology and Health Care sectors offsetting losses from the lagging Energy and Financials groups. In earnings, Texas Instruments fell 5.3% with its current-quarter revenue projections disappointing analysts as the global chip shortage hinders the semiconductor manufacturer’s ability to meet pent-up demand. Domino’s Pizza (DPZ +14.55%) powered to a new all-time high after being the subject of positive analyst comments following a top and bottom line beat. In the Industrial space, rail operator CSX Corp. (CSX +3.48%) gapped up above its 50 DMA line after its quarterly earnings more than doubled. American Airlines (AAL -1.12%) and rival Southwest Airlines (LUV -3.46%) both slumped.
Treasuries strengthened, with the yield on the 10-year note down three basis points to 1.26%, holding above Monday’s closing level of 1.19% when rates dropped on growth concerns. On the data front, weekly initial jobless claims unexpectedly increased to 419,000. Separately, the leading index of economic indicators rose for a fourth consecutive month in June (+0.7%). Another release revealed existing home sales rebounded 1.4% in June, increasing for the first time in five months. |
 Kenneth J. Gruneisen started out as a licensed stockbroker in August 1987, a couple of months prior to the historic stock market crash that took the Dow Jones Industrial Average down -22.6% in a single day. He has published daily fact-based fundamental and technical analysis on high-ranked stocks online for two decades. Through FACTBASEDINVESTING.COM, Kenneth provides educational articles, news, market commentary, and other information regarding proven investment systems that work in good times and bad.
Comments contained in the body of this report are technical opinions only and are not necessarily those of Gruneisen Growth Corp. The material herein has been obtained from sources believed to be reliable and accurate, however, its accuracy and completeness cannot be guaranteed. Our firm, employees, and customers may effect transactions, including transactions contrary to any recommendation herein, or have positions in the securities mentioned herein or options with respect thereto. Any recommendation contained in this report may not be suitable for all investors and it is not to be deemed an offer or solicitation on our part with respect to the purchase or sale of any securities. |
|
 |
Retail Index Rose; Financial, Tech, and Commodity-Linked Groups Fell
Kenneth J. Gruneisen - Passed the CAN SLIM® Master's Exam
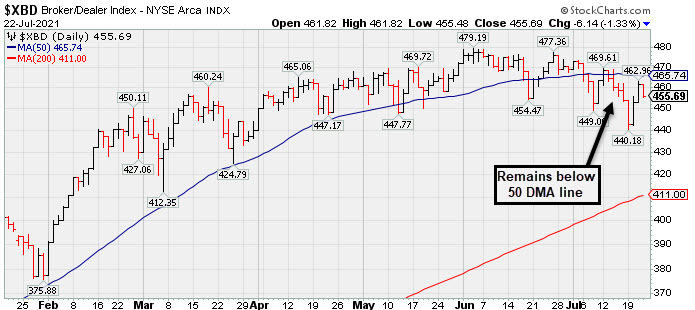
The Broker/Dealer Index ($XBD -1.33%) and Bank Index ($BKX -1.59%) both lost ground while a gain for the Retail Index ($RLX +0.97%) helped offset the negative pressure. The Semiconductor Index ($SOX -0.88%) and Networking Index ($NWX -1.21%) both lost ground while the Biotech Index ($BTK -0.08%) finished flat. Commodity-linked groups had a negative bias as the Oil Services Index ($OSX -1.77%), Integrated Oil Index ($XOI -0.98%), and Gold & Silver Index ($XAU -0.85%) ended unanimously lower.
PICTURED: The Broker/Dealer Index ($XBD -1.33%) remains below its 50-day moving average (DMA) line which has recently acted as resistance.
| Oil Services |
$OSX |
56.19 |
-1.01 |
-1.77% |
+26.76% |
| Integrated Oil |
$XOI |
1,007.44 |
-10.00 |
-0.98% |
+27.13% |
| Semiconductor |
$SOX |
3,259.91 |
-28.84 |
-0.88% |
+16.61% |
| Networking |
$NWX |
837.13 |
-10.22 |
-1.21% |
+16.73% |
| Broker/Dealer |
$XBD |
455.69 |
-6.14 |
-1.33% |
+20.68% |
| Retail |
$RLX |
4,151.57 |
+40.00 |
+0.97% |
+16.51% |
| Gold & Silver |
$XAU |
136.59 |
-1.17 |
-0.85% |
-5.27% |
| Bank |
$BKX |
121.07 |
-1.96 |
-1.59% |
+23.66% |
| Biotech |
$BTK |
5,736.75 |
-4.31 |
-0.08% |
-0.04% |
|
|
|
 |
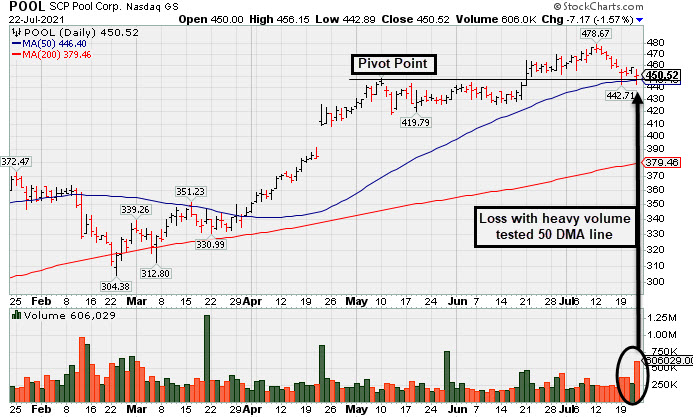
Churned Heavy Volume While Testing 50-Day Moving Average
Kenneth J. Gruneisen - Passed the CAN SLIM® Master's Exam
Pool Corp (POOL -$7.17 or -1.57% to $450.52) churned heavy volume today while finding support near its 50-day moving average (DMA) line. It reported Jun '21 quarterly earnings +66% on +40% sales revenues versus the year ago period. Recent losses have tested prior highs in the $449-444 range and its 50-day moving average (DMA) line ($446) which define important support. More damaging losses would raise concerns and trigger a technical sell signal.
POOL was highlighted in yellow with pivot point cited based on its 5/10/21 high plus 10 cents in the 6/11/21 mid-day report (read here) and it was shown in more detail with an annotated graph that evening under the headline "Volume-Driven Breakout After Orderly Consolidation". The gain and close above the pivot point was backed +87% above average volume helping clinch a technical buy signal.
It has an Earnings Per Share Rating of 99. The past 4 quarterly comparisons were well above the +25% minimum earnings guideline (C criteria), helping it match the fact-based investment system's fundamental guidelines.
The high-ranked Retail - Leisure Products firm has seen the number of top-rated funds owning its shares rise from 813 in Jun '20 to 1,418 in Jun '21, a reassuring sign concerning the I criteria. Its current Up/Down Volume Ratio of 1.0 is an unbiased indication its shares have been neutral concerning accumulation/distribution over the past 50 days. It has a Timeliness rating of A and Sponsorship Rating of B. Its small supply of only 40.1 million shares outstanding (S criteria) can contribute to greater price volatility in the event of institutional buying or selling.
|
|
|
Color Codes Explained :
Y - Better candidates highlighted by our
staff of experts.
G - Previously featured
in past reports as yellow but may no longer be buyable under the
guidelines.
***Last / Change / Volume data in this table is the closing quote data***
Symbol/Exchange
Company Name
Industry Group |
PRICE |
CHANGE
(%Change) |
Day High |
Volume
(% DAV)
(% 50 day avg vol) |
52 Wk Hi
% From Hi |
Featured
Date |
Price
Featured |
Pivot Featured |
|
Max Buy |
 SIVB
-
NASDAQ
SIVB
-
NASDAQ
S V B Financial Group
BANKING - Regional - Pacific Banks
|
$569.32
|
-4.68
-0.82% |
$576.80
|
284,649
75.11% of 50 DAV
50 DAV is 379,000
|
$608.84
-6.49%
|
4/23/2021
|
$579.70
|
PP = $577.16
|
|
MB = $606.02
|
Most Recent Note - 7/20/2021 5:20:09 PM
G - Posted a big gain today but remains below its 50 DMA line ($568.47). Only a prompt rebound above the 50 DMA line would help its outlook improve.
>>> FEATURED STOCK ARTICLE : Consolidating Near 50-Day Average After Distributional Pressure - 6/25/2021 |
View all notes |
Set NEW NOTE alert |
Company Profile |
SEC
News |
Chart |
Request a new note
C
A
S
I |
LOGI
-
NASDAQ
Logitech Intl Sa
COMPUTER HARDWARE - Computer Peripherals
|
$120.30
|
-0.88
-0.73% |
$122.37
|
1,120,489
146.58% of 50 DAV
50 DAV is 764,400
|
$140.17
-14.18%
|
5/26/2021
|
$119.13
|
PP = $120.34
|
|
MB = $126.36
|
 Most Recent Note - 7/22/2021 1:06:35 PM
G - Posted 3 consecutive gains with light volume rebounding near its 50 DMA line ($121.85). A gain and strong close above the 50 DMA line would help its outlook improve. Due to report Jun '21 quarterly results on 7/27/21.
>>> FEATURED STOCK ARTICLE : Recent Pullback is Testing Important Technical Support - 7/2/2021 |
View all notes |
Set NEW NOTE alert |
Company Profile |
SEC
News |
Chart |
Request a new note
C
A
S
I |
CROX
-
NASDAQ
Crocs Inc
CONSUMER NON-DURABLES - Textile - Apparel Footwear
|
$131.93
|
+11.95
9.96% |
$136.50
|
5,830,291
412.62% of 50 DAV
50 DAV is 1,413,000
|
$120.92
9.11%
|
6/14/2021
|
$112.64
|
PP = $110.01
|
|
MB = $115.51
|
Most Recent Note - 7/22/2021 12:45:39 PM
G - Gapped up today for a 4th consecutive gain, powering into new all-time high territory, getting extended from any sound base. Found support at its 50 DMA line ($108.97).
>>> FEATURED STOCK ARTICLE : Quietly Consolidating Below "Max Buy" Level - 7/7/2021 |
View all notes |
Set NEW NOTE alert |
Company Profile |
SEC
News |
Chart |
Request a new note
C
A
S
I |
CRL
-
NYSE
Charles River Labs Intl
DRUGS - Biotechnology
|
$393.25
|
+7.48
1.94% |
$393.78
|
217,259
32.52% of 50 DAV
50 DAV is 668,000
|
$386.57
1.73%
|
6/9/2021
|
$345.91
|
PP = $349.23
|
|
MB = $366.69
|
Most Recent Note - 7/19/2021 5:43:10 PM
G - Volume totals have been below average while consolidating after wedging into record high territory. Prior highs in the $349 area and its 50 DMA line ($351) define near-term support to watch on pullbacks. Two of the past 3 quarterly comparisons through Mar '21 have been above the +25% minimum earnings guideline (C criteria).
>>> FEATURED STOCK ARTICLE : Volume Totals Cooling While Perched at High - 7/13/2021 |
View all notes |
Set NEW NOTE alert |
Company Profile |
SEC
News |
Chart |
Request a new note
C
A
S
I |
GNRC
-
NYSE
Generac Hldgs Inc
Electrical-Power/Equipmt
|
$444.59
|
-2.75
-0.61% |
$450.99
|
438,906
56.93% of 50 DAV
50 DAV is 771,000
|
$452.92
-1.84%
|
6/8/2021
|
$348.46
|
PP = $342.38
|
|
MB = $359.50
|
Most Recent Note - 7/21/2021 2:13:45 PM
G - Perched near its all-time high, very extended from the previously noted base. Its 50 DMA line ($368) and prior high ($364) define important near-term support to watch on pullbacks. Fundamentals remain strong.
>>> FEATURED STOCK ARTICLE : Gain for New High Leaves GNRC Very Extended From Prior Base - 7/12/2021 |
View all notes |
Set NEW NOTE alert |
Company Profile |
SEC
News |
Chart |
Request a new note
C
A
S
I |
Symbol/Exchange
Company Name
Industry Group |
PRICE |
CHANGE
(%Change) |
Day High |
Volume
(% DAV)
(% 50 day avg vol) |
52 Wk Hi
% From Hi |
Featured
Date |
Price
Featured |
Pivot Featured |
|
Max Buy |
CAMT
-
NASDAQ
Camtek Ltd
ELECTRONICS - Scientific and Technical Instrum
|
$34.74
|
-0.84
-2.36% |
$35.80
|
111,179
40.43% of 50 DAV
50 DAV is 275,000
|
$40.47
-14.16%
|
4/28/2021
|
$35.03
|
PP = $35.34
|
|
MB = $37.11
|
Most Recent Note - 7/20/2021 5:23:45 PM
G - Rebounded near its 50 DMA line ($34.82) with light volume behind today's gain. Subsequent gains above the 50 DMA line would help its outlook improve.
>>> FEATURED STOCK ARTICLE : Loss With Light Volume Undercut 50-Day Moving Average - 7/8/2021 |
View all notes |
Set NEW NOTE alert |
Company Profile |
SEC
News |
Chart |
Request a new note
C
A
S
I |
ASML
-
NASDAQ
A S M L Holding N.V. NY
ELECTRONICS - Semiconductor Equipment and Mate
|
$729.92
|
+8.92
1.24% |
$740.06
|
945,293
125.20% of 50 DAV
50 DAV is 755,000
|
$723.01
0.96%
|
5/25/2021
|
$669.59
|
PP = $675.75
|
|
MB = $709.54
|
Most Recent Note - 7/22/2021 12:35:04 PM
G - Prior session's gain and strong close was backed by +69% above average volume, a reassuring sign of fresh institutional buying demand. Color code is changed to green as it has rallied above its "max buy" level and hit new all-time highs. Retested its 50 DMA line ($679) which defines important near-term support. More damaging losses would raise concerns and trigger technical sell signals.
>>> FEATURED STOCK ARTICLE : Volume Higher While Pulling Back Toward 50-Day Moving Average - 7/1/2021 |
View all notes |
Set NEW NOTE alert |
Company Profile |
SEC
News |
Chart |
Request a new note
C
A
S
I |
POOL
-
NASDAQ
Pool Corp
WHOLESALE - Basic Materials Wholesale
|
$450.52
|
-7.17
-1.57% |
$456.15
|
606,029
235.81% of 50 DAV
50 DAV is 257,000
|
$478.67
-5.88%
|
6/21/2021
|
$455.09
|
PP = $449.54
|
|
MB = $472.02
|
Most Recent Note - 7/22/2021 5:12:47 PM
Y - Churned heavy volume today while testing its 50 DMA line after it reported Jun '21 quarterly earnings +66% on +40% sales revenues versus the year ago period. Recent losses have tested prior highs in the $449-444 range and its 50 DMA line ($446) which define important support. More damaging losses would raise concerns and trigger a technical sell signal. See the latest FSU analysis for more details and a new annotated graph.
>>> FEATURED STOCK ARTICLE : Churned Heavy Volume While Testing 50-Day Moving Average - 7/22/2021 |
View all notes |
Set NEW NOTE alert |
Company Profile |
SEC
News |
Chart |
Request a new note
C
A
S
I |
FSBW
-
NASDAQ
F S Bancorp
Banks-West/Southwest
|
$34.86
|
-0.50
-1.41% |
$35.97
|
20,814
67.14% of 50 DAV
50 DAV is 31,000
|
$36.85
-5.40%
|
5/18/2021
|
$35.08
|
PP = $36.85
|
|
MB = $38.69
|
Most Recent Note - 7/20/2021 5:16:51 PM
Y - Color code is changed to yellow after promptly rebounding above its 50 DMA line ($35.14) with today's big gain helping its outlook to improve. Subsequent gains above the pivot point backed by at least +40% above average volume are needed to trigger a technical buy signal. Do not be confused by a 2:1 stock split which impacted share prices as of 7/15/21 (Featured Price, Pivot Point, and Max Buy levels were updated accordingly).
>>> FEATURED STOCK ARTICLE : Still Consolidating With Close Striking Distance of All-Time High - 6/24/2021 |
View all notes |
Set NEW NOTE alert |
Company Profile |
SEC
News |
Chart |
Request a new note
C
A
S
I |
SMPL
-
NASDAQ
Simply Good Foods Co
Food-Confectionery
|
$36.90
|
-0.25
-0.67% |
$37.23
|
341,138
60.59% of 50 DAV
50 DAV is 563,000
|
$38.50
-4.16%
|
12/28/2020
|
$30.40
|
PP = $31.44
|
|
MB = $33.01
|
Most Recent Note - 7/20/2021 5:27:36 PM
G - Stubbornly holding its ground near its all-time high. Its 50 DMA line ($35.40) and prior highs in the $35 area define important near-term support to watch on pullbacks. Reported May '21 quarterly earnings +65% on +32% sales revenues versus the year ago period, well above the +25% minimum earnings guideline (C criteria).
>>> FEATURED STOCK ARTICLE : Pulled Back from High With Small Losses on Light Volume - 7/15/2021 |
View all notes |
Set NEW NOTE alert |
Company Profile |
SEC
News |
Chart |
Request a new note
C
A
S
I |
Symbol/Exchange
Company Name
Industry Group |
PRICE |
CHANGE
(%Change) |
Day High |
Volume
(% DAV)
(% 50 day avg vol) |
52 Wk Hi
% From Hi |
Featured
Date |
Price
Featured |
Pivot Featured |
|
Max Buy |
SHOP
-
NYSE
Shopify Inc Cl A
Computer Sftwr-Enterprse
|
$1,594.09
|
+24.73
1.58% |
$1,602.57
|
1,845,139
131.70% of 50 DAV
50 DAV is 1,401,000
|
$1,587.74
0.40%
|
7/2/2021
|
$1,468.00
|
PP = $1,552.23
|
|
MB = $1,629.84
|
Most Recent Note - 7/22/2021 1:17:16 PM
Y - On track today for its 5th consecutive small gain into new high territory. A new pivot point was recently cited based on its 6/21/21 high while building on a cup-with-high-handle base. Confirming gains with at least +40% above average volume for new highs would help clinch a proper new (or add-on) technical buy signal and be a reassuring sign of fresh institutional buying demand.
>>> FEATURED STOCK ARTICLE : Managed a Positive Reversal After Early Weakness - 7/19/2021 |
View all notes |
Set NEW NOTE alert |
Company Profile |
SEC
News |
Chart |
Request a new note
C
A
S
I |
YETI
-
NYSE
Yeti Holdings Inc
Leisure-Products
|
$93.81
|
+0.97
1.04% |
$93.99
|
371,684
26.23% of 50 DAV
50 DAV is 1,417,000
|
$96.62
-2.91%
|
5/13/2021
|
$84.20
|
PP = $90.65
|
|
MB = $95.18
|
Most Recent Note - 7/20/2021 5:29:38 PM
Y - Color code is changed to yellow after today's gain allowed it to rebound and close above its 50 DMA line ($89.52) helping its outlook improve. More damaging losses would raise greater concerns. Fundamentals remain strong.
>>> FEATURED STOCK ARTICLE : Volume Totals Cooling While Consolidating Near High - 7/9/2021 |
View all notes |
Set NEW NOTE alert |
Company Profile |
SEC
News |
Chart |
Request a new note
C
A
S
I |
DOCU
-
NASDAQ
Docusign Inc
Computer Sftwr-Enterprse
|
$308.00
|
+5.19
1.71% |
$310.51
|
1,934,526
62.73% of 50 DAV
50 DAV is 3,084,000
|
$306.00
0.65%
|
7/6/2021
|
$288.96
|
PP = $290.33
|
|
MB = $304.85
|
Most Recent Note - 7/20/2021 11:54:17 AM
Y - Posting a 4th consecutive gain today and hitting a new all-time high. Wedging into new high territory with gains in recent weeks lacking great volume conviction. Highlighted in yellow with pivot point cited based on its 9/02/20 high plus 10 cents. A gain and strong close above the pivot point cited backed by at least +40% above average volume may trigger a convincing new (or add-on) technical buy signal. Fundamentals remain strong after reporting very strong Apr '21 quarterly results.
>>> FEATURED STOCK ARTICLE : Touched New High With Average Volume Behind Today's Gain - 7/6/2021 |
View all notes |
Set NEW NOTE alert |
Company Profile |
SEC
News |
Chart |
Request a new note
C
A
S
I |
XPEL
-
NASDAQ
Xpel Inc
Auto/Truck-Tires andamp; Misc
|
$98.66
|
+6.81
7.41% |
$101.42
|
615,555
293.12% of 50 DAV
50 DAV is 210,000
|
$94.21
4.72%
|
7/21/2021
|
$92.25
|
PP = $94.31
|
|
MB = $99.03
|
Most Recent Note - 7/22/2021 1:21:14 PM
Y - Hitting new all-time highs with today's 5th consecutive gain backed by higher volume. Color code was changed to yellow with pivot point cited based on its 6/07/21 high plus 10 cents. Its 6-week consolidation has the look of a riskier "late-stage" base after finding prompt support again at its 50 DMA line ($84.42). Reported Mar '21 quarterly earnings +317% on +83% sales revenues versus the year ago period, adding to its strong earnings track record.
>>> FEATURED STOCK ARTICLE : New Base Formed May Be "Late Stage" - 7/21/2021 |
View all notes |
Set NEW NOTE alert |
Company Profile |
SEC
News |
Chart |
Request a new note
C
A
S
I |
JEF
-
NYSE
Jefferies Financial Grp
Finance-Invest Bnk/Bkrs
|
$32.93
|
-0.60
-1.79% |
$33.53
|
1,407,062
63.44% of 50 DAV
50 DAV is 2,218,000
|
$35.69
-7.73%
|
6/28/2021
|
$31.81
|
PP = $34.42
|
|
MB = $36.14
|
Most Recent Note - 7/19/2021 5:54:21 PM
Y - Gapped down today testing its 50 DMA line ($32.08). More damaging losses would raise concerns and trigger a technical sell signal. As previously noted - "Subsequent gains above the pivot point backed by at least +40% above average volume are necessary to trigger a technical buy signal."
>>> FEATURED STOCK ARTICLE : High-Ranked Financial Firm Formed "Double Bottom" Base - 6/28/2021 |
View all notes |
Set NEW NOTE alert |
Company Profile |
SEC
News |
Chart |
Request a new note
C
A
S
I |
Symbol/Exchange
Company Name
Industry Group |
PRICE |
CHANGE
(%Change) |
Day High |
Volume
(% DAV)
(% 50 day avg vol) |
52 Wk Hi
% From Hi |
Featured
Date |
Price
Featured |
Pivot Featured |
|
Max Buy |
CLAR
-
NASDAQ
Clarus Corporation
Leisure-Products
|
$28.08
|
-0.47
-1.65% |
$28.86
|
133,311
56.01% of 50 DAV
50 DAV is 238,000
|
$28.70
-2.16%
|
5/12/2021
|
$21.40
|
PP = $19.73
|
|
MB = $20.72
|
Most Recent Note - 7/21/2021 12:38:42 PM
G - Hitting another new 52-week high today with a gain backed by above average volume. It did not form a sound base of sufficient length. Its 50 DMA line ($24.67) defines important near-term support to watch. See the latest FSU analysis for more details and an annotated graph.
>>> FEATURED STOCK ARTICLE : Extended From Prior Base and Hitting Another New High - 7/20/2021 |
View all notes |
Set NEW NOTE alert |
Company Profile |
SEC
News |
Chart |
Request a new note
C
A
S
I |
AVTR
-
NYSE
Avantor Inc
Medical-Research Eqp/Svc
|
$37.10
|
+0.26
0.71% |
$37.33
|
2,459,573
63.15% of 50 DAV
50 DAV is 3,895,000
|
$37.35
-0.67%
|
6/10/2021
|
$32.94
|
PP = $34.09
|
|
MB = $35.79
|
Most Recent Note - 7/20/2021 5:21:50 PM
G - Posted a solid gain today for a new all-time high. Prior highs in the $33 area coincide with its 50 DMA line defining important support to watch on pullbacks.
>>> FEATURED STOCK ARTICLE : Held Ground But Made Little Price Progress Since Featured - 7/14/2021 |
View all notes |
Set NEW NOTE alert |
Company Profile |
SEC
News |
Chart |
Request a new note
C
A
S
I |
|
|
|
THESE ARE NOT BUY RECOMMENDATIONS!
Comments contained in the body of this report are technical
opinions only. The material herein has been obtained
from sources believed to be reliable and accurate, however,
its accuracy and completeness cannot be guaranteed.
This site is not an investment advisor, hence it does
not endorse or recommend any securities or other investments.
Any recommendation contained in this report may not
be suitable for all investors and it is not to be deemed
an offer or solicitation on our part with respect to
the purchase or sale of any securities. All trademarks,
service marks and trade names appearing in this report
are the property of their respective owners, and are
likewise used for identification purposes only.
This report is a service available
only to active Paid Premium Members.
You may opt-out of receiving report notifications
at any time. Questions or comments may be submitted
by writing to Premium Membership Services 665 S.E. 10 Street, Suite 201 Deerfield Beach, FL 33441-5634 or by calling 1-800-965-8307
or 954-785-1121.
|
|
|