You are not logged in.
This means you
CAN ONLY VIEW reports that were published prior to Thursday, March 20, 2025.
You
MUST UPGRADE YOUR MEMBERSHIP if you want to see any current reports.
AFTER MARKET UPDATE - MONDAY, JULY 26TH, 2021
Previous After Market Report Next After Market Report >>>
|
|
|
|
DOW |
+82.76 |
35,144.31 |
+0.24% |
|
Volume |
870,732,502 |
+7% |
|
Volume |
4,356,802,100 |
+11% |
|
NASDAQ |
+6.37 |
14,843.36 |
+0.04% |
|
Advancers |
1,840 |
56% |
|
Advancers |
1,927 |
44% |
|
S&P 500 |
+10.51 |
4,422.30 |
+0.24% |
|
Decliners |
1,436 |
44% |
|
Decliners |
2,443 |
56% |
|
Russell 2000 |
+7.27 |
2,216.92 |
+0.33% |
|
52 Wk Highs |
123 |
|
|
52 Wk Highs |
115 |
|
|
S&P 600 |
+11.43 |
1,329.99 |
+0.87% |
|
52 Wk Lows |
67 |
|
|
52 Wk Lows |
154 |
|
|
 |
Market Internals Were Mixed as Major Indices Rose
Kenneth J. Gruneisen - Passed the CAN SLIM® Master's Exam
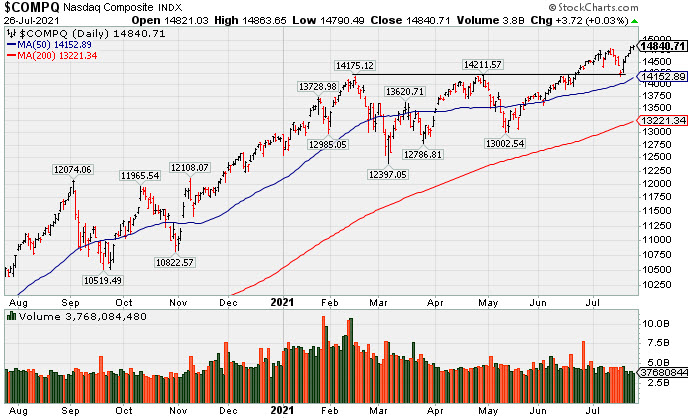
The Dow added 82 points, while the S&P 500 gained 0.2%, with both benchmarks finishing at fresh all-time highs. The Nasdaq Composite eked out a gain of less than 0.1% to notch its own record closing peak. The volume totals reported were higher than the prior session on the NYSE and on the Nasdaq exchange. Breadth was mixed as advancers led decliners by a 9-7 margin on the NYSE, but decliners led advancers by about 5-4 on the Nasdaq exchange. There were 51 high-ranked companies from the Leaders List that hit new 52-week highs and were listed on the BreakOuts Page. New 52-week highs totals contracted but still outnumbered new 52-week lows on the NYSE, however, new lows outnumbered new highs on the Nasdaq exchange. The major indices (M criteria) are in an uptrend that has come under pressure. Investors are reminded to always make buying and selling decisions on case-by-case basis under the strict criteria and rules of the fact-based investment system.
PICTURED: The Nasdaq Composite Index posted a 5th consecutive gain and hit a new record high. It found support near the prior high and well above its 50-day moving average (DMA) line. More damaging losses would raise concerns.
U.S. stocks rose to new record levels on Monday as Wall Street braced for one of the busiest weeks of the summer that includes key corporate earnings results, a Fed meeting, and a flurry of economic reports.
In earnings, toymaker Hasbro (HAS +12.24%) rose following a solid top and bottom line beat. Overall, more than a third of the S&P 500 reports second-quarter results this week, including some of the world’s largest companies. In other corporate news, Aon Plc (AON +8.15%) rose after terminating a $30 billion takeover of Willis Towers Watson Plc (WLTW -8.98%) following antitrust pushback from the Department of Justice.
Investors also monitored another wave of regulatory crackdowns in China. Hong Kong’s Hang Seng tumbled 4.1%, dragging the benchmark into negative year-to-date territory after Chinese officials announced reforms of the education tech sector. Elsewhere, bitcoin futures jumped almost 25% amid speculation Amazon (AMZN +1.18%) could be entering the cryptocurrency space.
On the data front, new home sales unexpectedly declined 6.6% in June to the lowest point since April 2020. Separately, an update from the Dallas Fed showed manufacturing activity in the region eased in July. Treasuries ended slightly lower, with the yield on the 10-year note up one basis point to 1.29%. On Wednesday, all eyes will be on the Federal Reserve’s policy decision and Fed Chair Jerome Powell’s post-meeting press conference.
|
 Kenneth J. Gruneisen started out as a licensed stockbroker in August 1987, a couple of months prior to the historic stock market crash that took the Dow Jones Industrial Average down -22.6% in a single day. He has published daily fact-based fundamental and technical analysis on high-ranked stocks online for two decades. Through FACTBASEDINVESTING.COM, Kenneth provides educational articles, news, market commentary, and other information regarding proven investment systems that work in good times and bad.
Comments contained in the body of this report are technical opinions only and are not necessarily those of Gruneisen Growth Corp. The material herein has been obtained from sources believed to be reliable and accurate, however, its accuracy and completeness cannot be guaranteed. Our firm, employees, and customers may effect transactions, including transactions contrary to any recommendation herein, or have positions in the securities mentioned herein or options with respect thereto. Any recommendation contained in this report may not be suitable for all investors and it is not to be deemed an offer or solicitation on our part with respect to the purchase or sale of any securities. |
|
 |
Retail, Financial, and Commodity-Linked Groups Rose
Kenneth J. Gruneisen - Passed the CAN SLIM® Master's Exam
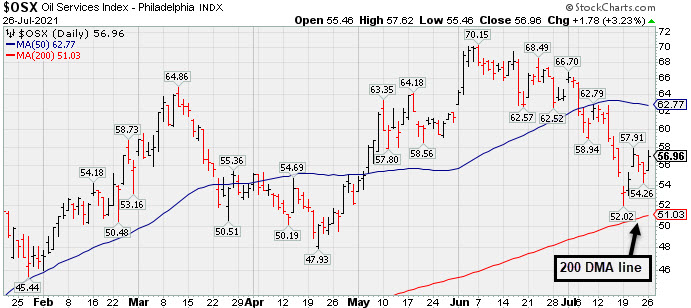
The Retail Index ($RLX +0.57%) rose and financial groups also had a positive influence on the major averages. The Broker/Dealer Index ($XBD +0.59%) and Bank Index ($BKX +0.86%) both posted gains. The tech sector was quiet as the Semiconductor Index ($SOX -0.09%) and Networking Index ($NWX +0.00%) finished flat, but the Biotech Index ($BTK -1.12%) lost ground. Meanwhile, commodity-linked groups had a positive bias as the Gold & Silver Index ($XAU +1.83%), Oil Services Index ($OSX +3.21%), and Integrated Oil Index ($XOI +2.38%) posted unanimous gains.
PICTURED: The Oil Services Index ($OSX +3.21%) posted a solid gain. Recently it slumped near its 200-day moving average (DMA) line.
| Oil Services |
$OSX |
56.95 |
+1.77 |
+3.21% |
+28.47% |
| Integrated Oil |
$XOI |
1,024.42 |
+23.85 |
+2.38% |
+29.27% |
| Semiconductor |
$SOX |
3,277.02 |
-3.04 |
-0.09% |
+17.22% |
| Networking |
$NWX |
847.77 |
+0.03 |
+0.00% |
+18.22% |
| Broker/Dealer |
$XBD |
460.85 |
+2.69 |
+0.59% |
+22.05% |
| Retail |
$RLX |
4,219.35 |
+24.10 |
+0.57% |
+18.41% |
| Gold & Silver |
$XAU |
138.12 |
+2.49 |
+1.83% |
-4.21% |
| Bank |
$BKX |
122.14 |
+1.04 |
+0.86% |
+24.75% |
| Biotech |
$BTK |
5,686.21 |
-64.51 |
-1.12% |
-0.92% |
|
|
|
 |
Powerful Volume-Driven Breakout After Earnings Report
Kenneth J. Gruneisen - Passed the CAN SLIM® Master's Exam
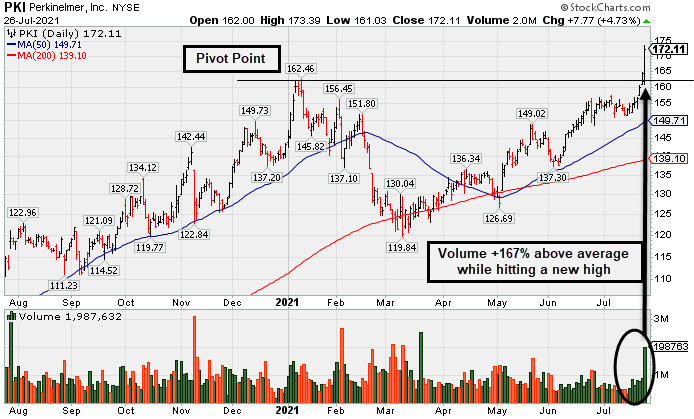
Perkinelmer Inc (PKI +$7.77 or +4.73% to $172.11) finished strong after highlighted in yellow with pivot point cited based on its 1/11/21 high plus 10 cents in the earlier mid-day report (read here) .It clinched a technical buy signal and hit a new all-time high (N criteria) with +186% above average volume behind today's 8th consecutive gain. Recently it had been wedging higher with gains lacking great volume conviction.
The high-ranked ELECTRONICS - Scientific and Technical Instruments firm showed bullish action after it reported earnings +80% on +51% sales revenues for the Jun '21 quarter versus the year ago period, its 6th strong quarterly comparison above the +25% minimum guideline (C criteria). Annual earnings (A criteria) history has improved steadily. It has a highest possible Earnings Per Share Rating of 99.
The number of top-rated funds owning its shares rose from 1,269 in Sep '20 to 1,501 in Jun '21, a reassuring sign concerning the I criteria. Its current Up/Down Volume Ratio of 2.0 is an unbiased indication its shares have been under accumulation over the past 50 days. It has a Timeliness Rating of A and Sponsorship Rating of B.
|
|
|
Color Codes Explained :
Y - Better candidates highlighted by our
staff of experts.
G - Previously featured
in past reports as yellow but may no longer be buyable under the
guidelines.
***Last / Change / Volume data in this table is the closing quote data***
Symbol/Exchange
Company Name
Industry Group |
PRICE |
CHANGE
(%Change) |
Day High |
Volume
(% DAV)
(% 50 day avg vol) |
52 Wk Hi
% From Hi |
Featured
Date |
Price
Featured |
Pivot Featured |
|
Max Buy |
 SIVB
-
NASDAQ
SIVB
-
NASDAQ
S V B Financial Group
BANKING - Regional - Pacific Banks
|
$564.96
|
-5.91
-1.04% |
$577.45
|
292,753
78.91% of 50 DAV
50 DAV is 371,000
|
$608.84
-7.21%
|
4/23/2021
|
$579.70
|
PP = $577.16
|
|
MB = $606.02
|
Most Recent Note - 7/20/2021 5:20:09 PM
G - Posted a big gain today but remains below its 50 DMA line ($568.47). Only a prompt rebound above the 50 DMA line would help its outlook improve.
>>> FEATURED STOCK ARTICLE : Consolidating Near 50-Day Average After Distributional Pressure - 6/25/2021 |
View all notes |
Set NEW NOTE alert |
Company Profile |
SEC
News |
Chart |
Request a new note
C
A
S
I |
LOGI
-
NASDAQ
Logitech Intl Sa
COMPUTER HARDWARE - Computer Peripherals
|
$120.87
|
+0.61
0.51% |
$122.26
|
1,285,060
170.66% of 50 DAV
50 DAV is 753,000
|
$140.17
-13.77%
|
5/26/2021
|
$119.13
|
PP = $120.34
|
|
MB = $126.36
|
 Most Recent Note - 7/26/2021 12:11:58 PM
G - Due to report Jun '21 quarterly results tonight. Volume and volatility often increase near earnings news. Meeting resistance after recently rebounding near its 50 DMA line ($122.65). A gain and strong close above the 50 DMA line would help its outlook improve.
>>> FEATURED STOCK ARTICLE : Recent Pullback is Testing Important Technical Support - 7/2/2021 |
View all notes |
Set NEW NOTE alert |
Company Profile |
SEC
News |
Chart |
Request a new note
C
A
S
I |
CROX
-
NASDAQ
Crocs Inc
CONSUMER NON-DURABLES - Textile - Apparel Footwear
|
$131.82
|
+0.53
0.40% |
$133.20
|
917,225
61.27% of 50 DAV
50 DAV is 1,497,000
|
$136.50
-3.43%
|
6/14/2021
|
$112.64
|
PP = $110.01
|
|
MB = $115.51
|
Most Recent Note - 7/22/2021 12:45:39 PM
G - Gapped up today for a 4th consecutive gain, powering into new all-time high territory, getting extended from any sound base. Found support at its 50 DMA line ($108.97).
>>> FEATURED STOCK ARTICLE : Quietly Consolidating Below "Max Buy" Level - 7/7/2021 |
View all notes |
Set NEW NOTE alert |
Company Profile |
SEC
News |
Chart |
Request a new note
C
A
S
I |
CRL
-
NYSE
Charles River Labs Intl
DRUGS - Biotechnology
|
$393.27
|
-3.05
-0.77% |
$397.51
|
203,862
31.75% of 50 DAV
50 DAV is 642,000
|
$397.61
-1.09%
|
6/9/2021
|
$345.91
|
PP = $349.23
|
|
MB = $366.69
|
Most Recent Note - 7/26/2021 5:08:10 PM
G - Recent volume totals have been below average while wedging into record high territory. Its 50 DMA line ($358) and prior high in the $349 area define near-term support to watch on pullbacks. Two of the past 3 quarterly comparisons through Mar '21 have been above the +25% minimum earnings guideline (C criteria).
>>> FEATURED STOCK ARTICLE : Volume Totals Cooling While Perched at High - 7/13/2021 |
View all notes |
Set NEW NOTE alert |
Company Profile |
SEC
News |
Chart |
Request a new note
C
A
S
I |
GNRC
-
NYSE
Generac Hldgs Inc
Electrical-Power/Equipmt
|
$444.65
|
-4.99
-1.11% |
$457.00
|
471,337
62.93% of 50 DAV
50 DAV is 749,000
|
$452.92
-1.83%
|
6/8/2021
|
$348.46
|
PP = $342.38
|
|
MB = $359.50
|
Most Recent Note - 7/21/2021 2:13:45 PM
G - Perched near its all-time high, very extended from the previously noted base. Its 50 DMA line ($368) and prior high ($364) define important near-term support to watch on pullbacks. Fundamentals remain strong.
>>> FEATURED STOCK ARTICLE : Gain for New High Leaves GNRC Very Extended From Prior Base - 7/12/2021 |
View all notes |
Set NEW NOTE alert |
Company Profile |
SEC
News |
Chart |
Request a new note
C
A
S
I |
Symbol/Exchange
Company Name
Industry Group |
PRICE |
CHANGE
(%Change) |
Day High |
Volume
(% DAV)
(% 50 day avg vol) |
52 Wk Hi
% From Hi |
Featured
Date |
Price
Featured |
Pivot Featured |
|
Max Buy |
CAMT
-
NASDAQ
Camtek Ltd
ELECTRONICS - Scientific and Technical Instrum
|
$35.26
|
+0.39
1.12% |
$35.92
|
118,733
44.47% of 50 DAV
50 DAV is 267,000
|
$40.47
-12.87%
|
4/28/2021
|
$35.03
|
PP = $35.34
|
|
MB = $37.11
|
Most Recent Note - 7/20/2021 5:23:45 PM
G - Rebounded near its 50 DMA line ($34.82) with light volume behind today's gain. Subsequent gains above the 50 DMA line would help its outlook improve.
>>> FEATURED STOCK ARTICLE : Loss With Light Volume Undercut 50-Day Moving Average - 7/8/2021 |
View all notes |
Set NEW NOTE alert |
Company Profile |
SEC
News |
Chart |
Request a new note
C
A
S
I |
PKI
-
NYSE
Perkinelmer Inc
ELECTRONICS - Scientific and Technical Instrum
|
$172.11
|
+7.77
4.73% |
$173.39
|
1,987,630
285.99% of 50 DAV
50 DAV is 695,000
|
$164.58
4.58%
|
7/26/2021
|
$168.06
|
PP = $162.80
|
|
MB = $170.94
|
Most Recent Note - 7/26/2021 5:06:18 PM
Y - Finished strong today after highlighted in yellow in the earlier mid-day report with pivot point cited based on its 1/11/21 high plus 10 cents . Hit a new all-time high with +186% above average volume behind today's 8th consecutive gain triggering a technical buy signal. Reported earnings +80% on +51% sales revenues for the Jun '21 quarter versus the year ago period, its 6th strong quarterly comparison above the +25% minimum guideline (C criteria). Annual earnings (A criteria) history has improved steadily. See the latest FSU report for more detailed analysis and a new annotated graph.
There are no Featured Stock Updates™ available for this stock at this time. You may request one by clicking the Request a New Note link below |
View all notes |
Set NEW NOTE alert |
Company Profile |
SEC
News |
Chart |
Request a new note
C
A
S
I |
ASML
-
NASDAQ
A S M L Holding N.V. NY
ELECTRONICS - Semiconductor Equipment and Mate
|
$754.09
|
+5.95
0.80% |
$759.00
|
690,334
91.31% of 50 DAV
50 DAV is 756,000
|
$756.78
-0.36%
|
5/25/2021
|
$669.59
|
PP = $675.75
|
|
MB = $709.54
|
Most Recent Note - 7/26/2021 12:00:31 PM
G - Rallying further above its "max buy" level and hitting new all-time highs with today's 5th consecutive volume-driven gain. Its 50 DMA line ($685) defines important near-term support to watch on pullbacks.
>>> FEATURED STOCK ARTICLE : Volume Higher While Pulling Back Toward 50-Day Moving Average - 7/1/2021 |
View all notes |
Set NEW NOTE alert |
Company Profile |
SEC
News |
Chart |
Request a new note
C
A
S
I |
LUNA
-
NASDAQ
Luna Innovations Inc
Medical-Research Eqp/Svc
|
$12.11
|
+0.66
5.76% |
$12.61
|
411,200
252.27% of 50 DAV
50 DAV is 163,000
|
$13.05
-7.20%
|
7/26/2021
|
$12.46
|
PP = $13.15
|
|
MB = $13.81
|
Most Recent Note - 7/26/2021 5:12:19 PM
Y - Color code was changed to yellow in the earlier mid-day report with pivot point cited based on its 3/12/21 high plus 10 cents. Finished in the middle of its intra-day range today with its 5th consecutive volume-driven gain. Rallied impressively from support at its 200 DMA line, nearly challenging its 52-week high. Subsequent gains above the pivot point backed by at least +40% above average volume may trigger a technical buy signal. Reported Mar '21 quarterly earnings +50% on +53% sales revenues versus the year ago period, its 4th strong quarterly comparison (C criteria). Annual earnings (A criteria) history has improved in recent years, helping it match with the fundamental guidelines of the fact-based investment system.
There are no Featured Stock Updates™ available for this stock at this time. You may request one by clicking the Request a New Note link below |
View all notes |
Set NEW NOTE alert |
Company Profile |
SEC
News |
Chart |
Request a new note
C
A
S
I |
CLFD
-
NASDAQ
Clearfield Inc
TELECOMMUNICATIONS - Cables / Satalite Equipment
|
$41.16
|
-2.02
-4.68% |
$45.36
|
279,781
233.15% of 50 DAV
50 DAV is 120,000
|
$43.64
-5.68%
|
7/23/2021
|
$40.23
|
PP = $43.74
|
|
MB = $45.93
|
Most Recent Note - 7/26/2021 12:03:27 PM
Y - Reversed into the red, encountering distributional pressure after its early gain today into new high territory. Finished strong on the prior session after highlighted in yellow with new pivot point cited based on its 6/07/21 high plus 10 cents. Gapped up rebounding above its 50 DMA line with heavy volume behind the gain helping its outlook to improve as it was noted - "Subsequent gains above the pivot point with volume may trigger a new (or add-on) technical buy signal. Fundamentals remain strong. Bullish action came after it reported Jun '21 quarterly earnings +100% on +49% sales revenues."
>>> FEATURED STOCK ARTICLE : Big Volume-Driven Gain Challenging Prior High After Earnings - 7/23/2021 |
View all notes |
Set NEW NOTE alert |
Company Profile |
SEC
News |
Chart |
Request a new note
C
A
S
I |
Symbol/Exchange
Company Name
Industry Group |
PRICE |
CHANGE
(%Change) |
Day High |
Volume
(% DAV)
(% 50 day avg vol) |
52 Wk Hi
% From Hi |
Featured
Date |
Price
Featured |
Pivot Featured |
|
Max Buy |
POOL
-
NASDAQ
Pool Corp
WHOLESALE - Basic Materials Wholesale
|
$466.96
|
+4.59
0.99% |
$476.12
|
330,871
124.67% of 50 DAV
50 DAV is 265,400
|
$478.67
-2.45%
|
6/21/2021
|
$455.09
|
PP = $449.54
|
|
MB = $472.02
|
Most Recent Note - 7/26/2021 12:31:18 PM
Y - Posting a 2nd consecutive gain today challenging its high after finding support at its 50 DMA line ($448) last week. Reported Jun '21 quarterly earnings +66% on +40% sales revenues versus the year ago period. Recent losses have tested prior highs in the $449-444 range and its 50 DMA line which define important support. More damaging losses would raise concerns and trigger a technical sell signal.
>>> FEATURED STOCK ARTICLE : Churned Heavy Volume While Testing 50-Day Moving Average - 7/22/2021 |
View all notes |
Set NEW NOTE alert |
Company Profile |
SEC
News |
Chart |
Request a new note
C
A
S
I |
FSBW
-
NASDAQ
F S Bancorp
Banks-West/Southwest
|
$35.91
|
+0.48
1.35% |
$36.14
|
27,798
92.66% of 50 DAV
50 DAV is 30,000
|
$36.85
-2.55%
|
5/18/2021
|
$35.08
|
PP = $36.85
|
|
MB = $38.69
|
Most Recent Note - 7/20/2021 5:16:51 PM
Y - Color code is changed to yellow after promptly rebounding above its 50 DMA line ($35.14) with today's big gain helping its outlook to improve. Subsequent gains above the pivot point backed by at least +40% above average volume are needed to trigger a technical buy signal. Do not be confused by a 2:1 stock split which impacted share prices as of 7/15/21 (Featured Price, Pivot Point, and Max Buy levels were updated accordingly).
>>> FEATURED STOCK ARTICLE : Still Consolidating With Close Striking Distance of All-Time High - 6/24/2021 |
View all notes |
Set NEW NOTE alert |
Company Profile |
SEC
News |
Chart |
Request a new note
C
A
S
I |
SMPL
-
NASDAQ
Simply Good Foods Co
Food-Confectionery
|
$37.59
|
-0.20
-0.53% |
$38.05
|
273,044
48.76% of 50 DAV
50 DAV is 560,000
|
$38.50
-2.36%
|
12/28/2020
|
$30.40
|
PP = $31.44
|
|
MB = $33.01
|
Most Recent Note - 7/20/2021 5:27:36 PM
G - Stubbornly holding its ground near its all-time high. Its 50 DMA line ($35.40) and prior highs in the $35 area define important near-term support to watch on pullbacks. Reported May '21 quarterly earnings +65% on +32% sales revenues versus the year ago period, well above the +25% minimum earnings guideline (C criteria).
>>> FEATURED STOCK ARTICLE : Pulled Back from High With Small Losses on Light Volume - 7/15/2021 |
View all notes |
Set NEW NOTE alert |
Company Profile |
SEC
News |
Chart |
Request a new note
C
A
S
I |
SHOP
-
NYSE
Shopify Inc Cl A
Computer Sftwr-Enterprse
|
$1,582.28
|
-61.04
-3.71% |
$1,650.00
|
1,424,789
101.77% of 50 DAV
50 DAV is 1,400,000
|
$1,650.00
-4.10%
|
7/2/2021
|
$1,468.00
|
PP = $1,552.23
|
|
MB = $1,629.84
|
Most Recent Note - 7/26/2021 12:37:19 PM
Y - Color code is changed to yellow after pulling back below its "max buy" level today following a streak of 6 consecutive gains. Its recent low and 50 DMA line ($1373) define near term support to watch.
>>> FEATURED STOCK ARTICLE : Managed a Positive Reversal After Early Weakness - 7/19/2021 |
View all notes |
Set NEW NOTE alert |
Company Profile |
SEC
News |
Chart |
Request a new note
C
A
S
I |
YETI
-
NYSE
Yeti Holdings Inc
Leisure-Products
|
$97.56
|
+0.22
0.23% |
$98.79
|
519,838
38.20% of 50 DAV
50 DAV is 1,361,000
|
$97.84
-0.29%
|
5/13/2021
|
$84.20
|
PP = $90.65
|
|
MB = $95.18
|
Most Recent Note - 7/23/2021 4:57:43 PM
G - Color code was changed to green after today's gain above its "max buy" level for a new high backed by average volume. Its 50 DMA line ($90) and recent low define important near-term support where more damaging losses would raise greater concerns. Fundamentals remain strong.
>>> FEATURED STOCK ARTICLE : Volume Totals Cooling While Consolidating Near High - 7/9/2021 |
View all notes |
Set NEW NOTE alert |
Company Profile |
SEC
News |
Chart |
Request a new note
C
A
S
I |
Symbol/Exchange
Company Name
Industry Group |
PRICE |
CHANGE
(%Change) |
Day High |
Volume
(% DAV)
(% 50 day avg vol) |
52 Wk Hi
% From Hi |
Featured
Date |
Price
Featured |
Pivot Featured |
|
Max Buy |
DOCU
-
NASDAQ
Docusign Inc
Computer Sftwr-Enterprse
|
$305.77
|
-2.73
-0.88% |
$308.29
|
1,381,979
45.64% of 50 DAV
50 DAV is 3,028,000
|
$310.51
-1.53%
|
7/6/2021
|
$288.96
|
PP = $290.33
|
|
MB = $304.85
|
Most Recent Note - 7/20/2021 11:54:17 AM
Y - Posting a 4th consecutive gain today and hitting a new all-time high. Wedging into new high territory with gains in recent weeks lacking great volume conviction. Highlighted in yellow with pivot point cited based on its 9/02/20 high plus 10 cents. A gain and strong close above the pivot point cited backed by at least +40% above average volume may trigger a convincing new (or add-on) technical buy signal. Fundamentals remain strong after reporting very strong Apr '21 quarterly results.
>>> FEATURED STOCK ARTICLE : Touched New High With Average Volume Behind Today's Gain - 7/6/2021 |
View all notes |
Set NEW NOTE alert |
Company Profile |
SEC
News |
Chart |
Request a new note
C
A
S
I |
XPEL
-
NASDAQ
Xpel Inc
Auto/Truck-Tires andamp; Misc
|
$95.34
|
-6.06
-5.98% |
$103.84
|
336,112
154.89% of 50 DAV
50 DAV is 217,000
|
$102.89
-7.34%
|
7/21/2021
|
$92.25
|
PP = $94.31
|
|
MB = $99.03
|
Most Recent Note - 7/26/2021 12:48:14 PM
Y - Color code is changed to yellow after pulling back from its all-time high and below its "max buy" level with today's loss after 5 consecutive gains. Rallied from a 6-week base noted as a riskier "late-stage" base after finding prompt support again at its 50 DMA line ($85.57). Reported Mar '21 quarterly earnings +317% on +83% sales revenues versus the year ago period, adding to its strong earnings track record.
>>> FEATURED STOCK ARTICLE : New Base Formed May Be "Late Stage" - 7/21/2021 |
View all notes |
Set NEW NOTE alert |
Company Profile |
SEC
News |
Chart |
Request a new note
C
A
S
I |
JEF
-
NYSE
Jefferies Financial Grp
Finance-Invest Bnk/Bkrs
|
$32.89
|
+0.37
1.14% |
$32.94
|
1,251,034
58.71% of 50 DAV
50 DAV is 2,131,000
|
$35.69
-7.85%
|
6/28/2021
|
$31.81
|
PP = $34.42
|
|
MB = $36.14
|
Most Recent Note - 7/26/2021 5:09:22 PM
Y - Found support when recently testing its 50 DMA line ($32.13). More damaging losses would raise concerns and trigger a technical sell signal. As previously noted - "Subsequent gains above the pivot point backed by at least +40% above average volume are necessary to trigger a technical buy signal."
>>> FEATURED STOCK ARTICLE : High-Ranked Financial Firm Formed "Double Bottom" Base - 6/28/2021 |
View all notes |
Set NEW NOTE alert |
Company Profile |
SEC
News |
Chart |
Request a new note
C
A
S
I |
CLAR
-
NASDAQ
Clarus Corporation
Leisure-Products
|
$28.57
|
+0.30
1.06% |
$28.63
|
120,538
53.57% of 50 DAV
50 DAV is 225,000
|
$28.86
-1.00%
|
5/12/2021
|
$21.40
|
PP = $19.73
|
|
MB = $20.72
|
Most Recent Note - 7/21/2021 12:38:42 PM
G - Hitting another new 52-week high today with a gain backed by above average volume. It did not form a sound base of sufficient length. Its 50 DMA line ($24.67) defines important near-term support to watch. See the latest FSU analysis for more details and an annotated graph.
>>> FEATURED STOCK ARTICLE : Extended From Prior Base and Hitting Another New High - 7/20/2021 |
View all notes |
Set NEW NOTE alert |
Company Profile |
SEC
News |
Chart |
Request a new note
C
A
S
I |
AVTR
-
NYSE
Avantor Inc
Medical-Research Eqp/Svc
|
$36.87
|
-0.31
-0.83% |
$37.26
|
2,064,471
54.37% of 50 DAV
50 DAV is 3,797,000
|
$37.50
-1.68%
|
6/10/2021
|
$32.94
|
PP = $34.09
|
|
MB = $35.79
|
Most Recent Note - 7/20/2021 5:21:50 PM
G - Posted a solid gain today for a new all-time high. Prior highs in the $33 area coincide with its 50 DMA line defining important support to watch on pullbacks.
>>> FEATURED STOCK ARTICLE : Held Ground But Made Little Price Progress Since Featured - 7/14/2021 |
View all notes |
Set NEW NOTE alert |
Company Profile |
SEC
News |
Chart |
Request a new note
C
A
S
I |
Symbol/Exchange
Company Name
Industry Group |
PRICE |
CHANGE
(%Change) |
Day High |
Volume
(% DAV)
(% 50 day avg vol) |
52 Wk Hi
% From Hi |
Featured
Date |
Price
Featured |
Pivot Featured |
|
Max Buy |
|
|
|
THESE ARE NOT BUY RECOMMENDATIONS!
Comments contained in the body of this report are technical
opinions only. The material herein has been obtained
from sources believed to be reliable and accurate, however,
its accuracy and completeness cannot be guaranteed.
This site is not an investment advisor, hence it does
not endorse or recommend any securities or other investments.
Any recommendation contained in this report may not
be suitable for all investors and it is not to be deemed
an offer or solicitation on our part with respect to
the purchase or sale of any securities. All trademarks,
service marks and trade names appearing in this report
are the property of their respective owners, and are
likewise used for identification purposes only.
This report is a service available
only to active Paid Premium Members.
You may opt-out of receiving report notifications
at any time. Questions or comments may be submitted
by writing to Premium Membership Services 665 S.E. 10 Street, Suite 201 Deerfield Beach, FL 33441-5634 or by calling 1-800-965-8307
or 954-785-1121.
|
|
|