You are not logged in.
This means you
CAN ONLY VIEW reports that were published prior to Saturday, February 1, 2025.
You
MUST UPGRADE YOUR MEMBERSHIP if you want to see any current reports.
AFTER MARKET UPDATE - THURSDAY, JULY 15TH, 2021
Previous After Market Report Next After Market Report >>>
|
|
|
|
DOW |
+53.79 |
34,987.02 |
+0.15% |
|
Volume |
858,932,763 |
-1% |
|
Volume |
4,456,073,300 |
+1% |
|
NASDAQ |
-104.39 |
14,540.57 |
-0.71% |
|
Advancers |
1,242 |
39% |
|
Advancers |
1,694 |
41% |
|
S&P 500 |
-14.27 |
4,360.03 |
-0.33% |
|
Decliners |
1,971 |
61% |
|
Decliners |
2,487 |
59% |
|
Russell 2000 |
-12.07 |
2,190.29 |
-0.55% |
|
52 Wk Highs |
87 |
|
|
52 Wk Highs |
50 |
|
|
S&P 600 |
-7.06 |
1,316.23 |
-0.53% |
|
52 Wk Lows |
39 |
|
|
52 Wk Lows |
182 |
|
|
 |
Leadership Thinned as Major Indices Ended Mixed
Kenneth J. Gruneisen - Passed the CAN SLIM® Master's Exam
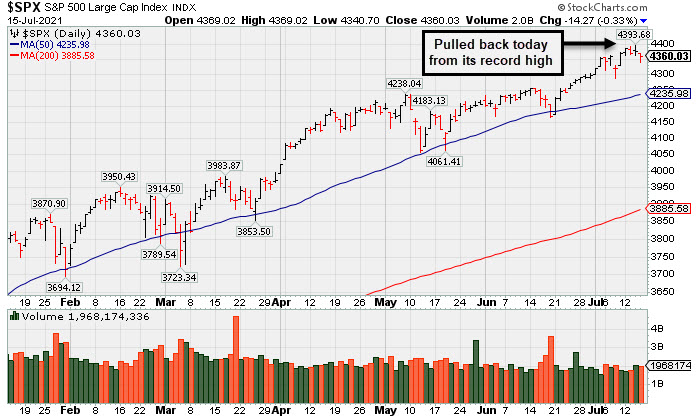
The Dow added 53 points, closing within striking distance of Monday’s record level. The S&P 500 fell 0.3%, while the Nasdaq Composite slid 0.7% amid weakness in tech and growth-oriented shares. The volume totals reported were mixed, just lighter than the prior session on the NYSE and slightly higher on the Nasdaq exchange. Breadth was negative as decliners led advancers by a 3-2 margin on the NYSE and on the Nasdaq exchange. There were 16 high-ranked companies from the Leaders List that hit new 52-week highs and were listed on the BreakOuts Page, versus 25 on the prior session. New 52-week highs totals contracted yet still outnumbered new 52-week lows on the NYSE, but new lows outnumbered new highs on the Nasdaq exchange for the 2nd consecutive session. The major indices (M criteria) are in an uptrend. Investors are reminded to always make buying and selling decisions on case-by-case basis under the strict criteria and rules of the fact-based investment system.
PICTURED: The S&P 500 Index pulled back from its record high.
U.S. stocks fluctuated on Thursday as investors digested a flurry of economic releases and assessed commentary from Federal Reserve Chair Jerome Powell. The Fed chief reiterated yesterday’s perceived “dovish” message during his second day of Congressional testimony, and said officials are monitoring inflationary pressures which should prove to be temporary.
On the data front, initial jobless claims came in at a fresh pandemic low of 360,000 last week. Separately, industrial production rose a smaller-than-forecasted 0.4% last month, while manufacturing production unexpectedly declined. Overseas, China’s second-quarter GDP report showed economic growth slowed, fueling worries surrounding peak growth. Still, Chinese retail sales and industrial production in June both surpassed expectations. Treasuries fluctuated, with the yield curve flattening. The 10-year note rate fell five basis points to 1.30%, while the two-year note yield rose one basis point to 0.23%.
Six of 11 S&P 500 sectors ended in positive territory, with the traditionally defensive groups outperforming. Shares of mega-cap companies weighed on the benchmark, with the oft-cited FAANG cohort falling more than 1%. Energy also lagged as a stronger dollar and prospects that OPEC+ will hike production sent WTI crude 2.1% lower to $71.59/barrel. In corporate news, American International Group (AIG +3.58%) rose after agreeing to sell 9.9% of its life and retirement business to Blackstone Group Inc (BX+3.90%) for $2.2 billion. Meanwhile, Biogen (BIIB -6.79%) slumped after major hospital systems and some insurers pushed back on the biotech’s Alzheimer’s drug. |
 Kenneth J. Gruneisen started out as a licensed stockbroker in August 1987, a couple of months prior to the historic stock market crash that took the Dow Jones Industrial Average down -22.6% in a single day. He has published daily fact-based fundamental and technical analysis on high-ranked stocks online for two decades. Through FACTBASEDINVESTING.COM, Kenneth provides educational articles, news, market commentary, and other information regarding proven investment systems that work in good times and bad.
Comments contained in the body of this report are technical opinions only and are not necessarily those of Gruneisen Growth Corp. The material herein has been obtained from sources believed to be reliable and accurate, however, its accuracy and completeness cannot be guaranteed. Our firm, employees, and customers may effect transactions, including transactions contrary to any recommendation herein, or have positions in the securities mentioned herein or options with respect thereto. Any recommendation contained in this report may not be suitable for all investors and it is not to be deemed an offer or solicitation on our part with respect to the purchase or sale of any securities. |
|
 |
Bank, Biotech, and Gold & Silver Indexes Rose
Kenneth J. Gruneisen - Passed the CAN SLIM® Master's Exam
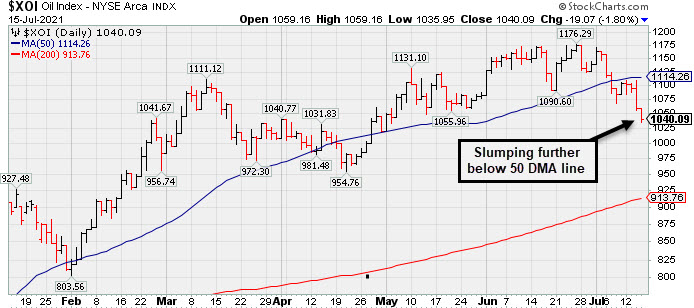
The Bank Index ($BKX +0.70%) posted a modest gain while the Broker/Dealer Index ($XBD -0.27%) and Retail Index ($RLX -0.65%) both lost ground and weighed on the major averages. The tech sector had a negative bias as the Semiconductor Index ($SOX -2.20%) Networking Index ($NWX -1.28%) both lost ground while the Biotech Index ($BTK +0.21%) eked out a small gain. Commodity-linked groups were mixed as the Oil Services Index ($OSX -3.58%) and Integrated Oil Index ($XOI -1.80%) both lost ground while the Gold & Silver Index ($XAU +0.75%) edged higher.
PICTURED: The Integrated Oil Index ($XOI -1.80%) is slumping further below its 50-day moving average (DMA) line.
| Oil Services |
$OSX |
56.84 |
-2.11 |
-3.58% |
+28.22% |
| Integrated Oil |
$XOI |
1,040.09 |
-19.07 |
-1.80% |
+31.24% |
| Semiconductor |
$SOX |
3,216.87 |
-72.31 |
-2.20% |
+15.07% |
| Networking |
$NWX |
846.14 |
-10.98 |
-1.28% |
+17.99% |
| Broker/Dealer |
$XBD |
458.95 |
-1.24 |
-0.27% |
+21.54% |
| Retail |
$RLX |
4,130.25 |
-26.91 |
-0.65% |
+15.91% |
| Gold & Silver |
$XAU |
142.50 |
+1.06 |
+0.75% |
-1.17% |
| Bank |
$BKX |
124.34 |
+0.87 |
+0.70% |
+26.99% |
| Biotech |
$BTK |
5,722.69 |
+12.19 |
+0.21% |
-0.28% |
|
|
|
 |
Pulled Back from High With Small Losses on Light Volume
Kenneth J. Gruneisen - Passed the CAN SLIM® Master's Exam
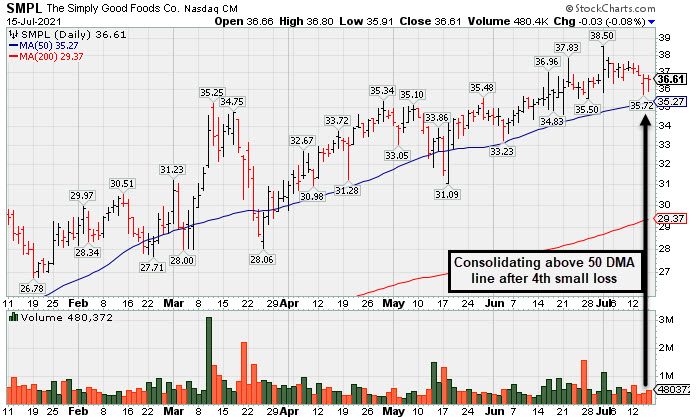
Simply Good Foods Co (SMPL +$0.04 or +0.11% to $36.68) pulled back today for a 4th consecutive small loss. Volume totals have been cooling after hitting a new all-time high on 7/01/21. Prior highs in the $35 area define near-term support to watch along with its 50-day moving average (DMA) line ($35.27).
Recently it reported May '21 quarterly earnings +65% on +32% sales revenues versus the year ago period, well above the +25% minimum earnings guideline (C criteria). In 4 of the past 6 quarterly comparisons earnings were above the +25% minimum guideline (C criteria). Its annual earnings history (A criteria) has been strong. It currently has a 92 Earnings Per Share Rating.
Its current Relative Strength Rating is 85, above the 80+ minimum guideline for buy candidates. SMPL completed a new Pubic Offering on 10/09/19. The company has a Timeliness Rating of A and Sponsorship Rating of D. The number of top-rated funds owning its shares rose from 357 in Dec '20 to 386 in Jun '21. Its current Up/Down Volume Ratio of 1.6 is an unbiased indication its shares have been under slight accumulation over the past 50 days.
SMPL was last shown in this FSU section on 6/14/21 with an annotated graph included under the headline, "Simply Wedging Into New High Territory". It was first highlighted in yellow with pivot point cited based on its 9/09/19 high plus 10 cents in the 12/28/20 mid-day report (read here).
Some leadership has been provided by other companies in the Food/Beverage Sector, however, the Food-Confectionery industry group has a Group Relative Strength Rating of 67 (B) which is a concern regarding the L criteria. There are only 5 companies listed in the group.
|
|
|
Color Codes Explained :
Y - Better candidates highlighted by our
staff of experts.
G - Previously featured
in past reports as yellow but may no longer be buyable under the
guidelines.
***Last / Change / Volume data in this table is the closing quote data***
Symbol/Exchange
Company Name
Industry Group |
PRICE |
CHANGE
(%Change) |
Day High |
Volume
(% DAV)
(% 50 day avg vol) |
52 Wk Hi
% From Hi |
Featured
Date |
Price
Featured |
Pivot Featured |
|
Max Buy |
 SIVB
-
NASDAQ
SIVB
-
NASDAQ
S V B Financial Group
BANKING - Regional - Pacific Banks
|
$580.73
|
+0.50
0.09% |
$591.37
|
389,698
102.82% of 50 DAV
50 DAV is 379,000
|
$608.84
-4.62%
|
4/23/2021
|
$579.70
|
PP = $577.16
|
|
MB = $606.02
|
Most Recent Note - 7/12/2021 1:00:49 PM
Y - With today's 2nd consecutive big gain it has rebounded above its 50 DMA line ($569.40) to nearly challenge its 52-week high and little resistance remains. Previously noted - "Confirming gains above the pivot point backed by at least +40% above average volume are still needed to help clinch a convincing technical buy signal. Reported earnings +293% on +64% sales revenues for the Mar '21 quarter versus the year ago period, its 3rd strong comparison. Completed a new Public Offering on 3/24/21."
>>> FEATURED STOCK ARTICLE : Consolidating Near 50-Day Average After Distributional Pressure - 6/25/2021 |
View all notes |
Set NEW NOTE alert |
Company Profile |
SEC
News |
Chart |
Request a new note
C
A
S
I |
LOGI
-
NASDAQ
Logitech Intl Sa
COMPUTER HARDWARE - Computer Peripherals
|
$119.52
|
-1.61
-1.33% |
$121.37
|
592,415
74.80% of 50 DAV
50 DAV is 792,000
|
$140.17
-14.73%
|
5/26/2021
|
$119.13
|
PP = $120.34
|
|
MB = $126.36
|
Most Recent Note - 7/13/2021 5:31:44 PM
Y - Color code is changed to yellow after today's 4th consecutive small loss with below average volume, consolidating below its "max buy" level. Retesting near prior highs in the $120-117 area which define important support to watch along with its 50 DMA line ($120.61).
>>> FEATURED STOCK ARTICLE : Recent Pullback is Testing Important Technical Support - 7/2/2021 |
View all notes |
Set NEW NOTE alert |
Company Profile |
SEC
News |
Chart |
Request a new note
C
A
S
I |
CROX
-
NASDAQ
Crocs Inc
CONSUMER NON-DURABLES - Textile - Apparel Footwear
|
$115.72
|
-0.90
-0.77% |
$117.50
|
1,262,104
85.28% of 50 DAV
50 DAV is 1,480,000
|
$120.92
-4.30%
|
6/14/2021
|
$112.64
|
PP = $110.01
|
|
MB = $115.51
|
Most Recent Note - 7/14/2021 4:52:10 PM
G - There was a "negative reversal" today after touching a new all-time high above its "max buy" level. Its 50 DMA line ($107.57) defines important support to watch on pullbacks.
>>> FEATURED STOCK ARTICLE : Quietly Consolidating Below "Max Buy" Level - 7/7/2021 |
View all notes |
Set NEW NOTE alert |
Company Profile |
SEC
News |
Chart |
Request a new note
C
A
S
I |
CRL
-
NYSE
Charles River Labs Intl
DRUGS - Biotechnology
|
$382.15
|
-0.14
-0.04% |
$383.57
|
206,385
29.78% of 50 DAV
50 DAV is 693,000
|
$386.57
-1.14%
|
6/9/2021
|
$345.91
|
PP = $349.23
|
|
MB = $366.69
|
Most Recent Note - 7/13/2021 5:26:46 PM
G - Volume totals have been cooling. Below average volume was behind recent gains as it wedged into record high territory. Prior highs in the $349 area and its 50 DMA line ($348) define near-term support to watch on pullbacks. Two of the past 3 quarterly comparisons through Mar '21 have been above the +25% minimum earnings guideline (C criteria). See the latest FSU analysis for more details and a new annotated graph.
>>> FEATURED STOCK ARTICLE : Volume Totals Cooling While Perched at High - 7/13/2021 |
View all notes |
Set NEW NOTE alert |
Company Profile |
SEC
News |
Chart |
Request a new note
C
A
S
I |
GNRC
-
NYSE
Generac Hldgs Inc
Electrical-Power/Equipmt
|
$432.86
|
-3.87
-0.89% |
$442.69
|
802,438
105.03% of 50 DAV
50 DAV is 764,000
|
$452.92
-4.43%
|
6/8/2021
|
$348.46
|
PP = $342.38
|
|
MB = $359.50
|
Most Recent Note - 7/14/2021 4:01:32 PM
G - Volume was lighter today as it pulled back from its all-time high. Very extended from the previously noted base. Prior high ($364) and its 50 DMA line ($356.67) defines support to watch on pullbacks. Fundamentals remain strong.
>>> FEATURED STOCK ARTICLE : Gain for New High Leaves GNRC Very Extended From Prior Base - 7/12/2021 |
View all notes |
Set NEW NOTE alert |
Company Profile |
SEC
News |
Chart |
Request a new note
C
A
S
I |
Symbol/Exchange
Company Name
Industry Group |
PRICE |
CHANGE
(%Change) |
Day High |
Volume
(% DAV)
(% 50 day avg vol) |
52 Wk Hi
% From Hi |
Featured
Date |
Price
Featured |
Pivot Featured |
|
Max Buy |
CAMT
-
NASDAQ
Camtek Ltd
ELECTRONICS - Scientific and Technical Instrum
|
$34.74
|
+0.27
0.78% |
$35.66
|
287,667
97.18% of 50 DAV
50 DAV is 296,000
|
$40.47
-14.16%
|
4/28/2021
|
$35.03
|
PP = $35.34
|
|
MB = $37.11
|
Most Recent Note - 7/14/2021 3:58:17 PM
Y - Pulling back today with below average volume but retesting support near its 50 DMA line ($34.57). More damaging losses would raise greater concerns and trigger a technical sell signal.
>>> FEATURED STOCK ARTICLE : Loss With Light Volume Undercut 50-Day Moving Average - 7/8/2021 |
View all notes |
Set NEW NOTE alert |
Company Profile |
SEC
News |
Chart |
Request a new note
C
A
S
I |
ASML
-
NASDAQ
A S M L Holding N.V. NY
ELECTRONICS - Semiconductor Equipment and Mate
|
$703.94
|
-12.57
-1.75% |
$713.27
|
728,729
95.76% of 50 DAV
50 DAV is 761,000
|
$723.01
-2.64%
|
5/25/2021
|
$669.59
|
PP = $675.75
|
|
MB = $709.54
|
Most Recent Note - 7/14/2021 12:08:15 PM
Y - Gapped up today and hit a new all-time high. Recently tested its 50 DMA line ($672) which defines important near-term support. More damaging losses would raise concerns and trigger technical sell signals.
>>> FEATURED STOCK ARTICLE : Volume Higher While Pulling Back Toward 50-Day Moving Average - 7/1/2021 |
View all notes |
Set NEW NOTE alert |
Company Profile |
SEC
News |
Chart |
Request a new note
C
A
S
I |
MED
-
NYSE
Medifast Inc
SPECIALTY RETAIL - Specialty Retail, Other
|
$273.60
|
+5.52
2.06% |
$273.77
|
63,424
51.99% of 50 DAV
50 DAV is 122,000
|
$336.99
-18.81%
|
5/11/2021
|
$285.72
|
PP = $279.56
|
|
MB = $293.54
|
 Most Recent Note - 7/15/2021 4:52:56 PM
G - Posted a gain today with light volume. A rebound above its 50 DMA line ($292) is needed for its outlook to improve. More damaging losses below the prior low ($258.77 on 6/17/21) would raise greater concerns and trigger a worrisome technical sell signal.
>>> FEATURED STOCK ARTICLE : Halted 10-Session Losing Streak Near Prior High and 50 DMA - 6/15/2021 |
View all notes |
Set NEW NOTE alert |
Company Profile |
SEC
News |
Chart |
Request a new note
C
A
S
I |
CLFD
-
NASDAQ
Clearfield Inc
TELECOMMUNICATIONS - Cables / Satalite Equipment
|
$35.23
|
-0.90
-2.49% |
$35.88
|
59,896
52.08% of 50 DAV
50 DAV is 115,000
|
$43.64
-19.27%
|
6/4/2021
|
$40.01
|
PP = $40.36
|
|
MB = $42.38
|
Most Recent Note - 7/15/2021 4:51:27 PM
G - Gapped down raising concerns while sinking further below its 50 DMA line ($37.16) with today's 4th consecutive loss on light volume. Faces some resistance due to overhead supply up to the $43 level. Fundamentals remain strong.
>>> FEATURED STOCK ARTICLE : Consolidating Above 50-Day Moving Average Helped Outlook - 6/30/2021 |
View all notes |
Set NEW NOTE alert |
Company Profile |
SEC
News |
Chart |
Request a new note
C
A
S
I |
POOL
-
NASDAQ
Pool Corp
WHOLESALE - Basic Materials Wholesale
|
$459.82
|
-8.95
-1.91% |
$468.27
|
249,024
99.61% of 50 DAV
50 DAV is 250,000
|
$478.67
-3.94%
|
6/21/2021
|
$455.09
|
PP = $449.54
|
|
MB = $472.02
|
Most Recent Note - 7/12/2021 5:22:57 PM
G - Perched at its 52-week high and its color code is changed to green after getting extended from the latest base. Prior highs in the $449-444 range define initial support to watch above its 50 DMA line ($442) on pullbacks.
>>> FEATURED STOCK ARTICLE : Volume-Driven Breakout After Orderly Consolidation - 6/21/2021 |
View all notes |
Set NEW NOTE alert |
Company Profile |
SEC
News |
Chart |
Request a new note
C
A
S
I |
Symbol/Exchange
Company Name
Industry Group |
PRICE |
CHANGE
(%Change) |
Day High |
Volume
(% DAV)
(% 50 day avg vol) |
52 Wk Hi
% From Hi |
Featured
Date |
Price
Featured |
Pivot Featured |
|
Max Buy |
FSBW
-
NASDAQ
F S Bancorp
Banks-West/Southwest
|
$35.84
|
+0.35
0.97% |
$36.85
|
26,718
89.06% of 50 DAV
50 DAV is 30,000
|
$36.81
-2.64%
|
5/18/2021
|
$70.16
|
PP = $73.72
|
|
MB = $77.41
|
Most Recent Note - 7/12/2021 12:47:52 PM
Y - Still perched within striking distance of the pivot point cited based on its 3/08/21 high plus 10 cents. Near its 50 DMA line ($70.14) it has found prompt support during its ongoing ascent. Subsequent gains above the pivot point backed by at least +40% above average volume are needed to trigger a technical buy signal.
>>> FEATURED STOCK ARTICLE : Still Consolidating With Close Striking Distance of All-Time High - 6/24/2021 |
View all notes |
Set NEW NOTE alert |
Company Profile |
SEC
News |
Chart |
Request a new note
C
A
S
I |
SMPL
-
NASDAQ
Simply Good Foods Co
Food-Confectionery
|
$36.61
|
-0.03
-0.08% |
$36.80
|
480,372
87.02% of 50 DAV
50 DAV is 552,000
|
$38.50
-4.91%
|
12/28/2020
|
$30.40
|
PP = $31.44
|
|
MB = $33.01
|
Most Recent Note - 7/15/2021 4:49:29 PM
G - Pulled back today for a 4th consecutive small loss. Volume totals have been cooling after hitting a new all-time high on 7/01/21. Prior highs in the $35 area define near-term support to watch along with its 50 DMA line ($35.27). Reported May '21 quarterly earnings +65% on +32% sales revenues versus the year ago period, well above the +25% minimum earnings guideline (C criteria). See the latest FSU analysis for more details and a new annotated graph.
>>> FEATURED STOCK ARTICLE : Pulled Back from High With Small Losses on Light Volume - 7/15/2021 |
View all notes |
Set NEW NOTE alert |
Company Profile |
SEC
News |
Chart |
Request a new note
C
A
S
I |
SHOP
-
NYSE
Shopify Inc Cl A
Computer Sftwr-Enterprse
|
$1,441.50
|
-21.50
-1.47% |
$1,481.11
|
1,164,017
81.06% of 50 DAV
50 DAV is 1,436,000
|
$1,587.74
-9.21%
|
7/2/2021
|
$1,468.00
|
PP = $1,552.23
|
|
MB = $1,629.84
|
Most Recent Note - 7/14/2021 3:52:26 PM
Y - Reversed into the red today after early gains and a "negative reversal" was noted on 7/07/21 after hitting a new high. A new pivot point was recently cited based on its 6/21/21 high while building on a cup-with-high-handle base. Confirming gains with at least +40% above average volume for new highs would trigger a new (or add-on) technical buy signal and be a reassuring sign of fresh institutional buying demand.
>>> FEATURED STOCK ARTICLE : Rebounding After Choppy 4-Month Consolidation - 6/16/2021 |
View all notes |
Set NEW NOTE alert |
Company Profile |
SEC
News |
Chart |
Request a new note
C
A
S
I |
YETI
-
NYSE
Yeti Holdings Inc
Leisure-Products
|
$90.19
|
-0.81
-0.89% |
$90.99
|
601,825
41.25% of 50 DAV
50 DAV is 1,459,000
|
$96.62
-6.65%
|
5/13/2021
|
$84.20
|
PP = $90.65
|
|
MB = $95.18
|
Most Recent Note - 7/14/2021 3:56:46 PM
Y - Reversed into the red after today's early gain touched a new 52-week high. The 50 DMA line ($89.42) and prior low ($85.08 on 6/18/21) define near-term support to watch on pullbacks. Fundamentals remain strong.
>>> FEATURED STOCK ARTICLE : Volume Totals Cooling While Consolidating Near High - 7/9/2021 |
View all notes |
Set NEW NOTE alert |
Company Profile |
SEC
News |
Chart |
Request a new note
C
A
S
I |
DOCU
-
NASDAQ
Docusign Inc
Computer Sftwr-Enterprse
|
$277.01
|
+1.58
0.57% |
$279.74
|
3,510,195
111.36% of 50 DAV
50 DAV is 3,152,100
|
$298.75
-7.28%
|
7/6/2021
|
$288.96
|
PP = $290.33
|
|
MB = $304.85
|
Most Recent Note - 7/14/2021 3:59:10 PM
Y - Pulling back today for a 2nd consecutive loss with lighter volume after wedging into new high territory with gains in recent weeks lacking great volume conviction. Highlighted in yellow with pivot point cited based on its 9/02/20 high plus 10 cents. A gain and strong close above the pivot point cited backed by at least +40% above average volume may trigger a convincing new (or add-on) technical buy signal. Fundamentals remain strong after reporting very strong Apr '21 quarterly results.
>>> FEATURED STOCK ARTICLE : Touched New High With Average Volume Behind Today's Gain - 7/6/2021 |
View all notes |
Set NEW NOTE alert |
Company Profile |
SEC
News |
Chart |
Request a new note
C
A
S
I |
Symbol/Exchange
Company Name
Industry Group |
PRICE |
CHANGE
(%Change) |
Day High |
Volume
(% DAV)
(% 50 day avg vol) |
52 Wk Hi
% From Hi |
Featured
Date |
Price
Featured |
Pivot Featured |
|
Max Buy |
JEF
-
NYSE
Jefferies Financial Grp
Finance-Invest Bnk/Bkrs
|
$33.97
|
+0.33
0.98% |
$34.07
|
2,778,559
127.69% of 50 DAV
50 DAV is 2,176,000
|
$35.69
-4.82%
|
6/28/2021
|
$31.81
|
PP = $34.42
|
|
MB = $36.14
|
Most Recent Note - 7/14/2021 12:15:35 PM
Y - Color code is changed to yellow after a gap up today and big volume-driven gain. Prompt rebound above the 50 DMA line ($32.06) helped its outlook improve. As previously noted - "Subsequent gains above the pivot point backed by at least +40% above average volume are necessary to trigger a technical buy signal."
>>> FEATURED STOCK ARTICLE : High-Ranked Financial Firm Formed "Double Bottom" Base - 6/28/2021 |
View all notes |
Set NEW NOTE alert |
Company Profile |
SEC
News |
Chart |
Request a new note
C
A
S
I |
CLAR
-
NASDAQ
Clarus Corporation
Leisure-Products
|
$28.03
|
+0.09
0.32% |
$28.18
|
201,341
89.88% of 50 DAV
50 DAV is 224,000
|
$28.21
-0.64%
|
5/12/2021
|
$21.40
|
PP = $19.73
|
|
MB = $20.72
|
Most Recent Note - 7/12/2021 5:20:49 PM
G - Posted a big gain with below average volume and hit a new 52-week high today. It did not form a sound base of sufficient length. Its 50 DMA line ($23.46) defines important near-term support to watch.
>>> FEATURED STOCK ARTICLE : Encountering Distributional Pressure After Recent Rally - 6/17/2021 |
View all notes |
Set NEW NOTE alert |
Company Profile |
SEC
News |
Chart |
Request a new note
C
A
S
I |
AVTR
-
NYSE
Avantor Inc
Medical-Research Eqp/Svc
|
$36.31
|
+0.27
0.75% |
$36.52
|
2,582,993
65.86% of 50 DAV
50 DAV is 3,922,000
|
$36.50
-0.52%
|
6/10/2021
|
$32.94
|
PP = $34.09
|
|
MB = $35.79
|
Most Recent Note - 7/14/2021 4:32:50 PM
G - Stubbornly holding its ground but making little progress since triggering a technical buy signal. Prior highs in the $33 area coincide with its 50 DMA line defining important support to watch on pullbacks.
>>> FEATURED STOCK ARTICLE : Held Ground But Made Little Price Progress Since Featured - 7/14/2021 |
View all notes |
Set NEW NOTE alert |
Company Profile |
SEC
News |
Chart |
Request a new note
C
A
S
I |
|
|
|
THESE ARE NOT BUY RECOMMENDATIONS!
Comments contained in the body of this report are technical
opinions only. The material herein has been obtained
from sources believed to be reliable and accurate, however,
its accuracy and completeness cannot be guaranteed.
This site is not an investment advisor, hence it does
not endorse or recommend any securities or other investments.
Any recommendation contained in this report may not
be suitable for all investors and it is not to be deemed
an offer or solicitation on our part with respect to
the purchase or sale of any securities. All trademarks,
service marks and trade names appearing in this report
are the property of their respective owners, and are
likewise used for identification purposes only.
This report is a service available
only to active Paid Premium Members.
You may opt-out of receiving report notifications
at any time. Questions or comments may be submitted
by writing to Premium Membership Services 665 S.E. 10 Street, Suite 201 Deerfield Beach, FL 33441-5634 or by calling 1-800-965-8307
or 954-785-1121.
|
|
|