***Last / Change / Volume data in this table is the closing quote data***
Symbol/Exchange
Company Name
Industry Group |
PRICE |
CHANGE
(%Change) |
Day High |
Volume
(% DAV)
(% 50 day avg vol) |
52 Wk Hi
% From Hi |
Featured
Date |
Price
Featured |
Pivot Featured |
|
Max Buy |
 ABCB
-
NASDAQ
ABCB
-
NASDAQ
Ameris Bancorp
BANKING - Regional - Mid-Atlantic Banks
|
$51.32
|
+0.69
1.36% |
$51.62
|
266,147
60.63% of 50 DAV
50 DAV is 439,000
|
$59.85
-14.25%
|
5/21/2021
|
$58.86
|
PP = $57.91
|
|
MB = $60.81
|
Most Recent Note - 6/29/2021 5:08:13 PM
G - Still sputtering after last week's damaging losses triggered a worrisome technical sell signal. A rebound above the 50 DMA line (54.26) is needed for its outlook to improve. See the latest FSU analysis for more details and a new annotated graph.
>>> FEATURED STOCK ARTICLE : Still Sputtering After Damaging Losses Triggered Sell Signal - 6/29/2021 |
View all notes |
Set NEW NOTE alert |
Company Profile |
SEC
News |
Chart |
Request a new note
C
A
S
I |
SIVB
-
NASDAQ
S V B Financial Group
BANKING - Regional - Pacific Banks
|
$564.88
|
+8.45
1.52% |
$569.43
|
544,718
138.96% of 50 DAV
50 DAV is 392,000
|
$608.84
-7.22%
|
4/23/2021
|
$579.70
|
PP = $577.16
|
|
MB = $606.02
|
 Most Recent Note - 7/1/2021 4:34:31 PM
G - Consolidating near its 50 DMA line ($569.74). Confirming gains above the pivot point backed by at least +40% above average volume are still needed to help clinch a convincing technical buy signal. Reported earnings +293% on +64% sales revenues for the Mar '21 quarter versus the year ago period, its 3rd strong comparison. Completed a new Public Offering on 3/24/21.
>>> FEATURED STOCK ARTICLE : Consolidating Near 50-Day Average After Distributional Pressure - 6/25/2021 |
View all notes |
Set NEW NOTE alert |
Company Profile |
SEC
News |
Chart |
Request a new note
C
A
S
I |
LOGI
-
NASDAQ
Logitech Intl Sa
COMPUTER HARDWARE - Computer Peripherals
|
$120.30
|
-0.62
-0.51% |
$121.04
|
403,663
47.32% of 50 DAV
50 DAV is 853,000
|
$140.17
-14.18%
|
5/26/2021
|
$119.13
|
PP = $120.34
|
|
MB = $126.36
|
Most Recent Note - 7/1/2021 4:33:33 PM
Y - Volume totals have been cooling while slumping near prior highs in the $120-117 area which define important support to watch along with its 50 DMA line ($119).
>>> FEATURED STOCK ARTICLE : Streak of Gains to New Highs Lacked Great Volume Conviction - 5/27/2021 |
View all notes |
Set NEW NOTE alert |
Company Profile |
SEC
News |
Chart |
Request a new note
C
A
S
I |
CROX
-
NASDAQ
Crocs Inc
CONSUMER NON-DURABLES - Textile - Apparel Footwear
|
$117.00
|
+0.48
0.41% |
$118.68
|
1,295,276
72.12% of 50 DAV
50 DAV is 1,796,000
|
$117.98
-0.83%
|
6/14/2021
|
$112.64
|
PP = $110.01
|
|
MB = $115.51
|
Most Recent Note - 6/28/2021 5:13:08 PM
Y - Posted a 6th consecutive gain today with lighter than average volume hitting new all-time highs. Its 50 DMA line ($101.64) defines initial support above the prior low ($94.92 on 5/20/21).
>>> FEATURED STOCK ARTICLE : Encountered Distributional Pressure Late This Week - 5/28/2021 |
View all notes |
Set NEW NOTE alert |
Company Profile |
SEC
News |
Chart |
Request a new note
C
A
S
I |
RCKY
-
NASDAQ
Rocky Brands Inc
CONSUMER NON-DURABLES - Textile - Apparel Footwear
|
$55.92
|
+0.32
0.58% |
$56.32
|
51,471
59.16% of 50 DAV
50 DAV is 87,000
|
$69.00
-18.96%
|
5/5/2021
|
$61.65
|
PP = $61.55
|
|
MB = $64.63
|
Most Recent Note - 6/28/2021 5:16:08 PM
G - Still sputtering below its 50 DMA line ($55.99) which is now downward sloping. A rebound above that short-term average is needed for its outlook to improve. The prior low ($50.52 on 5/19/21) defines the next important support where any violation may trigger a more worrisome technical sell signal. Fundamentals remain strong.
>>> FEATURED STOCK ARTICLE : Still Sputtering After Slump Below 50-Day Moving Average - 6/7/2021 |
View all notes |
Set NEW NOTE alert |
Company Profile |
SEC
News |
Chart |
Request a new note
C
A
S
I |
Symbol/Exchange
Company Name
Industry Group |
PRICE |
CHANGE
(%Change) |
Day High |
Volume
(% DAV)
(% 50 day avg vol) |
52 Wk Hi
% From Hi |
Featured
Date |
Price
Featured |
Pivot Featured |
|
Max Buy |
CRL
-
NYSE
Charles River Labs Intl
DRUGS - Biotechnology
|
$372.64
|
+2.72
0.74% |
$373.28
|
311,825
44.36% of 50 DAV
50 DAV is 703,000
|
$372.51
0.03%
|
6/9/2021
|
$345.91
|
PP = $349.23
|
|
MB = $366.69
|
Most Recent Note - 6/28/2021 5:11:21 PM
Y - Holding its ground with below average volume after recently wedging to new highs. Gains above the pivot point backed by at least +40% above average volume are needed to trigger a proper new (or add-on) technical buy signal. Its 50 DMA line ($338.50) defines near-term support to watch on pullbacks. Two of the past 3 quarterly comparisons through Mar '21 have been above the +25% minimum earnings guideline (C criteria).
>>> FEATURED STOCK ARTICLE : Building New Base After Strong Quarterly Earnings Report - 6/9/2021 |
View all notes |
Set NEW NOTE alert |
Company Profile |
SEC
News |
Chart |
Request a new note
C
A
S
I |
GNRC
-
NYSE
Generac Hldgs Inc
Electrical-Power/Equipmt
|
$413.41
|
-1.74
-0.42% |
$415.60
|
648,179
87.12% of 50 DAV
50 DAV is 744,000
|
$417.49
-0.98%
|
6/8/2021
|
$348.46
|
PP = $342.38
|
|
MB = $359.50
|
Most Recent Note - 7/1/2021 4:27:26 PM
G - Volume totals have been cooling while stubbornly holding its ground near its all-time high, very extended from the previously noted base after a streak of noted gains. Prior high ($364) defines initial support to watch on pullbacks. Fundamentals remain strong.
>>> FEATURED STOCK ARTICLE : Gap Up Gain With +118% Above Average Volume - 6/8/2021 |
View all notes |
Set NEW NOTE alert |
Company Profile |
SEC
News |
Chart |
Request a new note
C
A
S
I |
CAMT
-
NASDAQ
Camtek Ltd
ELECTRONICS - Scientific and Technical Instrum
|
$36.69
|
-1.02
-2.70% |
$37.72
|
200,201
65.00% of 50 DAV
50 DAV is 308,000
|
$40.47
-9.34%
|
4/28/2021
|
$35.03
|
PP = $35.34
|
|
MB = $37.11
|
Most Recent Note - 7/1/2021 4:36:59 PM
Y - While consolidating below its "max buy" level its color code is changed to yellow. Volume totals have been cooling. Found support near prior highs in the $35-36 area. Its 50 DMA line ($34.32) defines the next important support to watch.
>>> FEATURED STOCK ARTICLE : Perched at 52-Week High After 4th Consecutive Gain - 6/1/2021 |
View all notes |
Set NEW NOTE alert |
Company Profile |
SEC
News |
Chart |
Request a new note
C
A
S
I |
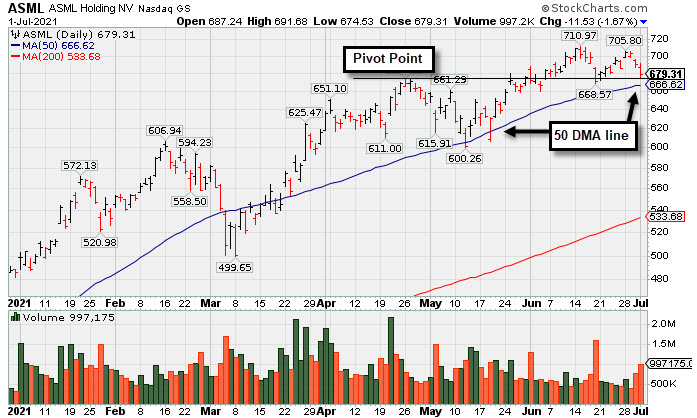
ASML
-
NASDAQ
A S M L Holding N.V. NY
ELECTRONICS - Semiconductor Equipment and Mate
|
$679.31
|
-11.53
-1.67% |
$691.68
|
997,197
124.18% of 50 DAV
50 DAV is 803,000
|
$710.97
-4.45%
|
5/25/2021
|
$669.59
|
PP = $675.75
|
|
MB = $709.54
|
Most Recent Note - 7/1/2021 12:20:33 PM
Y - Encountering distributional pressure while consolidating near the prior high ($675) and above its 50 DMA line ($667) which defines important near-term support to watch.
>>> FEATURED STOCK ARTICLE : Volume Higher While Pulling Back Toward 50-Day Moving Average - 7/1/2021 |
View all notes |
Set NEW NOTE alert |
Company Profile |
SEC
News |
Chart |
Request a new note
C
A
S
I |
BRKS
-
NASDAQ
Brooks Automation
ELECTRONICS - Semiconductor Equipment and Mate
|
$93.91
|
-1.37
-1.44% |
$96.23
|
786,883
80.87% of 50 DAV
50 DAV is 973,000
|
$108.72
-13.62%
|
4/5/2021
|
$99.31
|
PP = $91.88
|
|
MB = $96.47
|
Most Recent Note - 7/1/2021 4:22:35 PM
G - Sputtering below its 50 DMA line ($96.90) which acted as resistance after damaging volume-driven losses. A rebound above the 50 DMA line would help its outlook improve. More damaging losses below the recent low ($86.12 on 5/12/21) would trigger a more worrisome technical sell signal.
>>> FEATURED STOCK ARTICLE : Consolidating Above 50-Day Moving Average Line and Prior High - 6/3/2021 |
View all notes |
Set NEW NOTE alert |
Company Profile |
SEC
News |
Chart |
Request a new note
C
A
S
I |
Symbol/Exchange
Company Name
Industry Group |
PRICE |
CHANGE
(%Change) |
Day High |
Volume
(% DAV)
(% 50 day avg vol) |
52 Wk Hi
% From Hi |
Featured
Date |
Price
Featured |
Pivot Featured |
|
Max Buy |
OPY
-
NYSE
Oppenheimer Holdings Inc
FINANCIAL SERVICES - Investment Brokerage - Regiona
|
$51.46
|
+0.62
1.22% |
$51.60
|
69,520
63.20% of 50 DAV
50 DAV is 110,000
|
$55.75
-7.70%
|
6/7/2021
|
$48.74
|
PP = $52.55
|
|
MB = $55.18
|
Most Recent Note - 7/1/2021 4:32:05 PM
Y - Volume totals have been cooling while consolidating above its 50 DMA line ($49.70) which defines important near term support. Fundamentals remain strong.
>>> FEATURED STOCK ARTICLE : Abrupt Slump Back Into Latest Base With 2 Volume-Driven Losses - 6/18/2021 |
View all notes |
Set NEW NOTE alert |
Company Profile |
SEC
News |
Chart |
Request a new note
C
A
S
I |
MED
-
NYSE
Medifast Inc
SPECIALTY RETAIL - Specialty Retail, Other
|
$286.33
|
+3.35
1.18% |
$288.65
|
71,116
58.77% of 50 DAV
50 DAV is 121,000
|
$336.99
-15.03%
|
5/11/2021
|
$285.72
|
PP = $279.56
|
|
MB = $293.54
|
Most Recent Note - 7/1/2021 4:29:00 PM
G - Volume totals have been cooling while consolidating above the prior high in the $279 area and near its 50 DMA line ($283). More damaging losses below the prior low ($258.77 on ce6/17/21) would raise greater concerns and trigger a worrisome technical sell signal.
>>> FEATURED STOCK ARTICLE : Halted 10-Session Losing Streak Near Prior High and 50 DMA - 6/15/2021 |
View all notes |
Set NEW NOTE alert |
Company Profile |
SEC
News |
Chart |
Request a new note
C
A
S
I |
CLFD
-
NASDAQ
Clearfield Inc
TELECOMMUNICATIONS - Cables / Satalite Equipment
|
$38.15
|
+0.70
1.87% |
$38.19
|
70,810
48.50% of 50 DAV
50 DAV is 146,000
|
$43.64
-12.58%
|
6/4/2021
|
$40.01
|
PP = $40.36
|
|
MB = $42.38
|
Most Recent Note - 6/30/2021 5:46:00 PM
G - Consolidating above its 50 DMA line ($36.64) which has helped its outlook improve, but it still faces some resistance due to overhead supply up to the $43 level. Fundamentals remain strong. See the latest FSU analysis for more details and a new annotated graph.
>>> FEATURED STOCK ARTICLE : Consolidating Above 50-Day Moving Average Helped Outlook - 6/30/2021 |
View all notes |
Set NEW NOTE alert |
Company Profile |
SEC
News |
Chart |
Request a new note
C
A
S
I |
POOL
-
NASDAQ
Pool Corp
WHOLESALE - Basic Materials Wholesale
|
$462.05
|
+3.39
0.74% |
$462.48
|
193,313
72.95% of 50 DAV
50 DAV is 265,000
|
$470.15
-1.72%
|
6/21/2021
|
$455.09
|
PP = $449.54
|
|
MB = $472.02
|
Most Recent Note - 6/30/2021 12:59:03 PM
Y - Pulling back from its 52-week high hit on the prior session. Prior highs in the $449-444 range define initial support to watch above its 50 DMA line ($434) on pullbacks.
>>> FEATURED STOCK ARTICLE : Volume-Driven Breakout After Orderly Consolidation - 6/21/2021 |
View all notes |
Set NEW NOTE alert |
Company Profile |
SEC
News |
Chart |
Request a new note
C
A
S
I |
FSBW
-
NASDAQ
F S Bancorp
Banks-West/Southwest
|
$70.80
|
-0.47
-0.66% |
$71.95
|
27,214
181.43% of 50 DAV
50 DAV is 15,000
|
$73.62
-3.83%
|
5/18/2021
|
$70.16
|
PP = $73.72
|
|
MB = $77.41
|
Most Recent Note - 7/1/2021 4:24:48 PM
Y - Encountered distributional pressure recently while still perched within close striking distance of the pivot point cited based on its 3/08/21 high plus 10 cents. It has been consolidating above its 50 DMA line ($69.78) where it found prompt support during its ongoing ascent. Subsequent gains above the pivot point backed by at least +40% above average volume are needed to trigger a technical buy signal.
>>> FEATURED STOCK ARTICLE : Still Consolidating With Close Striking Distance of All-Time High - 6/24/2021 |
View all notes |
Set NEW NOTE alert |
Company Profile |
SEC
News |
Chart |
Request a new note
C
A
S
I |
Symbol/Exchange
Company Name
Industry Group |
PRICE |
CHANGE
(%Change) |
Day High |
Volume
(% DAV)
(% 50 day avg vol) |
52 Wk Hi
% From Hi |
Featured
Date |
Price
Featured |
Pivot Featured |
|
Max Buy |
SMPL
-
NASDAQ
Simply Good Foods Co
Food-Confectionery
|
$37.17
|
+0.66
1.81% |
$38.50
|
1,117,285
208.84% of 50 DAV
50 DAV is 535,000
|
$37.83
-1.74%
|
12/28/2020
|
$30.40
|
PP = $31.44
|
|
MB = $33.01
|
Most Recent Note - 7/1/2021 1:02:28 PM
G - Hitting a new all-time high today, getting more extended from the previously noted base. Near-term support to watch is its 50 DMA line ($34.76) and the prior low ($31.09 on 5/18/21). Reported Feb '21 quarterly earnings +9% on +2% sales revenues versus the year ago period, below the +25% minimum earnings guideline (C criteria), raising fundamental concerns.
>>> FEATURED STOCK ARTICLE : Simply Wedging Into New High Territory - 6/14/2021 |
View all notes |
Set NEW NOTE alert |
Company Profile |
SEC
News |
Chart |
Request a new note
C
A
S
I |
SHOP
-
NYSE
Shopify Inc Cl A
Computer Sftwr-Enterprse
|
$1,458.00
|
-2.98
-0.20% |
$1,469.49
|
761,127
51.53% of 50 DAV
50 DAV is 1,477,000
|
$1,552.23
-6.07%
|
6/16/2021
|
$1,343.80
|
PP = $1,499.85
|
|
MB = $1,574.84
|
Most Recent Note - 6/29/2021 2:41:59 PM
Y - Stubbornly holding its ground near its all-time high, however, it has pulled back below its pivot point with volume totals cooling after an impressive streak of gains.
>>> FEATURED STOCK ARTICLE : Rebounding After Choppy 4-Month Consolidation - 6/16/2021 |
View all notes |
Set NEW NOTE alert |
Company Profile |
SEC
News |
Chart |
Request a new note
C
A
S
I |
YETI
-
NYSE
Yeti Holdings Inc
Leisure-Products
|
$93.15
|
+1.33
1.45% |
$94.12
|
730,966
47.74% of 50 DAV
50 DAV is 1,531,000
|
$95.76
-2.73%
|
5/13/2021
|
$84.20
|
PP = $90.65
|
|
MB = $95.18
|
Most Recent Note - 6/29/2021 5:10:22 PM
Y - Color code is changed to yellow after a 3rd consecutive gain today with lighter volume, consolidating above the 50 DMA line ($88.36). Prior highs in the $80 area define near-term support to watch on pullbacks. Reported Mar 21 quarterly earnings +245% on +42% sales revenues versus the year ago period, continuing its strong earnings track record.
>>> FEATURED STOCK ARTICLE : Hovering Near High After Finding Support at 50-Day Moving Average - 6/4/2021 |
View all notes |
Set NEW NOTE alert |
Company Profile |
SEC
News |
Chart |
Request a new note
C
A
S
I |
MRBK
-
NASDAQ
Meridian Corp
Banks-Northeast
|
$26.25
|
+0.00
0.00% |
$26.41
|
10,715
24.86% of 50 DAV
50 DAV is 43,100
|
$29.18
-10.04%
|
5/18/2021
|
$25.58
|
PP = $28.06
|
|
MB = $29.46
|
Most Recent Note - 6/29/2021 2:23:57 PM
Y - Churned higher than average volume while recently consolidating in a tight range near its 50 DMA line ($26.42). Stalled since reaching a new 52-week high when featured on 5/18/21. Reported Mar '21 earnings +323% on +93% sales revenues versus the year ago period, continuing its strong earnings track record. Recent low ($24.01 on 4/21/21) defines important near-term support where any violation may trigger a worrisome technical sell signal. Its Relative Strength Rating is 75, below the 80 minimum guideline.
>>> FEATURED STOCK ARTICLE : Stalled Yet Found Support at 50-Day Moving Average Line - 6/11/2021 |
View all notes |
Set NEW NOTE alert |
Company Profile |
SEC
News |
Chart |
Request a new note
C
A
S
I |
JEF
-
NYSE
Jefferies Financial Grp
Finance-Invest Bnk/Bkrs
|
$33.84
|
-0.36
-1.05% |
$34.41
|
1,952,528
98.51% of 50 DAV
50 DAV is 1,982,000
|
$34.98
-3.26%
|
6/28/2021
|
$31.81
|
PP = $34.42
|
|
MB = $36.14
|
Most Recent Note - 6/30/2021 12:47:09 PM
Y - Holding its ground today. Gapped up on the prior session for a big volume-driven gain and touched a new 52-week high. Bullish action came after it reported May '21 quarterly earnings +713% on +70% sales revenues versus the year ago period, continuing its strong earnings rack record. It was highlighted in the 6/28/21 mid-day report in yellow with pivot point cited based on its 5/10/21 high while building on a 14-week "double bottom" base as it was noted - "Subsequent gains above the pivot point backed by at least +40% above average volume are necessary to trigger a technical buy signal. The past 3 quarterly comparisons through Feb '21 showed strong earnings increases with solid sales revenues growth. Annual earnings history (the A criteria) has been strong."
>>> FEATURED STOCK ARTICLE : High-Ranked Financial Firm Formed "Double Bottom" Base - 6/28/2021 |
View all notes |
Set NEW NOTE alert |
Company Profile |
SEC
News |
Chart |
Request a new note
C
A
S
I |
Symbol/Exchange
Company Name
Industry Group |
PRICE |
CHANGE
(%Change) |
Day High |
Volume
(% DAV)
(% 50 day avg vol) |
52 Wk Hi
% From Hi |
Featured
Date |
Price
Featured |
Pivot Featured |
|
Max Buy |
CLAR
-
NASDAQ
Clarus Corporation
Leisure-Products
|
$26.56
|
+0.86
3.35% |
$26.73
|
260,623
115.32% of 50 DAV
50 DAV is 226,000
|
$26.07
1.88%
|
5/12/2021
|
$21.40
|
PP = $19.73
|
|
MB = $20.72
|
Most Recent Note - 7/1/2021 4:38:54 PM
G - Posted a 4th consecutive gain with average volume today while hitting a new 52-week high. It did not form a sound base of sufficient length. Its 50 DMA line ($22.46) defines important near-term support to watch.
>>> FEATURED STOCK ARTICLE : Encountering Distributional Pressure After Recent Rally - 6/17/2021 |
View all notes |
Set NEW NOTE alert |
Company Profile |
SEC
News |
Chart |
Request a new note
C
A
S
I |
AVTR
-
NYSE
Avantor Inc
Medical-Research Eqp/Svc
|
$36.21
|
+0.70
1.97% |
$36.30
|
3,912,461
96.15% of 50 DAV
50 DAV is 4,069,000
|
$36.31
-0.28%
|
6/10/2021
|
$32.94
|
PP = $34.09
|
|
MB = $35.79
|
Most Recent Note - 7/1/2021 4:20:40 PM
G - Posted a gain today for a best ever close and its color code is changed to green after rising above its "max buy" level. Stubbornly held its ground and made gradual progress since triggering a technical buy signal. Prior highs in the $33 area define initial support to watch on pullbacks.
>>> FEATURED STOCK ARTICLE : Medical Research Firm Challenging Prior High - 6/10/2021 |
View all notes |
Set NEW NOTE alert |
Company Profile |
SEC
News |
Chart |
Request a new note
C
A
S
I |