You are not logged in.
This means you
CAN ONLY VIEW reports that were published prior to Thursday, March 20, 2025.
You
MUST UPGRADE YOUR MEMBERSHIP if you want to see any current reports.
AFTER MARKET UPDATE - MONDAY, JULY 19TH, 2021
Previous After Market Report Next After Market Report >>>
|
|
|
|
DOW |
-725.81 |
33,962.04 |
-2.09% |
|
Volume |
1,144,624,094 |
+19% |
|
Volume |
4,467,205,800 |
+11% |
|
NASDAQ |
-162.27 |
14,264.97 |
-1.12% |
|
Advancers |
491 |
15% |
|
Advancers |
1,271 |
29% |
|
S&P 500 |
-68.67 |
4,258.49 |
-1.59% |
|
Decliners |
2,805 |
85% |
|
Decliners |
3,094 |
71% |
|
Russell 2000 |
-32.56 |
2,130.68 |
-1.51% |
|
52 Wk Highs |
20 |
|
|
52 Wk Highs |
40 |
|
|
S&P 600 |
-24.56 |
1,273.00 |
-1.89% |
|
52 Wk Lows |
96 |
|
|
52 Wk Lows |
257 |
|
|
 |
Major Indices Fall as Distributional Pressure Brings Technical Damage
Kenneth J. Gruneisen - Passed the CAN SLIM® Master's Exam
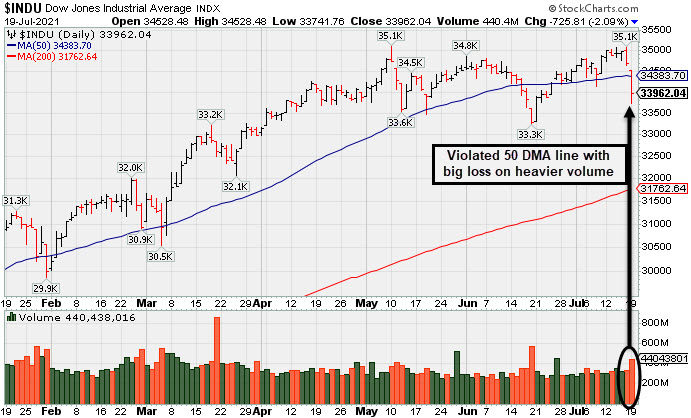
The Dow shed 725 points, weathering its steepest one-day sell-off since October. The S&P 500 retreated 1.6%, while the Nasdaq Composite fell 1.1%, their worst sessions since May. The volume totals reported were higher than the prior session on the NYSE and on the Nasdaq exchange, indicative of distributional pressure. Breadth was negative as decliners led advancers by more than a 5-1 margin on the NYSE and more than 2-1 on the Nasdaq exchange. There were 22 high-ranked companies from the Leaders List that hit new 52-week highs and were listed on the BreakOuts Page, versus 22 on the prior session. New 52-week lows totals outnumbered new 52-week highs on the NYSE and on the Nasdaq exchange. The major indices (M criteria) are in an uptrend that has come under pressure. Investors are reminded to always make buying and selling decisions on case-by-case basis under the strict criteria and rules of the fact-based investment system.
PICTURED: The Dow Jones Industrial Average pulled back from its record high and violated its 50-day moving average (DMA) line raising concerns with a big loss on heavier volume.
U.S. stocks finished broadly lower on Monday, as a spike in COVID-19 cases dented sentiment and dampened global economic recovery prospects. The CBOE Volatility Index (VIX)--Wall Street’s so-called “fear gauge”--jumped to the highest level in two months.
Perceived safe haven assets caught a bid, with a gauge of the U.S. dollar rising 0.2% while Treasuries rallied. The yield on the 10-year note dropped 10 basis points to 1.19%, a new five-month low. On the data front, a measure of homebuilder sentiment unexpectedly fell to its worst point in 11 months in July. WTI crude sank 7.6% to $66.33/barrel, its biggest single-session sell-off since September. Oil prices were pressured by economic growth concerns, along with news that OPEC+ struck a deal to boost supply in the coming months.
All 11 S&P 500 sectors closed in negative territory, with the more cyclical-oriented groups faring the worst. Industries tied to economic reopenings also bore the brunt of the selling, with airline and cruise line operators among the laggards. In M&A news, cloud-based customer service software company Five9 (FIVN +5.92%) bucked the downtrend after agreeing to be acquired by Zoom Video Communications (ZM -2.15%) for $14.7 billion.
Simmering U.S.-China tensions also weighed on the mood, with the U.S., U.K., and their allies formally blaming China for the Microsoft Exchange cybersecurity attack that occurred earlier this year. |
 Kenneth J. Gruneisen started out as a licensed stockbroker in August 1987, a couple of months prior to the historic stock market crash that took the Dow Jones Industrial Average down -22.6% in a single day. He has published daily fact-based fundamental and technical analysis on high-ranked stocks online for two decades. Through FACTBASEDINVESTING.COM, Kenneth provides educational articles, news, market commentary, and other information regarding proven investment systems that work in good times and bad.
Comments contained in the body of this report are technical opinions only and are not necessarily those of Gruneisen Growth Corp. The material herein has been obtained from sources believed to be reliable and accurate, however, its accuracy and completeness cannot be guaranteed. Our firm, employees, and customers may effect transactions, including transactions contrary to any recommendation herein, or have positions in the securities mentioned herein or options with respect thereto. Any recommendation contained in this report may not be suitable for all investors and it is not to be deemed an offer or solicitation on our part with respect to the purchase or sale of any securities. |
|
 |
Financial, Retail, Tech and Commodity-Linked Groups Fell
Kenneth J. Gruneisen - Passed the CAN SLIM® Master's Exam
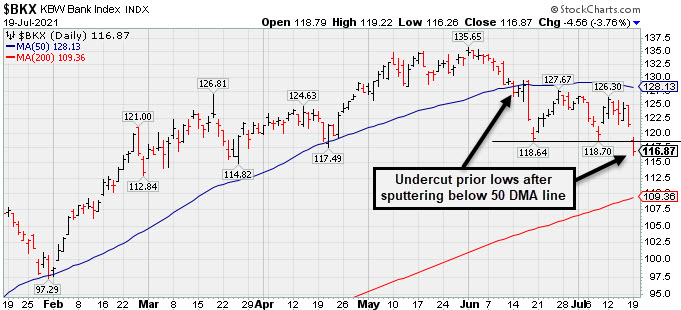
Financial stocks weighed on the major averages as the Broker/Dealer Index ($XBD -2.58%) and Bank Index ($BKX -3.76%) both lost ground. The Retail Index ($RLX -0.87%) also fell. Commodity-linked groups suffered big losses as the Oil Services Index ($OSX -3.58%), Integrated Oil Index ($XOI -4.07%), and Gold & Silver Index ($XAU -2.36%) slumped. The Networking Index ($NWX -1.81%) led the tech sector lower and the Biotech Index ($BTK -0.38%) edged lower while the Semiconductor Index ($SOX -0.00%) finished flat.
PICTURED: The Bank Index ($BKX -3.76%) undercut prior lows with a big loss on Monday after sputtering in recent weeks below its 50-day moving average (DMA) line.
| Oil Services |
$OSX |
53.29 |
-1.98 |
-3.58% |
+20.21% |
| Integrated Oil |
$XOI |
969.26 |
-41.08 |
-4.07% |
+22.31% |
| Semiconductor |
$SOX |
3,145.34 |
-0.11 |
-0.00% |
+12.51% |
| Networking |
$NWX |
821.76 |
-15.16 |
-1.81% |
+14.59% |
| Broker/Dealer |
$XBD |
442.41 |
-11.71 |
-2.58% |
+17.16% |
| Retail |
$RLX |
4,048.20 |
-35.52 |
-0.87% |
+13.61% |
| Gold & Silver |
$XAU |
134.32 |
-3.25 |
-2.36% |
-6.85% |
| Bank |
$BKX |
116.87 |
-4.56 |
-3.76% |
+19.36% |
| Biotech |
$BTK |
5,637.22 |
-21.53 |
-0.38% |
-1.77% |
|
|
|
 |
Managed a Positive Reversal After Early Weakness
Kenneth J. Gruneisen - Passed the CAN SLIM® Master's Exam
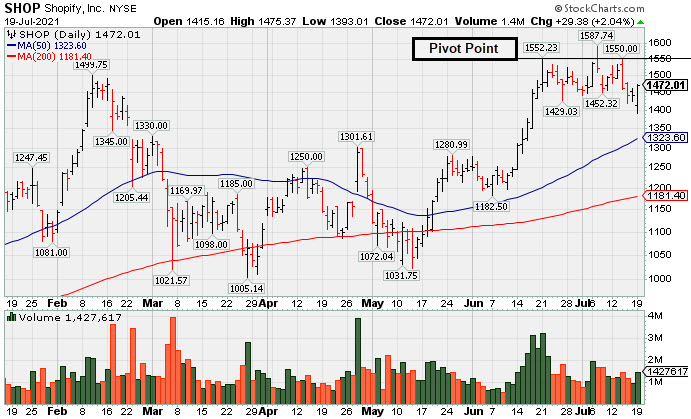
Shopify Inc Cl A (SHOP +$29.38 or +2.04% to $1,472.01) managed a "positive reversal" today after early weakness. There were negative reversals noted on 7/07/21 after hitting a new high and again on 7/14/21. A new pivot point was recently cited based on its 6/21/21 high while building on a cup-with-high-handle base. However, it did not produce confirming gains with at least +40% above average volume for new highs which are needed to trigger a proper new (or add-on) technical buy signal. Subsequent gains would be a reassuring sign of fresh institutional buying demand that might lead to a more substantial leg higher.
SHOP was last shown in the FSU section on 6/16/21 with an annotated graph under the headline, "Rebounding After Choppy 4-Month Consolidation". Its Relative Strength Rating of 86 is above the 80+ minimum guideline for buy candidates.
Keep in mind it is due to report Jun '21 quarterly results on 7/28/21. Volume and volatility often increase near earnings news. SHOP reported Mar '21 quarterly earnings +958% on +110% sales revenues versus the year ago period, continuing its strong earnings track record. Prior quarters showed big earnings increases well above the +25% minimum guideline (C criteria) with very strong underlying sales revenues growth. After years of losses it had strong earnings growth in FY '17-19 (A criteria).
The Ontario, Canada-based Computer Software - Enterprise firm saw the number of top-rated funds owning its shares rise from 1,151 in Sep '19 to 1,971 in Jun '21 a reassuring sign concerning the I criteria. It has an A Timeliness rating and an A Sponsorship Rating. There are 116.1 million shares outstanding (S criteria) which can contribute to greater price volatility in the event of institutional buying or selling. |
|
|
Color Codes Explained :
Y - Better candidates highlighted by our
staff of experts.
G - Previously featured
in past reports as yellow but may no longer be buyable under the
guidelines.
***Last / Change / Volume data in this table is the closing quote data***
Symbol/Exchange
Company Name
Industry Group |
PRICE |
CHANGE
(%Change) |
Day High |
Volume
(% DAV)
(% 50 day avg vol) |
52 Wk Hi
% From Hi |
Featured
Date |
Price
Featured |
Pivot Featured |
|
Max Buy |
 SIVB
-
NASDAQ
SIVB
-
NASDAQ
S V B Financial Group
BANKING - Regional - Pacific Banks
|
$534.95
|
-26.81
-4.77% |
$550.94
|
439,153
115.87% of 50 DAV
50 DAV is 379,000
|
$608.84
-12.14%
|
4/23/2021
|
$579.70
|
PP = $577.16
|
|
MB = $606.02
|
 Most Recent Note - 7/19/2021 5:52:45 PM
G - Slumped further below its 50 DMA line ($569.00) with today's 2nd consecutive loss with above average volume. Only a prompt rebound above the 50 DMA line would help its outlook improve.
>>> FEATURED STOCK ARTICLE : Consolidating Near 50-Day Average After Distributional Pressure - 6/25/2021 |
View all notes |
Set NEW NOTE alert |
Company Profile |
SEC
News |
Chart |
Request a new note
C
A
S
I |
LOGI
-
NASDAQ
Logitech Intl Sa
COMPUTER HARDWARE - Computer Peripherals
|
$117.99
|
+0.08
0.07% |
$119.18
|
570,699
72.52% of 50 DAV
50 DAV is 787,000
|
$140.17
-15.82%
|
5/26/2021
|
$119.13
|
PP = $120.34
|
|
MB = $126.36
|
Most Recent Note - 7/16/2021 4:59:55 PM
G - Suffered 7 consecutive losses with below average volume. Sank below prior highs in the $120-117 area and its 50 DMA line ($121) triggering technical sell signals and its color code is changed to green. Only a prompt rebound above the 50 DMA line would help its outlook improve.
>>> FEATURED STOCK ARTICLE : Recent Pullback is Testing Important Technical Support - 7/2/2021 |
View all notes |
Set NEW NOTE alert |
Company Profile |
SEC
News |
Chart |
Request a new note
C
A
S
I |
CROX
-
NASDAQ
Crocs Inc
CONSUMER NON-DURABLES - Textile - Apparel Footwear
|
$112.56
|
+0.30
0.27% |
$114.11
|
964,021
66.35% of 50 DAV
50 DAV is 1,453,000
|
$120.92
-6.91%
|
6/14/2021
|
$112.64
|
PP = $110.01
|
|
MB = $115.51
|
Most Recent Note - 7/14/2021 4:52:10 PM
G - There was a "negative reversal" today after touching a new all-time high above its "max buy" level. Its 50 DMA line ($107.57) defines important support to watch on pullbacks.
>>> FEATURED STOCK ARTICLE : Quietly Consolidating Below "Max Buy" Level - 7/7/2021 |
View all notes |
Set NEW NOTE alert |
Company Profile |
SEC
News |
Chart |
Request a new note
C
A
S
I |
CRL
-
NYSE
Charles River Labs Intl
DRUGS - Biotechnology
|
$378.30
|
-6.19
-1.61% |
$384.88
|
323,392
47.77% of 50 DAV
50 DAV is 677,000
|
$386.57
-2.14%
|
6/9/2021
|
$345.91
|
PP = $349.23
|
|
MB = $366.69
|
Most Recent Note - 7/19/2021 5:43:10 PM
G - Volume totals have been below average while consolidating after wedging into record high territory. Prior highs in the $349 area and its 50 DMA line ($351) define near-term support to watch on pullbacks. Two of the past 3 quarterly comparisons through Mar '21 have been above the +25% minimum earnings guideline (C criteria).
>>> FEATURED STOCK ARTICLE : Volume Totals Cooling While Perched at High - 7/13/2021 |
View all notes |
Set NEW NOTE alert |
Company Profile |
SEC
News |
Chart |
Request a new note
C
A
S
I |
GNRC
-
NYSE
Generac Hldgs Inc
Electrical-Power/Equipmt
|
$434.25
|
+3.91
0.91% |
$434.32
|
694,764
90.00% of 50 DAV
50 DAV is 772,000
|
$452.92
-4.12%
|
6/8/2021
|
$348.46
|
PP = $342.38
|
|
MB = $359.50
|
Most Recent Note - 7/14/2021 4:01:32 PM
G - Volume was lighter today as it pulled back from its all-time high. Very extended from the previously noted base. Prior high ($364) and its 50 DMA line ($356.67) defines support to watch on pullbacks. Fundamentals remain strong.
>>> FEATURED STOCK ARTICLE : Gain for New High Leaves GNRC Very Extended From Prior Base - 7/12/2021 |
View all notes |
Set NEW NOTE alert |
Company Profile |
SEC
News |
Chart |
Request a new note
C
A
S
I |
Symbol/Exchange
Company Name
Industry Group |
PRICE |
CHANGE
(%Change) |
Day High |
Volume
(% DAV)
(% 50 day avg vol) |
52 Wk Hi
% From Hi |
Featured
Date |
Price
Featured |
Pivot Featured |
|
Max Buy |
CAMT
-
NASDAQ
Camtek Ltd
ELECTRONICS - Scientific and Technical Instrum
|
$33.63
|
+0.25
0.75% |
$34.19
|
261,641
90.22% of 50 DAV
50 DAV is 290,000
|
$40.47
-16.90%
|
4/28/2021
|
$35.03
|
PP = $35.34
|
|
MB = $37.11
|
Most Recent Note - 7/16/2021 4:56:11 PM
G - Color code is changed to green after today's big loss violated its 50 DMA line ($34.67) raising greater concerns and triggering a technical sell signal. Only a prompt rebound above the 50 DMA line would help its outlook improve.
>>> FEATURED STOCK ARTICLE : Loss With Light Volume Undercut 50-Day Moving Average - 7/8/2021 |
View all notes |
Set NEW NOTE alert |
Company Profile |
SEC
News |
Chart |
Request a new note
C
A
S
I |
ASML
-
NASDAQ
A S M L Holding N.V. NY
ELECTRONICS - Semiconductor Equipment and Mate
|
$684.00
|
-3.42
-0.50% |
$684.32
|
850,153
115.20% of 50 DAV
50 DAV is 738,000
|
$723.01
-5.40%
|
5/25/2021
|
$669.59
|
PP = $675.75
|
|
MB = $709.54
|
Most Recent Note - 7/19/2021 12:48:31 PM
Y - Gapped down today after wedging to a new all-time high last week, retesting its 50 DMA line ($675) which defines important near-term support. More damaging losses would raise concerns and trigger technical sell signals.
>>> FEATURED STOCK ARTICLE : Volume Higher While Pulling Back Toward 50-Day Moving Average - 7/1/2021 |
View all notes |
Set NEW NOTE alert |
Company Profile |
SEC
News |
Chart |
Request a new note
C
A
S
I |
POOL
-
NASDAQ
Pool Corp
WHOLESALE - Basic Materials Wholesale
|
$453.52
|
-5.37
-1.17% |
$456.55
|
360,897
145.52% of 50 DAV
50 DAV is 248,000
|
$478.67
-5.25%
|
6/21/2021
|
$455.09
|
PP = $449.54
|
|
MB = $472.02
|
Most Recent Note - 7/19/2021 5:51:12 PM
Y - Color code is changed to yellow after today's 6th consecutive loss tested prior highs in the $449-444 range and its 50 DMA line ($446) which define important support. More damaging losses would raise concerns and trigger a technical sell signal.
>>> FEATURED STOCK ARTICLE : Volume-Driven Breakout After Orderly Consolidation - 6/21/2021 |
View all notes |
Set NEW NOTE alert |
Company Profile |
SEC
News |
Chart |
Request a new note
C
A
S
I |
FSBW
-
NASDAQ
F S Bancorp
Banks-West/Southwest
|
$34.20
|
-1.01
-2.87% |
$34.93
|
31,491
101.58% of 50 DAV
50 DAV is 31,000
|
$36.85
-7.19%
|
5/18/2021
|
$35.08
|
PP = $36.85
|
|
MB = $38.69
|
Most Recent Note - 7/19/2021 5:48:36 PM
G - Color code is changed to green after slumping below its 50 DMA line ($35.12) with today's big loss raising concerns. A prompt rebound is needed for its outlook to improve. Subsequent gains above the pivot point backed by at least +40% above average volume are needed to trigger a technical buy signal. Do not be confused by a 2:1 stock split which impacted share prices as of 7/15/21 (Featured Price, Pivot Point, and Max Buy levels were updated accordingly).
>>> FEATURED STOCK ARTICLE : Still Consolidating With Close Striking Distance of All-Time High - 6/24/2021 |
View all notes |
Set NEW NOTE alert |
Company Profile |
SEC
News |
Chart |
Request a new note
C
A
S
I |
SMPL
-
NASDAQ
Simply Good Foods Co
Food-Confectionery
|
$36.19
|
-0.53
-1.44% |
$36.75
|
389,593
69.69% of 50 DAV
50 DAV is 559,000
|
$38.50
-6.00%
|
12/28/2020
|
$30.40
|
PP = $31.44
|
|
MB = $33.01
|
Most Recent Note - 7/15/2021 4:49:29 PM
G - Pulled back today for a 4th consecutive small loss. Volume totals have been cooling after hitting a new all-time high on 7/01/21. Prior highs in the $35 area define near-term support to watch along with its 50 DMA line ($35.27). Reported May '21 quarterly earnings +65% on +32% sales revenues versus the year ago period, well above the +25% minimum earnings guideline (C criteria). See the latest FSU analysis for more details and a new annotated graph.
>>> FEATURED STOCK ARTICLE : Pulled Back from High With Small Losses on Light Volume - 7/15/2021 |
View all notes |
Set NEW NOTE alert |
Company Profile |
SEC
News |
Chart |
Request a new note
C
A
S
I |
Symbol/Exchange
Company Name
Industry Group |
PRICE |
CHANGE
(%Change) |
Day High |
Volume
(% DAV)
(% 50 day avg vol) |
52 Wk Hi
% From Hi |
Featured
Date |
Price
Featured |
Pivot Featured |
|
Max Buy |
SHOP
-
NYSE
Shopify Inc Cl A
Computer Sftwr-Enterprse
|
$1,472.01
|
+29.38
2.04% |
$1,475.37
|
1,419,279
99.67% of 50 DAV
50 DAV is 1,424,000
|
$1,587.74
-7.29%
|
7/2/2021
|
$1,468.00
|
PP = $1,552.23
|
|
MB = $1,629.84
|
Most Recent Note - 7/19/2021 5:39:48 PM
Y - Managed a "positive reversal" today after early weakness. A new pivot point was recently cited based on its 6/21/21 high while building on a cup-with-high-handle base. Confirming gains with at least +40% above average volume for new highs would trigger a new (or add-on) technical buy signal and be a reassuring sign of fresh institutional buying demand. See the latest FSU analysis for more details and a new annotated graph.
>>> FEATURED STOCK ARTICLE : Managed a Positive Reversal After Early Weakness - 7/19/2021 |
View all notes |
Set NEW NOTE alert |
Company Profile |
SEC
News |
Chart |
Request a new note
C
A
S
I |
YETI
-
NYSE
Yeti Holdings Inc
Leisure-Products
|
$87.90
|
+0.33
0.38% |
$89.01
|
743,726
51.50% of 50 DAV
50 DAV is 1,444,000
|
$96.62
-9.03%
|
5/13/2021
|
$84.20
|
PP = $90.65
|
|
MB = $95.18
|
Most Recent Note - 7/16/2021 5:05:26 PM
G - Color code is changed to green after today's 4th consecutive loss violated its 50 DMA line ($89.48) raising concerns. Only a prompt rebound would help its outlook improve. The prior low ($85.08 on 6/18/21) defines the next important support level to watch. Fundamentals remain strong.
>>> FEATURED STOCK ARTICLE : Volume Totals Cooling While Consolidating Near High - 7/9/2021 |
View all notes |
Set NEW NOTE alert |
Company Profile |
SEC
News |
Chart |
Request a new note
C
A
S
I |
DOCU
-
NASDAQ
Docusign Inc
Computer Sftwr-Enterprse
|
$289.48
|
+7.43
2.63% |
$291.66
|
3,073,272
99.32% of 50 DAV
50 DAV is 3,094,200
|
$298.75
-3.10%
|
7/6/2021
|
$288.96
|
PP = $290.33
|
|
MB = $304.85
|
Most Recent Note - 7/19/2021 5:57:03 PM
Y - Posted a 3rd consecutive gain today with below average volume and managed a best-ever close. Wedging into new high territory with gains in recent weeks lacking great volume conviction. Highlighted in yellow with pivot point cited based on its 9/02/20 high plus 10 cents. A gain and strong close above the pivot point cited backed by at least +40% above average volume may trigger a convincing new (or add-on) technical buy signal. Fundamentals remain strong after reporting very strong Apr '21 quarterly results.
>>> FEATURED STOCK ARTICLE : Touched New High With Average Volume Behind Today's Gain - 7/6/2021 |
View all notes |
Set NEW NOTE alert |
Company Profile |
SEC
News |
Chart |
Request a new note
C
A
S
I |
JEF
-
NYSE
Jefferies Financial Grp
Finance-Invest Bnk/Bkrs
|
$32.16
|
-1.21
-3.63% |
$32.68
|
2,847,405
129.08% of 50 DAV
50 DAV is 2,206,000
|
$35.69
-9.89%
|
6/28/2021
|
$31.81
|
PP = $34.42
|
|
MB = $36.14
|
Most Recent Note - 7/19/2021 5:54:21 PM
Y - Gapped down today testing its 50 DMA line ($32.08). More damaging losses would raise concerns and trigger a technical sell signal. As previously noted - "Subsequent gains above the pivot point backed by at least +40% above average volume are necessary to trigger a technical buy signal."
>>> FEATURED STOCK ARTICLE : High-Ranked Financial Firm Formed "Double Bottom" Base - 6/28/2021 |
View all notes |
Set NEW NOTE alert |
Company Profile |
SEC
News |
Chart |
Request a new note
C
A
S
I |
CLAR
-
NASDAQ
Clarus Corporation
Leisure-Products
|
$27.21
|
-0.35
-1.27% |
$27.76
|
183,155
79.98% of 50 DAV
50 DAV is 229,000
|
$28.21
-3.54%
|
5/12/2021
|
$21.40
|
PP = $19.73
|
|
MB = $20.72
|
Most Recent Note - 7/19/2021 5:41:31 PM
G - Perched near its 52-week high today after 2 small losses with below average volume. It did not form a sound base of sufficient length. Its 50 DMA line ($24.34) defines important near-term support to watch.
>>> FEATURED STOCK ARTICLE : Encountering Distributional Pressure After Recent Rally - 6/17/2021 |
View all notes |
Set NEW NOTE alert |
Company Profile |
SEC
News |
Chart |
Request a new note
C
A
S
I |
Symbol/Exchange
Company Name
Industry Group |
PRICE |
CHANGE
(%Change) |
Day High |
Volume
(% DAV)
(% 50 day avg vol) |
52 Wk Hi
% From Hi |
Featured
Date |
Price
Featured |
Pivot Featured |
|
Max Buy |
AVTR
-
NYSE
Avantor Inc
Medical-Research Eqp/Svc
|
$36.16
|
-0.19
-0.52% |
$36.32
|
2,379,799
60.96% of 50 DAV
50 DAV is 3,904,000
|
$36.52
-0.99%
|
6/10/2021
|
$32.94
|
PP = $34.09
|
|
MB = $35.79
|
Most Recent Note - 7/14/2021 4:32:50 PM
G - Stubbornly holding its ground but making little progress since triggering a technical buy signal. Prior highs in the $33 area coincide with its 50 DMA line defining important support to watch on pullbacks.
>>> FEATURED STOCK ARTICLE : Held Ground But Made Little Price Progress Since Featured - 7/14/2021 |
View all notes |
Set NEW NOTE alert |
Company Profile |
SEC
News |
Chart |
Request a new note
C
A
S
I |
|
|
|
THESE ARE NOT BUY RECOMMENDATIONS!
Comments contained in the body of this report are technical
opinions only. The material herein has been obtained
from sources believed to be reliable and accurate, however,
its accuracy and completeness cannot be guaranteed.
This site is not an investment advisor, hence it does
not endorse or recommend any securities or other investments.
Any recommendation contained in this report may not
be suitable for all investors and it is not to be deemed
an offer or solicitation on our part with respect to
the purchase or sale of any securities. All trademarks,
service marks and trade names appearing in this report
are the property of their respective owners, and are
likewise used for identification purposes only.
This report is a service available
only to active Paid Premium Members.
You may opt-out of receiving report notifications
at any time. Questions or comments may be submitted
by writing to Premium Membership Services 665 S.E. 10 Street, Suite 201 Deerfield Beach, FL 33441-5634 or by calling 1-800-965-8307
or 954-785-1121.
|
|
|