You are not logged in.
This means you
CAN ONLY VIEW reports that were published prior to Thursday, March 20, 2025.
You
MUST UPGRADE YOUR MEMBERSHIP if you want to see any current reports.
AFTER MARKET UPDATE - THURSDAY, JULY 8TH, 2021
Previous After Market Report Next After Market Report >>>
|
|
|
|
DOW |
-259.86 |
34,421.93 |
-0.75% |
|
Volume |
972,085,398 |
+10% |
|
Volume |
4,506,120,200 |
-1% |
|
NASDAQ |
-101.36 |
14,563.71 |
-0.69% |
|
Advancers |
780 |
24% |
|
Advancers |
1,440 |
34% |
|
S&P 500 |
-37.31 |
4,320.82 |
-0.86% |
|
Decliners |
2,452 |
76% |
|
Decliners |
2,739 |
66% |
|
Russell 2000 |
-21.17 |
2,231.68 |
-0.94% |
|
52 Wk Highs |
95 |
|
|
52 Wk Highs |
70 |
|
|
S&P 600 |
-16.63 |
1,324.40 |
-1.24% |
|
52 Wk Lows |
63 |
|
|
52 Wk Lows |
144 |
|
|
 |
Leadership Thinned and Major Indices Fell
Kenneth J. Gruneisen - Passed the CAN SLIM® Master's Exam
The Dow lost 259 points, while the S&P 500 slid 0.9%. The Nasdaq Composite fell 0.7%, a day after both the tech-heavy benchmark and the S&P 500 closed at a fresh record level. The volume totals reported were mixed, higher than the prior session on the NYSE and slightly lower on the Nasdaq exchange. Decliners led advancers by a 3-1 margin on the NYSE and by nearly 2-1 on the Nasdaq exchange. There were 12 high-ranked companies from the Leaders List that hit new 52-week highs and were listed on the BreakOuts Page, versus 55 on the prior session. New 52-week highs totals contracted but still outnumbered new 52-week lows on the NYSE, while new lows outnumbered new highs on the Nasdaq exchange by 2-1. The major indices (M criteria) are in an uptrend. Investors are reminded to always make buying and selling decisions on case-by-case basis under the strict criteria and rules of the fact-based investment system.
PICTURED: The Nasdaq Composite Index pulled back from a new record high.
U.S. stocks ended firmly lower on Thursday as rising concerns surrounding the COVID-19 delta variant pressured the global economic recovery outlook. Longer-dated Treasury rates extended their decline to near their lowest levels since February, with the yield on the benchmark 10-year note down three basis points to 1.29%, and the yield on the 30-year bond shedding two basis points to 1.92%. The CBOE Volatility Index--Wall Street's so-called "fear gauge" briefly surpassed the psychologically important 20 level, before settling just below that mark.
On the data front, weekly initial jobless claims came in at 373,000, above estimates of 350,000 and the prior upwardly revised 371,000 figure, but still near a pandemic low. A separate release showed consumer credit surged by the most on record in May, climbing $35.3 billion after increasing $20.0 billion in April. In commodities, WTI crude reversed earlier declines, adding 1.2% to $73.09/barrel, after a government report showed domestic stockpiles fell more than anticipated, and a gauge of fuel demand soared to a record.
All 11 S&P 500 sectors ended in negative territory, with the more cyclically-oriented sectors Financials, Industrials, and Materials lagging the most. Information Technology shares also underperformed amid weakness in chipmakers. In corporate news, railroad operator Kansas City Southern (KSU -7.87%) fell following reports the Biden Administration would sign an executive order that would target ocean shipping and railroad industries for perceived anticompetitive practices. |
 Kenneth J. Gruneisen started out as a licensed stockbroker in August 1987, a couple of months prior to the historic stock market crash that took the Dow Jones Industrial Average down -22.6% in a single day. He has published daily fact-based fundamental and technical analysis on high-ranked stocks online for two decades. Through FACTBASEDINVESTING.COM, Kenneth provides educational articles, news, market commentary, and other information regarding proven investment systems that work in good times and bad.
Comments contained in the body of this report are technical opinions only and are not necessarily those of Gruneisen Growth Corp. The material herein has been obtained from sources believed to be reliable and accurate, however, its accuracy and completeness cannot be guaranteed. Our firm, employees, and customers may effect transactions, including transactions contrary to any recommendation herein, or have positions in the securities mentioned herein or options with respect thereto. Any recommendation contained in this report may not be suitable for all investors and it is not to be deemed an offer or solicitation on our part with respect to the purchase or sale of any securities. |
|
 |
Financial and Commodity-Linked Indexes Led Tech Indices Lower
Kenneth J. Gruneisen - Passed the CAN SLIM® Master's Exam
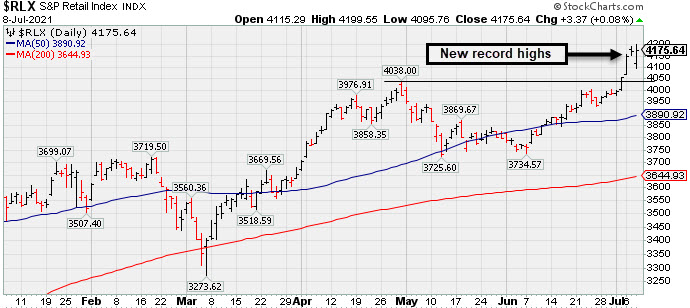
The Broker/Dealer Index ($XBD -2.32%) and Bank Index ($BKX -1.95%) both lost ground and had a negative influence on the major indices. The Retail Index ($RLX +0.08%) finished flat. The Semiconductor Index ($SOX -1.19%) led the tech sector lower and the Networking Index ($NWX -0.43%) also edged lower, meanwhile the Biotech Index ($BTK +0.21%) eked out a small gain. The Gold & Silver Index ($XAU -3.24%) was a standout decliners as the Oil Services Index ($OSX -0.25%) and Integrated Oil Index ($XOI -1.03%) suffered smaller losses.
PICTURED: The Retail Index ($RLX +0.08%) is perched at a record high.
| Oil Services |
$OSX |
60.57 |
-0.15 |
-0.25% |
+36.62% |
| Integrated Oil |
$XOI |
1,083.85 |
-11.25 |
-1.03% |
+36.77% |
| Semiconductor |
$SOX |
3,222.81 |
-38.92 |
-1.19% |
+15.19% |
| Networking |
$NWX |
849.80 |
-3.63 |
-0.43% |
+18.50% |
| Broker/Dealer |
$XBD |
452.30 |
-10.75 |
-2.32% |
+19.78% |
| Retail |
$RLX |
4,175.64 |
+3.37 |
+0.08% |
+17.19% |
| Gold & Silver |
$XAU |
137.98 |
-4.61 |
-3.24% |
-4.31% |
| Bank |
$BKX |
119.74 |
-2.39 |
-1.95% |
+22.29% |
| Biotech |
$BTK |
5,881.53 |
+12.12 |
+0.21% |
+2.48% |
|
|
|
 |
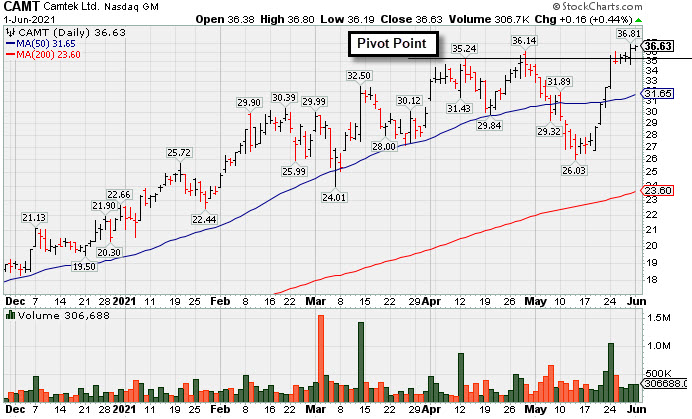
Loss With Light Volume Undercut 50-Day Moving Average
Kenneth J. Gruneisen - Passed the CAN SLIM® Master's Exam
Camtek Ltd (CAMT -$1.07 or -3.02% to $34.40) gapped down today for a 5th consecutive loss with lighter than average volume. It slumped below prior highs in the $35-36 area and violated its 50-day moving average (DMA) line ($34.50) raising concerns, however, it finished the session in the upper third of its intra-day range. That signaled it may be finding support, however any more damaging losses would trigger a more worrisome technical sell signal.
CAMT was highlighted in yellow with pivot point cited based on its 4/13/21 high plus 10 cents in the 4/28/21 mid-day report (read here). It was last shown in this FSU section on 6/01/21 with an annotated graph included under the headline, "Perched at 52-Week High After 4th Consecutive Gain".
CAMT reported earnings +267% on +90% sales revenues for the Mar '21 quarter versus the year ago period, its 3rd strong quarterly comparison well above the +25% minimum guideline (C criteria) and showing impressive sequential acceleration. This Israeli Electronics firm has a strong annual earnings (A criteria) history. It has a 96 Earnings Per Share Rating.
The number of top-rated funds owning its shares rose from 48 in Jun '20 to 93 on Mar '21 a reassuring sign concerning the I criteria. Its current Up/Down Volume Ratio of 0.9 is an unbiased indication its shares have been under slight distributional pressure over the past 50 days. It completed a new Public Offering on 11/19/20. Still, its small supply of only 43.3 million shares outstanding (S criteria) can contribute to greater price volatility in the event of institutional buying or selling. It has a Timeliness Rating of B and a Sponsorship Rating of C. |
|
|
Color Codes Explained :
Y - Better candidates highlighted by our
staff of experts.
G - Previously featured
in past reports as yellow but may no longer be buyable under the
guidelines.
***Last / Change / Volume data in this table is the closing quote data***
Symbol/Exchange
Company Name
Industry Group |
PRICE |
CHANGE
(%Change) |
Day High |
Volume
(% DAV)
(% 50 day avg vol) |
52 Wk Hi
% From Hi |
Featured
Date |
Price
Featured |
Pivot Featured |
|
Max Buy |
 SIVB
-
NASDAQ
SIVB
-
NASDAQ
S V B Financial Group
BANKING - Regional - Pacific Banks
|
$544.87
|
-6.77
-1.23% |
$552.13
|
357,010
94.20% of 50 DAV
50 DAV is 379,000
|
$608.84
-10.51%
|
4/23/2021
|
$579.70
|
PP = $577.16
|
|
MB = $606.02
|
Most Recent Note - 7/6/2021 5:56:22 PM
G - With today's volume-driven loss it slumped further below its 50 DMA line ($570) which recently has acted as resistance. A rebound above the 50 DMA line is needed for its outlook to improve. Confirming gains above the pivot point backed by at least +40% above average volume are still needed to help clinch a convincing technical buy signal. Reported earnings +293% on +64% sales revenues for the Mar '21 quarter versus the year ago period, its 3rd strong comparison. Completed a new Public Offering on 3/24/21.
>>> FEATURED STOCK ARTICLE : Consolidating Near 50-Day Average After Distributional Pressure - 6/25/2021 |
View all notes |
Set NEW NOTE alert |
Company Profile |
SEC
News |
Chart |
Request a new note
C
A
S
I |
LOGI
-
NASDAQ
Logitech Intl Sa
COMPUTER HARDWARE - Computer Peripherals
|
$126.56
|
-0.27
-0.21% |
$127.17
|
671,718
78.84% of 50 DAV
50 DAV is 852,000
|
$140.17
-9.71%
|
5/26/2021
|
$119.13
|
PP = $120.34
|
|
MB = $126.36
|
Most Recent Note - 7/7/2021 3:15:27 PM
G - Color code is changed to green after rising back above its "max buy" level with today's 3rd consecutive gain. Halted its slide after slumping near prior highs in the $120-117 area which define important support to watch along with its 50 DMA line ($119.56).
>>> FEATURED STOCK ARTICLE : Recent Pullback is Testing Important Technical Support - 7/2/2021 |
View all notes |
Set NEW NOTE alert |
Company Profile |
SEC
News |
Chart |
Request a new note
C
A
S
I |
CROX
-
NASDAQ
Crocs Inc
CONSUMER NON-DURABLES - Textile - Apparel Footwear
|
$113.45
|
+0.64
0.57% |
$114.30
|
955,436
54.07% of 50 DAV
50 DAV is 1,767,000
|
$118.68
-4.41%
|
6/14/2021
|
$112.64
|
PP = $110.01
|
|
MB = $115.51
|
Most Recent Note - 7/7/2021 5:33:05 PM
Y - Color code is changed to yellow as volume totals have been light while it pulled back below its "max buy" level. Its prior highs in the $109 area and its 50 DMA line ($105.87) define support to watch on pullbacks. See the latest FSU analysis for more details and a new annotated graph.
>>> FEATURED STOCK ARTICLE : Quietly Consolidating Below "Max Buy" Level - 7/7/2021 |
View all notes |
Set NEW NOTE alert |
Company Profile |
SEC
News |
Chart |
Request a new note
C
A
S
I |
CRL
-
NYSE
Charles River Labs Intl
DRUGS - Biotechnology
|
$379.20
|
-3.98
-1.04% |
$382.92
|
226,683
32.34% of 50 DAV
50 DAV is 701,000
|
$384.30
-1.33%
|
6/9/2021
|
$345.91
|
PP = $349.23
|
|
MB = $366.69
|
 Most Recent Note - 7/8/2021 5:20:31 PM
G - Below average volume was behind recent gains as it wedged into record high territory. Prior highs in the $349 area and its 50 DMA line ($345) define near-term support to watch on pullbacks. Two of the past 3 quarterly comparisons through Mar '21 have been above the +25% minimum earnings guideline (C criteria).
>>> FEATURED STOCK ARTICLE : Building New Base After Strong Quarterly Earnings Report - 6/9/2021 |
View all notes |
Set NEW NOTE alert |
Company Profile |
SEC
News |
Chart |
Request a new note
C
A
S
I |
GNRC
-
NYSE
Generac Hldgs Inc
Electrical-Power/Equipmt
|
$426.60
|
-6.17
-1.43% |
$428.50
|
798,125
102.85% of 50 DAV
50 DAV is 776,000
|
$440.00
-3.05%
|
6/8/2021
|
$348.46
|
PP = $342.38
|
|
MB = $359.50
|
Most Recent Note - 7/6/2021 5:54:07 PM
G - Volume was +27% above average behind today's gain for yet another new all-time high, getting more extended from the previously noted base. Prior high ($364) defines initial support to watch on pullbacks. Fundamentals remain strong.
>>> FEATURED STOCK ARTICLE : Gap Up Gain With +118% Above Average Volume - 6/8/2021 |
View all notes |
Set NEW NOTE alert |
Company Profile |
SEC
News |
Chart |
Request a new note
C
A
S
I |
Symbol/Exchange
Company Name
Industry Group |
PRICE |
CHANGE
(%Change) |
Day High |
Volume
(% DAV)
(% 50 day avg vol) |
52 Wk Hi
% From Hi |
Featured
Date |
Price
Featured |
Pivot Featured |
|
Max Buy |
CAMT
-
NASDAQ
Camtek Ltd
ELECTRONICS - Scientific and Technical Instrum
|
$34.40
|
-1.07
-3.02% |
$34.74
|
188,927
60.75% of 50 DAV
50 DAV is 311,000
|
$40.47
-15.00%
|
4/28/2021
|
$35.03
|
PP = $35.34
|
|
MB = $37.11
|
Most Recent Note - 7/8/2021 5:18:18 PM
G - Color code is changed to green after today's 5th consecutive loss on light volume undercut prior highs in the $35-36 area and its 50 DMA line ($34.50). It recovered to close in the upper third of its intra-day range. More damaging losses would raise greater concerns and trigger a technical sell signal. See the latest FSU analysis for more details and a new annotated graph.
>>> FEATURED STOCK ARTICLE : Loss With Light Volume Undercut 50-Day Moving Average - 7/8/2021 |
View all notes |
Set NEW NOTE alert |
Company Profile |
SEC
News |
Chart |
Request a new note
C
A
S
I |
ASML
-
NASDAQ
A S M L Holding N.V. NY
ELECTRONICS - Semiconductor Equipment and Mate
|
$673.69
|
-16.50
-2.39% |
$675.60
|
844,415
112.59% of 50 DAV
50 DAV is 750,000
|
$710.97
-5.24%
|
5/25/2021
|
$669.59
|
PP = $675.75
|
|
MB = $709.54
|
Most Recent Note - 7/8/2021 12:17:48 PM
Y - Recently encountering distributional pressure, testing the prior high ($675) and its 50 DMA line ($668) which define important near-term support. More damaging losses would raise concerns and trigger technical sell signals.
>>> FEATURED STOCK ARTICLE : Volume Higher While Pulling Back Toward 50-Day Moving Average - 7/1/2021 |
View all notes |
Set NEW NOTE alert |
Company Profile |
SEC
News |
Chart |
Request a new note
C
A
S
I |
MED
-
NYSE
Medifast Inc
SPECIALTY RETAIL - Specialty Retail, Other
|
$278.93
|
-9.34
-3.24% |
$283.46
|
72,352
59.30% of 50 DAV
50 DAV is 122,000
|
$336.99
-17.23%
|
5/11/2021
|
$285.72
|
PP = $279.56
|
|
MB = $293.54
|
Most Recent Note - 7/7/2021 3:09:36 PM
G - Quietly consolidating after undercutting the prior high in the $279 area and finding support near its 50 DMA line ($286). More damaging losses below the prior low ($258.77 on 6/17/21) would raise greater concerns and trigger a worrisome technical sell signal.
>>> FEATURED STOCK ARTICLE : Halted 10-Session Losing Streak Near Prior High and 50 DMA - 6/15/2021 |
View all notes |
Set NEW NOTE alert |
Company Profile |
SEC
News |
Chart |
Request a new note
C
A
S
I |
CLFD
-
NASDAQ
Clearfield Inc
TELECOMMUNICATIONS - Cables / Satalite Equipment
|
$36.18
|
-1.35
-3.60% |
$37.23
|
87,198
70.89% of 50 DAV
50 DAV is 123,000
|
$43.64
-17.09%
|
6/4/2021
|
$40.01
|
PP = $40.36
|
|
MB = $42.38
|
Most Recent Note - 7/8/2021 5:28:11 PM
G - Pulled back today for a 2nd consecutive loss with lighter than average volume, slumping below its 50 DMA line ($37.09) again raising concerns. Faces some resistance due to overhead supply up to the $43 level. Fundamentals remain strong.
>>> FEATURED STOCK ARTICLE : Consolidating Above 50-Day Moving Average Helped Outlook - 6/30/2021 |
View all notes |
Set NEW NOTE alert |
Company Profile |
SEC
News |
Chart |
Request a new note
C
A
S
I |
POOL
-
NASDAQ
Pool Corp
WHOLESALE - Basic Materials Wholesale
|
$468.77
|
-1.55
-0.33% |
$474.26
|
354,997
143.72% of 50 DAV
50 DAV is 247,000
|
$472.33
-0.75%
|
6/21/2021
|
$455.09
|
PP = $449.54
|
|
MB = $472.02
|
Most Recent Note - 7/6/2021 5:51:52 PM
Y - Volume totals have been cooling while hovering near its 52-week high. Prior highs in the $449-444 range define initial support to watch above its 50 DMA line ($438) on pullbacks.
>>> FEATURED STOCK ARTICLE : Volume-Driven Breakout After Orderly Consolidation - 6/21/2021 |
View all notes |
Set NEW NOTE alert |
Company Profile |
SEC
News |
Chart |
Request a new note
C
A
S
I |
Symbol/Exchange
Company Name
Industry Group |
PRICE |
CHANGE
(%Change) |
Day High |
Volume
(% DAV)
(% 50 day avg vol) |
52 Wk Hi
% From Hi |
Featured
Date |
Price
Featured |
Pivot Featured |
|
Max Buy |
FSBW
-
NASDAQ
F S Bancorp
Banks-West/Southwest
|
$68.70
|
+0.23
0.34% |
$69.30
|
9,921
62.01% of 50 DAV
50 DAV is 16,000
|
$73.62
-6.68%
|
5/18/2021
|
$70.16
|
PP = $73.72
|
|
MB = $77.41
|
Most Recent Note - 7/6/2021 12:39:25 PM
Y - Encountering distributional pressure today and while recently perched within striking distance of the pivot point cited based on its 3/08/21 high plus 10 cents. Consolidating near its 50 DMA line ($69.97) where it found prompt support during its ongoing ascent. Subsequent gains above the pivot point backed by at least +40% above average volume are needed to trigger a technical buy signal.
>>> FEATURED STOCK ARTICLE : Still Consolidating With Close Striking Distance of All-Time High - 6/24/2021 |
View all notes |
Set NEW NOTE alert |
Company Profile |
SEC
News |
Chart |
Request a new note
C
A
S
I |
SMPL
-
NASDAQ
Simply Good Foods Co
Food-Confectionery
|
$37.17
|
-0.09
-0.24% |
$37.45
|
514,312
94.72% of 50 DAV
50 DAV is 543,000
|
$38.50
-3.45%
|
12/28/2020
|
$30.40
|
PP = $31.44
|
|
MB = $33.01
|
Most Recent Note - 7/7/2021 3:13:40 PM
G - Holding its ground stubbornly with volume totals cooling after hitting a new all-time high on 7/01/21 when last noted. Prior highs in the $35 area define near-term support to watch along with its 50 DMA line ($34.96). Reported May '21 quarterly earnings +65% on +32% sales revenues versus the year ago period, well above the +25% minimum earnings guideline (C criteria).
>>> FEATURED STOCK ARTICLE : Simply Wedging Into New High Territory - 6/14/2021 |
View all notes |
Set NEW NOTE alert |
Company Profile |
SEC
News |
Chart |
Request a new note
C
A
S
I |
SHOP
-
NYSE
Shopify Inc Cl A
Computer Sftwr-Enterprse
|
$1,463.34
|
-56.88
-3.74% |
$1,499.50
|
1,649,048
110.08% of 50 DAV
50 DAV is 1,498,000
|
$1,587.74
-7.84%
|
7/2/2021
|
$1,468.00
|
PP = $1,552.23
|
|
MB = $1,629.84
|
Most Recent Note - 7/7/2021 1:04:06 PM
Y - Reversed into the red today after hitting a new high. A new pivot point was recently cited based on its 6/21/21 high while building on a cup-with-high-handle base. Confirming gains with at least +40% above average volume for new highs would trigger a new (or add-on) technical buy signal and be a reassuring sign of fresh institutional buying demand.
>>> FEATURED STOCK ARTICLE : Rebounding After Choppy 4-Month Consolidation - 6/16/2021 |
View all notes |
Set NEW NOTE alert |
Company Profile |
SEC
News |
Chart |
Request a new note
C
A
S
I |
YETI
-
NYSE
Yeti Holdings Inc
Leisure-Products
|
$90.33
|
-1.86
-2.02% |
$91.71
|
681,239
45.81% of 50 DAV
50 DAV is 1,487,000
|
$95.76
-5.67%
|
5/13/2021
|
$84.20
|
PP = $90.65
|
|
MB = $95.18
|
Most Recent Note - 7/8/2021 5:29:40 PM
Y - Volume totals still have been cooling while consolidating near its 52-week high. The 50 DMA line ($89.02) and prior low ($85.08 on 6/18/21) define near-term support to watch on pullbacks. Fundamentals remain strong.
>>> FEATURED STOCK ARTICLE : Hovering Near High After Finding Support at 50-Day Moving Average - 6/4/2021 |
View all notes |
Set NEW NOTE alert |
Company Profile |
SEC
News |
Chart |
Request a new note
C
A
S
I |
DOCU
-
NASDAQ
Docusign Inc
Computer Sftwr-Enterprse
|
$288.74
|
-0.20
-0.07% |
$291.89
|
2,339,215
74.85% of 50 DAV
50 DAV is 3,125,000
|
$293.65
-1.67%
|
7/6/2021
|
$288.96
|
PP = $290.33
|
|
MB = $304.85
|
Most Recent Note - 7/7/2021 12:29:45 PM
Y - Wedging into new high territory with today's gain backed by above average volume. Highlighted in yellow with pivot point cited based on its 9/02/20 high plus 10 cents. A gain and strong close above the pivot point cited backed by at least +40% above average volume may trigger a convincing new (or add-on) technical buy signal. Fundamentals remain strong after reporting very strong Apr '21 quarterly results. It went through a choppy consolidation then rebounded since noted on 3/03/21 when dropped from the Featured Stocks list. See the latest FSU analysis for more details and an annotated graph.
>>> FEATURED STOCK ARTICLE : Touched New High With Average Volume Behind Today's Gain - 7/6/2021 |
View all notes |
Set NEW NOTE alert |
Company Profile |
SEC
News |
Chart |
Request a new note
C
A
S
I |
Symbol/Exchange
Company Name
Industry Group |
PRICE |
CHANGE
(%Change) |
Day High |
Volume
(% DAV)
(% 50 day avg vol) |
52 Wk Hi
% From Hi |
Featured
Date |
Price
Featured |
Pivot Featured |
|
Max Buy |
MRBK
-
NASDAQ
Meridian Corp
Banks-Northeast
|
$24.50
|
-0.99
-3.88% |
$25.23
|
25,903
61.67% of 50 DAV
50 DAV is 42,000
|
$29.18
-16.04%
|
5/18/2021
|
$25.58
|
PP = $28.06
|
|
MB = $29.46
|
Most Recent Note - 7/8/2021 5:26:29 PM
Suffered a 3rd consecutive loss with near average volume today slumping well below its 50 DMA line ($26.51). Only a prompt rebound above the 50 DMA line would help its outlook improve. It will be dropped from the Featured Stocks list tonight. Recent low ($24.01 on 4/21/21) defines important near-term support where any violation may trigger a more worrisome technical sell signal. Its Relative Strength Rating is 76, below the 80 minimum guideline.
>>> FEATURED STOCK ARTICLE : Stalled Yet Found Support at 50-Day Moving Average Line - 6/11/2021 |
View all notes |
Set NEW NOTE alert |
Company Profile |
SEC
News |
Chart |
Request a new note
C
A
S
I |
JEF
-
NYSE
Jefferies Financial Grp
Finance-Invest Bnk/Bkrs
|
$31.01
|
-1.65
-5.05% |
$32.11
|
2,925,132
143.95% of 50 DAV
50 DAV is 2,032,000
|
$34.98
-11.35%
|
6/28/2021
|
$31.81
|
PP = $34.42
|
|
MB = $36.14
|
Most Recent Note - 7/8/2021 5:23:27 PM
G - Color code is changed to green after a gap down today and 6th consecutive loss violated its 50 DMA line ($32.09) triggering a technical sell signal. Only a prompt rebound above the 50 DMA line would help its outlook improve. Subsequent gains above the pivot point backed by at least +40% above average volume are necessary to trigger a technical buy signal.
>>> FEATURED STOCK ARTICLE : High-Ranked Financial Firm Formed "Double Bottom" Base - 6/28/2021 |
View all notes |
Set NEW NOTE alert |
Company Profile |
SEC
News |
Chart |
Request a new note
C
A
S
I |
CLAR
-
NASDAQ
Clarus Corporation
Leisure-Products
|
$26.99
|
-0.16
-0.59% |
$27.27
|
102,733
44.67% of 50 DAV
50 DAV is 230,000
|
$27.95
-3.43%
|
5/12/2021
|
$21.40
|
PP = $19.73
|
|
MB = $20.72
|
Most Recent Note - 7/8/2021 5:19:10 PM
G - Paused at its 52-week high today after 7 consecutive gains. It did not form a sound base of sufficient length. Its 50 DMA line ($23.13) defines important near-term support to watch.
>>> FEATURED STOCK ARTICLE : Encountering Distributional Pressure After Recent Rally - 6/17/2021 |
View all notes |
Set NEW NOTE alert |
Company Profile |
SEC
News |
Chart |
Request a new note
C
A
S
I |
AVTR
-
NYSE
Avantor Inc
Medical-Research Eqp/Svc
|
$35.55
|
-0.17
-0.48% |
$35.90
|
3,984,984
100.00% of 50 DAV
50 DAV is 3,985,000
|
$36.42
-2.39%
|
6/10/2021
|
$32.94
|
PP = $34.09
|
|
MB = $35.79
|
Most Recent Note - 7/6/2021 5:52:54 PM
G - Color code is changed to green after quietly rising back above its "max buy" level. Stubbornly held its ground and made gradual progress since triggering a technical buy signal. Prior highs in the $33 area define initial support to watch on pullbacks.
>>> FEATURED STOCK ARTICLE : Medical Research Firm Challenging Prior High - 6/10/2021 |
View all notes |
Set NEW NOTE alert |
Company Profile |
SEC
News |
Chart |
Request a new note
C
A
S
I |
|
|
|
THESE ARE NOT BUY RECOMMENDATIONS!
Comments contained in the body of this report are technical
opinions only. The material herein has been obtained
from sources believed to be reliable and accurate, however,
its accuracy and completeness cannot be guaranteed.
This site is not an investment advisor, hence it does
not endorse or recommend any securities or other investments.
Any recommendation contained in this report may not
be suitable for all investors and it is not to be deemed
an offer or solicitation on our part with respect to
the purchase or sale of any securities. All trademarks,
service marks and trade names appearing in this report
are the property of their respective owners, and are
likewise used for identification purposes only.
This report is a service available
only to active Paid Premium Members.
You may opt-out of receiving report notifications
at any time. Questions or comments may be submitted
by writing to Premium Membership Services 665 S.E. 10 Street, Suite 201 Deerfield Beach, FL 33441-5634 or by calling 1-800-965-8307
or 954-785-1121.
|
|
|