You are not logged in.
This means you
CAN ONLY VIEW reports that were published prior to Thursday, March 20, 2025.
You
MUST UPGRADE YOUR MEMBERSHIP if you want to see any current reports.
AFTER MARKET UPDATE - TUESDAY, JULY 20TH, 2021
Previous After Market Report Next After Market Report >>>
|
|
|
|
DOW |
+549.95 |
34,511.99 |
+1.62% |
|
Volume |
1,063,936,923 |
-7% |
|
Volume |
4,578,114,300 |
+2% |
|
NASDAQ |
+225.46 |
14,500.44 |
+1.58% |
|
Advancers |
2,654 |
83% |
|
Advancers |
3,286 |
78% |
|
S&P 500 |
+64.57 |
4,323.06 |
+1.52% |
|
Decliners |
546 |
17% |
|
Decliners |
951 |
22% |
|
Russell 2000 |
+63.62 |
2,194.30 |
+2.99% |
|
52 Wk Highs |
96 |
|
|
52 Wk Highs |
64 |
|
|
S&P 600 |
+37.38 |
1,310.38 |
+2.94% |
|
52 Wk Lows |
30 |
|
|
52 Wk Lows |
76 |
|
|
 |
Breadth Positive as Major Indices Rebounded
Kenneth J. Gruneisen - Passed the CAN SLIM® Master's Exam
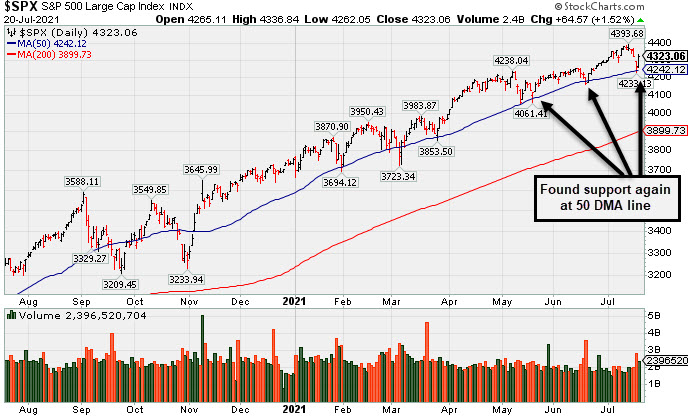
The Dow jumped 549 points, recovering from its steepest one-day rout since October. The S&P 500 saw its best one-day advance since March, climbing 1.5%, while the Nasdaq Composite gained 1.6%. The small-cap Russell 2000 surged more than 3%, snapping a five-session losing streak on its biggest rally since at least March. The volume totals reported were mixed, lighter than the prior session on the NYSE and higher on the Nasdaq exchange. Breadth was positive as advancers led decliners by almost a 5-1 margin on the NYSE and more than 3-1 on the Nasdaq exchange. Leadership improved as there were 35 high-ranked companies from the Leaders List that hit new 52-week highs and were listed on the BreakOuts Page. New 52-week highs totals improved and outnumbered new 52-week lows on the NYSE but new lows again outnumbered new highs on the Nasdaq exchange. The major indices (M criteria) are in an uptrend that has come under pressure. Investors are reminded to always make buying and selling decisions on case-by-case basis under the strict criteria and rules of the fact-based investment system.
PICTURED: The S&P 500 Index found support again at its 50-day moving average (DMA) line. More damaging losses would raise concerns.
U.S. stocks staged a broad-based rebound on Tuesday as investors appeared to “buy the dip” in the aftermath of Monday’s sell-off. Longer-dated Treasuries stabilized near five-month lows, erasing an early session rally. The yield on the 10-year note added three basis points to 1.22%, while the 30-year bond yield climbed six basis points to 1.88%. Meanwhile, the two-year note rate fell one basis point to 0.20% On the data front, housing starts increased a better-than-anticipated 6.3% in June, while building permits unexpectedly declined to an eight-month low during the same period. In commodities, WTI crude bounced back 1.5% to $67.42/barrel, though still hovering in correction territory as the benchmark has tumbled more than 10% below last week's multi-year peak. Elsewhere, cryptocurrency bitcoin traded below $30,000 for the first time in a month.
Ten of 11 S&P 500 sectors closed in positive territory, with the more cyclical-oriented Financials and Industrials groups pacing gains and recouping some of yesterday’s losses. Real Estate also outperformed, with Simon Property Group (SPG +7.20%) rose on the heels of an analyst upgrade. In earnings, IBM (IBM +1.49%) rose after posting its strongest revenue growth in three years. PPG Industries (PPG -4.38%) fell after its quarterly profit missed consensus forecasts and the company issued a warning about rising costs.
|
 Kenneth J. Gruneisen started out as a licensed stockbroker in August 1987, a couple of months prior to the historic stock market crash that took the Dow Jones Industrial Average down -22.6% in a single day. He has published daily fact-based fundamental and technical analysis on high-ranked stocks online for two decades. Through FACTBASEDINVESTING.COM, Kenneth provides educational articles, news, market commentary, and other information regarding proven investment systems that work in good times and bad.
Comments contained in the body of this report are technical opinions only and are not necessarily those of Gruneisen Growth Corp. The material herein has been obtained from sources believed to be reliable and accurate, however, its accuracy and completeness cannot be guaranteed. Our firm, employees, and customers may effect transactions, including transactions contrary to any recommendation herein, or have positions in the securities mentioned herein or options with respect thereto. Any recommendation contained in this report may not be suitable for all investors and it is not to be deemed an offer or solicitation on our part with respect to the purchase or sale of any securities. |
|
 |
Financial, Tech, Retail, and Commodity-Linked Groups Rose
Kenneth J. Gruneisen - Passed the CAN SLIM® Master's Exam
The Bank Index ($BKX +3.15%) and Broker/Dealer Index ($XBD +2.40%) posted solid gains that underpinned the major averages' rebound. The Retail Index ($RLX +1.16%) also rose. The tech sector had a positive bias as the Biotech Index ($BTK +1.93%), Networking Index ($NWX +1.92%), and Semiconductor Index ($SOX +1.37%) posted unanimous gains. The Oil Services Index ($OSX +2.47%) and Integrated Oil Index ($XOI +1.17%) both outpaced the Gold & Silver Index ($XAU +0.62%).
PICTURED: The Biotech Index ($BTK +1.93%) rebounded above its 50-day and 200-day moving average (DMA) lines.
| Oil Services |
$OSX |
54.58 |
+1.32 |
+2.47% |
+23.12% |
| Integrated Oil |
$XOI |
980.56 |
+11.30 |
+1.17% |
+23.73% |
| Semiconductor |
$SOX |
3,190.74 |
+43.23 |
+1.37% |
+14.14% |
| Networking |
$NWX |
837.57 |
+15.81 |
+1.92% |
+16.80% |
| Broker/Dealer |
$XBD |
453.04 |
+10.64 |
+2.40% |
+19.98% |
| Retail |
$RLX |
4,095.11 |
+46.91 |
+1.16% |
+14.93% |
| Gold & Silver |
$XAU |
135.15 |
+0.83 |
+0.62% |
-6.27% |
| Bank |
$BKX |
120.55 |
+3.68 |
+3.15% |
+23.12% |
| Biotech |
$BTK |
5,745.89 |
+108.67 |
+1.93% |
+0.12% |
|
|
|
 |
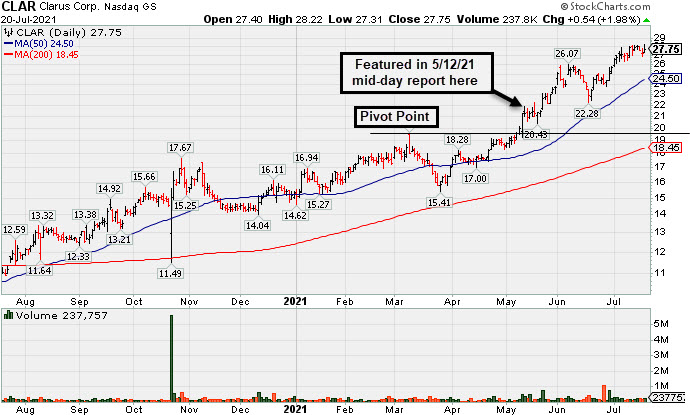
Extended From Prior Base and Hitting Another New High
Kenneth J. Gruneisen - Passed the CAN SLIM® Master's Exam
Clarus Corporation (CLAR +$0.54 or +1.98% to $27.75) touched a new 52-week high today. It did not form a sound base of sufficient length. Its 50-day moving average (DMA) line ($24.50) defines important near-term support to watch.
The high-ranked Leisure-Products firm's Sep, Dec '20 and Mar '21 quarterly results showed very strong earnings increases over the year ago periods with impressive acceleration in sales revenues growth rate. Annual earnings history (A criteria) has been strong.
The number of top-rated funds owning its shares barely changed from 168 in Dec '20 to 169 in Jun '21. Its current Up/Down Volume Ratio of 1.9 is an unbiased indication that its shares have been under accumulation over the past 50 days. Its small supply of only 22.2 million shares (S criteria) in the public float can contribute to greater volatility in the event of institutional buying or selling.
|
|
|
Color Codes Explained :
Y - Better candidates highlighted by our
staff of experts.
G - Previously featured
in past reports as yellow but may no longer be buyable under the
guidelines.
***Last / Change / Volume data in this table is the closing quote data***
Symbol/Exchange
Company Name
Industry Group |
PRICE |
CHANGE
(%Change) |
Day High |
Volume
(% DAV)
(% 50 day avg vol) |
52 Wk Hi
% From Hi |
Featured
Date |
Price
Featured |
Pivot Featured |
|
Max Buy |
 SIVB
-
NASDAQ
SIVB
-
NASDAQ
S V B Financial Group
BANKING - Regional - Pacific Banks
|
$561.65
|
+26.70
4.99% |
$565.76
|
353,650
92.58% of 50 DAV
50 DAV is 382,000
|
$608.84
-7.75%
|
4/23/2021
|
$579.70
|
PP = $577.16
|
|
MB = $606.02
|
 Most Recent Note - 7/20/2021 5:20:09 PM
G - Posted a big gain today but remains below its 50 DMA line ($568.47). Only a prompt rebound above the 50 DMA line would help its outlook improve.
>>> FEATURED STOCK ARTICLE : Consolidating Near 50-Day Average After Distributional Pressure - 6/25/2021 |
View all notes |
Set NEW NOTE alert |
Company Profile |
SEC
News |
Chart |
Request a new note
C
A
S
I |
LOGI
-
NASDAQ
Logitech Intl Sa
COMPUTER HARDWARE - Computer Peripherals
|
$118.03
|
+0.04
0.03% |
$118.64
|
323,132
40.95% of 50 DAV
50 DAV is 789,000
|
$140.17
-15.80%
|
5/26/2021
|
$119.13
|
PP = $120.34
|
|
MB = $126.36
|
Most Recent Note - 7/16/2021 4:59:55 PM
G - Suffered 7 consecutive losses with below average volume. Sank below prior highs in the $120-117 area and its 50 DMA line ($121) triggering technical sell signals and its color code is changed to green. Only a prompt rebound above the 50 DMA line would help its outlook improve.
>>> FEATURED STOCK ARTICLE : Recent Pullback is Testing Important Technical Support - 7/2/2021 |
View all notes |
Set NEW NOTE alert |
Company Profile |
SEC
News |
Chart |
Request a new note
C
A
S
I |
CROX
-
NASDAQ
Crocs Inc
CONSUMER NON-DURABLES - Textile - Apparel Footwear
|
$116.29
|
+3.73
3.31% |
$117.12
|
879,876
60.89% of 50 DAV
50 DAV is 1,445,000
|
$120.92
-3.83%
|
6/14/2021
|
$112.64
|
PP = $110.01
|
|
MB = $115.51
|
Most Recent Note - 7/20/2021 5:25:36 PM
G - Posted a 2nd consecutive gain today with light volume, finding support at its 50 DMA line ($108.21). More damaging losses would raise concerns and trigger a technical sell signal.
>>> FEATURED STOCK ARTICLE : Quietly Consolidating Below "Max Buy" Level - 7/7/2021 |
View all notes |
Set NEW NOTE alert |
Company Profile |
SEC
News |
Chart |
Request a new note
C
A
S
I |
CRL
-
NYSE
Charles River Labs Intl
DRUGS - Biotechnology
|
$385.48
|
+7.18
1.90% |
$386.45
|
393,789
58.43% of 50 DAV
50 DAV is 674,000
|
$386.57
-0.28%
|
6/9/2021
|
$345.91
|
PP = $349.23
|
|
MB = $366.69
|
Most Recent Note - 7/19/2021 5:43:10 PM
G - Volume totals have been below average while consolidating after wedging into record high territory. Prior highs in the $349 area and its 50 DMA line ($351) define near-term support to watch on pullbacks. Two of the past 3 quarterly comparisons through Mar '21 have been above the +25% minimum earnings guideline (C criteria).
>>> FEATURED STOCK ARTICLE : Volume Totals Cooling While Perched at High - 7/13/2021 |
View all notes |
Set NEW NOTE alert |
Company Profile |
SEC
News |
Chart |
Request a new note
C
A
S
I |
GNRC
-
NYSE
Generac Hldgs Inc
Electrical-Power/Equipmt
|
$436.42
|
+2.17
0.50% |
$438.49
|
656,340
84.91% of 50 DAV
50 DAV is 773,000
|
$452.92
-3.64%
|
6/8/2021
|
$348.46
|
PP = $342.38
|
|
MB = $359.50
|
Most Recent Note - 7/14/2021 4:01:32 PM
G - Volume was lighter today as it pulled back from its all-time high. Very extended from the previously noted base. Prior high ($364) and its 50 DMA line ($356.67) defines support to watch on pullbacks. Fundamentals remain strong.
>>> FEATURED STOCK ARTICLE : Gain for New High Leaves GNRC Very Extended From Prior Base - 7/12/2021 |
View all notes |
Set NEW NOTE alert |
Company Profile |
SEC
News |
Chart |
Request a new note
C
A
S
I |
Symbol/Exchange
Company Name
Industry Group |
PRICE |
CHANGE
(%Change) |
Day High |
Volume
(% DAV)
(% 50 day avg vol) |
52 Wk Hi
% From Hi |
Featured
Date |
Price
Featured |
Pivot Featured |
|
Max Buy |
CAMT
-
NASDAQ
Camtek Ltd
ELECTRONICS - Scientific and Technical Instrum
|
$34.80
|
+1.17
3.48% |
$35.10
|
145,119
51.28% of 50 DAV
50 DAV is 283,000
|
$40.47
-14.01%
|
4/28/2021
|
$35.03
|
PP = $35.34
|
|
MB = $37.11
|
Most Recent Note - 7/20/2021 5:23:45 PM
G - Rebounded near its 50 DMA line ($34.82) with light volume behind today's gain. Subsequent gains above the 50 DMA line would help its outlook improve.
>>> FEATURED STOCK ARTICLE : Loss With Light Volume Undercut 50-Day Moving Average - 7/8/2021 |
View all notes |
Set NEW NOTE alert |
Company Profile |
SEC
News |
Chart |
Request a new note
C
A
S
I |
ASML
-
NASDAQ
A S M L Holding N.V. NY
ELECTRONICS - Semiconductor Equipment and Mate
|
$684.05
|
+0.05
0.01% |
$688.66
|
804,321
108.25% of 50 DAV
50 DAV is 743,000
|
$723.01
-5.39%
|
5/25/2021
|
$669.59
|
PP = $675.75
|
|
MB = $709.54
|
Most Recent Note - 7/19/2021 12:48:31 PM
Y - Gapped down today after wedging to a new all-time high last week, retesting its 50 DMA line ($675) which defines important near-term support. More damaging losses would raise concerns and trigger technical sell signals.
>>> FEATURED STOCK ARTICLE : Volume Higher While Pulling Back Toward 50-Day Moving Average - 7/1/2021 |
View all notes |
Set NEW NOTE alert |
Company Profile |
SEC
News |
Chart |
Request a new note
C
A
S
I |
POOL
-
NASDAQ
Pool Corp
WHOLESALE - Basic Materials Wholesale
|
$452.51
|
-1.01
-0.22% |
$458.28
|
359,129
143.08% of 50 DAV
50 DAV is 251,000
|
$478.67
-5.47%
|
6/21/2021
|
$455.09
|
PP = $449.54
|
|
MB = $472.02
|
Most Recent Note - 7/19/2021 5:51:12 PM
Y - Color code is changed to yellow after today's 6th consecutive loss tested prior highs in the $449-444 range and its 50 DMA line ($446) which define important support. More damaging losses would raise concerns and trigger a technical sell signal.
>>> FEATURED STOCK ARTICLE : Volume-Driven Breakout After Orderly Consolidation - 6/21/2021 |
View all notes |
Set NEW NOTE alert |
Company Profile |
SEC
News |
Chart |
Request a new note
C
A
S
I |
FSBW
-
NASDAQ
F S Bancorp
Banks-West/Southwest
|
$35.59
|
+1.39
4.06% |
$36.00
|
32,047
103.38% of 50 DAV
50 DAV is 31,000
|
$36.85
-3.42%
|
5/18/2021
|
$35.08
|
PP = $36.85
|
|
MB = $38.69
|
Most Recent Note - 7/20/2021 5:16:51 PM
Y - Color code is changed to yellow after promptly rebounding above its 50 DMA line ($35.14) with today's big gain helping its outlook to improve. Subsequent gains above the pivot point backed by at least +40% above average volume are needed to trigger a technical buy signal. Do not be confused by a 2:1 stock split which impacted share prices as of 7/15/21 (Featured Price, Pivot Point, and Max Buy levels were updated accordingly).
>>> FEATURED STOCK ARTICLE : Still Consolidating With Close Striking Distance of All-Time High - 6/24/2021 |
View all notes |
Set NEW NOTE alert |
Company Profile |
SEC
News |
Chart |
Request a new note
C
A
S
I |
SMPL
-
NASDAQ
Simply Good Foods Co
Food-Confectionery
|
$36.81
|
+0.62
1.71% |
$37.15
|
582,754
104.06% of 50 DAV
50 DAV is 560,000
|
$38.50
-4.39%
|
12/28/2020
|
$30.40
|
PP = $31.44
|
|
MB = $33.01
|
Most Recent Note - 7/20/2021 5:27:36 PM
G - Stubbornly holding its ground near its all-time high. Its 50 DMA line ($35.40) and prior highs in the $35 area define important near-term support to watch on pullbacks. Reported May '21 quarterly earnings +65% on +32% sales revenues versus the year ago period, well above the +25% minimum earnings guideline (C criteria).
>>> FEATURED STOCK ARTICLE : Pulled Back from High With Small Losses on Light Volume - 7/15/2021 |
View all notes |
Set NEW NOTE alert |
Company Profile |
SEC
News |
Chart |
Request a new note
C
A
S
I |
Symbol/Exchange
Company Name
Industry Group |
PRICE |
CHANGE
(%Change) |
Day High |
Volume
(% DAV)
(% 50 day avg vol) |
52 Wk Hi
% From Hi |
Featured
Date |
Price
Featured |
Pivot Featured |
|
Max Buy |
SHOP
-
NYSE
Shopify Inc Cl A
Computer Sftwr-Enterprse
|
$1,524.78
|
+52.77
3.58% |
$1,533.52
|
1,279,144
90.85% of 50 DAV
50 DAV is 1,408,000
|
$1,587.74
-3.97%
|
7/2/2021
|
$1,468.00
|
PP = $1,552.23
|
|
MB = $1,629.84
|
Most Recent Note - 7/20/2021 5:18:55 PM
Y - Posted a solid gain today for its 2nd best ever close. A new pivot point was recently cited based on its 6/21/21 high while building on a cup-with-high-handle base. Confirming gains with at least +40% above average volume for new highs would trigger a new (or add-on) technical buy signal and be a reassuring sign of fresh institutional buying demand. See the latest FSU analysis for more details and an annotated graph.
>>> FEATURED STOCK ARTICLE : Managed a Positive Reversal After Early Weakness - 7/19/2021 |
View all notes |
Set NEW NOTE alert |
Company Profile |
SEC
News |
Chart |
Request a new note
C
A
S
I |
YETI
-
NYSE
Yeti Holdings Inc
Leisure-Products
|
$91.80
|
+3.90
4.44% |
$92.50
|
718,369
49.99% of 50 DAV
50 DAV is 1,437,000
|
$96.62
-4.99%
|
5/13/2021
|
$84.20
|
PP = $90.65
|
|
MB = $95.18
|
Most Recent Note - 7/20/2021 5:29:38 PM
Y - Color code is changed to yellow after today's gain allowed it to rebound and close above its 50 DMA line ($89.52) helping its outlook improve. More damaging losses would raise greater concerns. Fundamentals remain strong.
>>> FEATURED STOCK ARTICLE : Volume Totals Cooling While Consolidating Near High - 7/9/2021 |
View all notes |
Set NEW NOTE alert |
Company Profile |
SEC
News |
Chart |
Request a new note
C
A
S
I |
DOCU
-
NASDAQ
Docusign Inc
Computer Sftwr-Enterprse
|
$301.27
|
+11.79
4.07% |
$306.00
|
4,366,126
142.54% of 50 DAV
50 DAV is 3,063,000
|
$298.75
0.84%
|
7/6/2021
|
$288.96
|
PP = $290.33
|
|
MB = $304.85
|
Most Recent Note - 7/20/2021 11:54:17 AM
Y - Posting a 4th consecutive gain today and hitting a new all-time high. Wedging into new high territory with gains in recent weeks lacking great volume conviction. Highlighted in yellow with pivot point cited based on its 9/02/20 high plus 10 cents. A gain and strong close above the pivot point cited backed by at least +40% above average volume may trigger a convincing new (or add-on) technical buy signal. Fundamentals remain strong after reporting very strong Apr '21 quarterly results.
>>> FEATURED STOCK ARTICLE : Touched New High With Average Volume Behind Today's Gain - 7/6/2021 |
View all notes |
Set NEW NOTE alert |
Company Profile |
SEC
News |
Chart |
Request a new note
C
A
S
I |
JEF
-
NYSE
Jefferies Financial Grp
Finance-Invest Bnk/Bkrs
|
$32.97
|
+0.81
2.52% |
$33.45
|
2,342,529
105.28% of 50 DAV
50 DAV is 2,225,000
|
$35.69
-7.62%
|
6/28/2021
|
$31.81
|
PP = $34.42
|
|
MB = $36.14
|
Most Recent Note - 7/19/2021 5:54:21 PM
Y - Gapped down today testing its 50 DMA line ($32.08). More damaging losses would raise concerns and trigger a technical sell signal. As previously noted - "Subsequent gains above the pivot point backed by at least +40% above average volume are necessary to trigger a technical buy signal."
>>> FEATURED STOCK ARTICLE : High-Ranked Financial Firm Formed "Double Bottom" Base - 6/28/2021 |
View all notes |
Set NEW NOTE alert |
Company Profile |
SEC
News |
Chart |
Request a new note
C
A
S
I |
CLAR
-
NASDAQ
Clarus Corporation
Leisure-Products
|
$27.75
|
+0.54
1.98% |
$28.22
|
237,757
102.93% of 50 DAV
50 DAV is 231,000
|
$28.21
-1.63%
|
5/12/2021
|
$21.40
|
PP = $19.73
|
|
MB = $20.72
|
Most Recent Note - 7/20/2021 5:14:52 PM
G - Touched another new 52-week high today with a gain backed by average volume. It did not form a sound base of sufficient length. Its 50 DMA line ($24.50) defines important near-term support to watch. See the latest FSU analysis for more details and a new annotated graph.
>>> FEATURED STOCK ARTICLE : Extended From Prior Base and Hitting Another New High - 7/20/2021 |
View all notes |
Set NEW NOTE alert |
Company Profile |
SEC
News |
Chart |
Request a new note
C
A
S
I |
Symbol/Exchange
Company Name
Industry Group |
PRICE |
CHANGE
(%Change) |
Day High |
Volume
(% DAV)
(% 50 day avg vol) |
52 Wk Hi
% From Hi |
Featured
Date |
Price
Featured |
Pivot Featured |
|
Max Buy |
AVTR
-
NYSE
Avantor Inc
Medical-Research Eqp/Svc
|
$37.15
|
+0.99
2.74% |
$37.35
|
4,349,122
111.80% of 50 DAV
50 DAV is 3,890,000
|
$36.52
1.73%
|
6/10/2021
|
$32.94
|
PP = $34.09
|
|
MB = $35.79
|
Most Recent Note - 7/20/2021 5:21:50 PM
G - Posted a solid gain today for a new all-time high. Prior highs in the $33 area coincide with its 50 DMA line defining important support to watch on pullbacks.
>>> FEATURED STOCK ARTICLE : Held Ground But Made Little Price Progress Since Featured - 7/14/2021 |
View all notes |
Set NEW NOTE alert |
Company Profile |
SEC
News |
Chart |
Request a new note
C
A
S
I |
|
|
|
THESE ARE NOT BUY RECOMMENDATIONS!
Comments contained in the body of this report are technical
opinions only. The material herein has been obtained
from sources believed to be reliable and accurate, however,
its accuracy and completeness cannot be guaranteed.
This site is not an investment advisor, hence it does
not endorse or recommend any securities or other investments.
Any recommendation contained in this report may not
be suitable for all investors and it is not to be deemed
an offer or solicitation on our part with respect to
the purchase or sale of any securities. All trademarks,
service marks and trade names appearing in this report
are the property of their respective owners, and are
likewise used for identification purposes only.
This report is a service available
only to active Paid Premium Members.
You may opt-out of receiving report notifications
at any time. Questions or comments may be submitted
by writing to Premium Membership Services 665 S.E. 10 Street, Suite 201 Deerfield Beach, FL 33441-5634 or by calling 1-800-965-8307
or 954-785-1121.
|
|
|