You are not logged in.
This means you
CAN ONLY VIEW reports that were published prior to Thursday, March 20, 2025.
You
MUST UPGRADE YOUR MEMBERSHIP if you want to see any current reports.
AFTER MARKET UPDATE - FRIDAY, JULY 9TH, 2021
Previous After Market Report Next After Market Report >>>
|
|
|
|
DOW |
+448.23 |
34,870.16 |
+1.30% |
|
Volume |
815,853,425 |
-16% |
|
Volume |
3,770,912,000 |
-16% |
|
NASDAQ |
+139.15 |
14,698.93 |
+0.96% |
|
Advancers |
2,553 |
79% |
|
Advancers |
3,275 |
77% |
|
S&P 500 |
+48.73 |
4,369.55 |
+1.13% |
|
Decliners |
683 |
21% |
|
Decliners |
1,004 |
23% |
|
Russell 2000 |
+48.33 |
2,280.00 |
+2.17% |
|
52 Wk Highs |
152 |
|
|
52 Wk Highs |
99 |
|
|
S&P 600 |
+35.18 |
1,359.58 |
+2.66% |
|
52 Wk Lows |
10 |
|
|
52 Wk Lows |
33 |
|
|
 |
Major Averages Rallied With More Leadership but Lighter Volume
Kenneth J. Gruneisen - Passed the CAN SLIM® Master's Exam
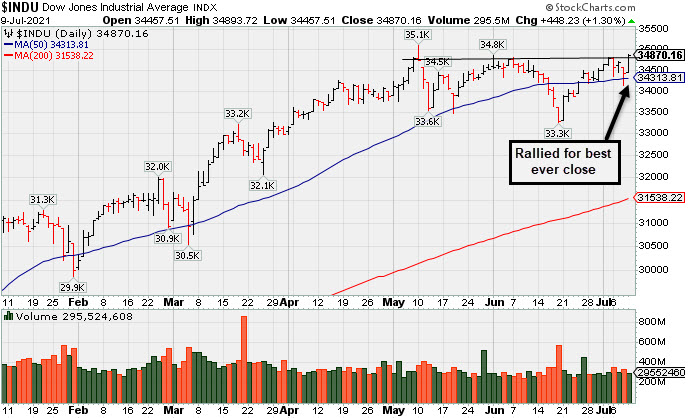
The Dow jumped 448 points, while the S&P 500 rallied 1.1%, lifting the benchmarks marginally higher on the week (+0.2% and +0.4%, respectively). The Nasdaq Composite gained 1%, capping a weekly increase of 0.4%. The volume totals reported for Friday were lighter than the prior session on the NYSE and on the Nasdaq exchange. Advancers led decliners by more than a 3-1 margin on the NYSE and 'on the Nasdaq exchange. There were 33 high-ranked companies from the Leaders List that hit new 52-week highs and were listed on the BreakOuts Page, versus 12 on the prior session. New 52-week highs totals expanded and outnumbered new 52-week lows on the NYSE and on the Nasdaq exchange. The major indices (M criteria) are in an uptrend. Investors are reminded to always make buying and selling decisions on case-by-case basis under the strict criteria and rules of the fact-based investment system.
PICTURED: The Dow Jones Industrial Average posted a big gain for a best-ever close.
U.S. stocks finished firmly higher on Friday as a relief rally completely erased the week’s losses, helping the S&P 500 rebound from its worst session since June 18 on Thursday. All three major averages reclaimed record territory in a third consecutive weekly advance as investors seemed to brush off earlier concerns about peak economic growth and a flare-up in the COVID-19 delta variant.
Longer-dated Treasury yields also bounced back after sliding to a nearly five-month low. The yield on the benchmark 10-year note was up seven basis points to 1.36%, snapping an eight-session streak of declines. On the data front, wholesale inventories were upwardly revised to reflect a 1.3% rise in May. In commodities, WTI crude climbed 2.3% to $74.61/barrel, still posting its first weekly drop since May.
All 11 S&P 500 sectors closed in positive territory, with the more cyclical and value-oriented groups leading the advance. The KBW Bank Index jumped 3.9% for its best day since January. Some mega-cap names lagged on a relative basis after President Biden signed an executive order intended to promote competition, specifically targeting the technology, agriculture, and pharmaceutical industries. In stock news, General Motors (GM +4.82%) rose on positive analyst commentary. Elsewhere, online postage company Stamps.com (STMP +63.98%) soared after agreeing to be acquired by private equity firm Thoma Bravo for $6.6 billion in cash. |
 Kenneth J. Gruneisen started out as a licensed stockbroker in August 1987, a couple of months prior to the historic stock market crash that took the Dow Jones Industrial Average down -22.6% in a single day. He has published daily fact-based fundamental and technical analysis on high-ranked stocks online for two decades. Through FACTBASEDINVESTING.COM, Kenneth provides educational articles, news, market commentary, and other information regarding proven investment systems that work in good times and bad.
Comments contained in the body of this report are technical opinions only and are not necessarily those of Gruneisen Growth Corp. The material herein has been obtained from sources believed to be reliable and accurate, however, its accuracy and completeness cannot be guaranteed. Our firm, employees, and customers may effect transactions, including transactions contrary to any recommendation herein, or have positions in the securities mentioned herein or options with respect thereto. Any recommendation contained in this report may not be suitable for all investors and it is not to be deemed an offer or solicitation on our part with respect to the purchase or sale of any securities. |
|
 |
Financial, Tech and Commodity-Linked Groups Posted Solid Gains
Kenneth J. Gruneisen - Passed the CAN SLIM® Master's Exam
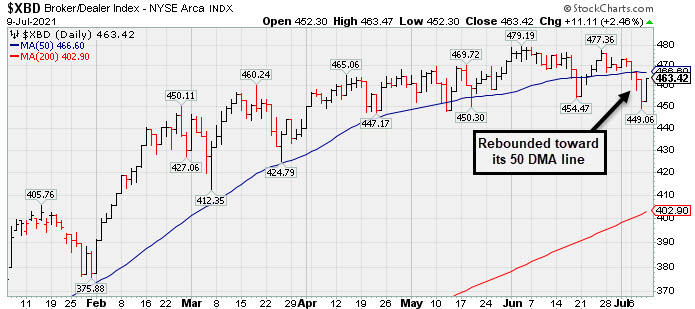
The Broker/Dealer Index ($XBD +2.46%) and Bank Index ($BKX +3.94%) both posted solid gains which had a positive influence on the major averages. Commodity-linked groups also had a positive bias as the Gold & Silver Index ($XAU +2.45%), Oil Services Index ($OSX +2.82%), and Integrated Oil Index ($XOI +1.85%) posted unanimous gains. The Semiconductor Index ($SOX +1.68%) and Networking Index ($NWX +1.92%) both outpaced the Biotech Index ($BTK +0.53%). The Retail Index ($RLX +0.34%) edged higher.
PICTURED: The Broker/Dealer Index ($XBD +2.46%) rebounded toward its 50-day moving average (DMA) line.
| Oil Services |
$OSX |
62.33 |
+1.71 |
+2.82% |
+40.61% |
| Integrated Oil |
$XOI |
1,103.88 |
+20.04 |
+1.85% |
+39.29% |
| Semiconductor |
$SOX |
3,277.10 |
+54.30 |
+1.68% |
+17.23% |
| Networking |
$NWX |
866.14 |
+16.34 |
+1.92% |
+20.78% |
| Broker/Dealer |
$XBD |
463.42 |
+11.11 |
+2.46% |
+22.73% |
| Retail |
$RLX |
4,189.66 |
+14.02 |
+0.34% |
+17.58% |
| Gold & Silver |
$XAU |
141.37 |
+3.39 |
+2.45% |
-1.96% |
| Bank |
$BKX |
124.46 |
+4.72 |
+3.94% |
+27.11% |
| Biotech |
$BTK |
5,912.64 |
+31.11 |
+0.53% |
+3.03% |
|
|
|
 |
Volume Totals Cooling While Consolidating Near High
Kenneth J. Gruneisen - Passed the CAN SLIM® Master's Exam
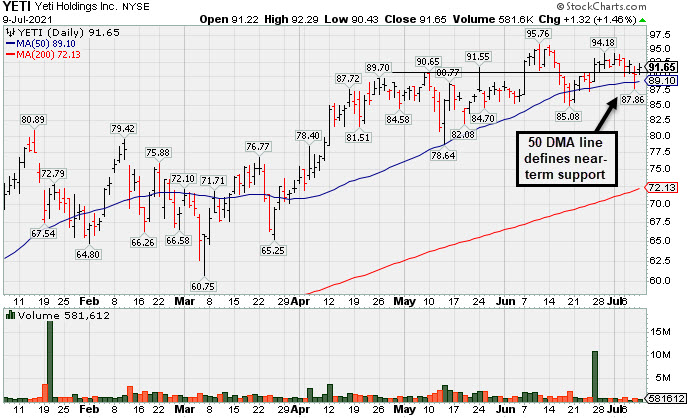
Yeti Holdings Inc's (YETI +$1.32 or +1.46% to $91.65) volume totals still have been cooling while consolidating near its 52-week high. That may be a taken as a sign that few investors have been headed to the exit. The 50-day moving average (DMA) line ($89.10) and prior low ($85.08 on 6/18/21) define near-term support to watch on pullbacks. Losses below those levels would raise concerns and trigger technical sell signals.
Fundamentals remain strong. YETI reported Mar 21 quarterly earnings +245% on +42% sales revenues versus the year ago period, its 7th consecutive quarterly earnings increase above the +25% minimum earnings guideline (C criteria) of the fact-based investment system. Its Earnings Per Share Rating is 85. Its annual earnings (A criteria) history has been strong. The Leisure-Products group currently has a B- (58) Group Relative Strength rating (L criteria) but it has been moving down.
There is a small supply of only 87.2 million shares outstanding (S criteria). The number of top-rated funds owning its shares rose from 310 in Dec '19 to 640 in Jun '21, a reassuring sign concerning the I criteria. Its current Up/Down Volume Ratio of 1.5 is an unbiased indication its shares have been under accumulation over the past 50 days. It completed Secondary Offerings on 5/12/20, 2/20/20, 11/08/19 and 5/08/19 after its $18 IPO on 10/25/18.
|
|
|
Color Codes Explained :
Y - Better candidates highlighted by our
staff of experts.
G - Previously featured
in past reports as yellow but may no longer be buyable under the
guidelines.
***Last / Change / Volume data in this table is the closing quote data***
Symbol/Exchange
Company Name
Industry Group |
PRICE |
CHANGE
(%Change) |
Day High |
Volume
(% DAV)
(% 50 day avg vol) |
52 Wk Hi
% From Hi |
Featured
Date |
Price
Featured |
Pivot Featured |
|
Max Buy |
 SIVB
-
NASDAQ
SIVB
-
NASDAQ
S V B Financial Group
BANKING - Regional - Pacific Banks
|
$575.24
|
+30.37
5.57% |
$576.68
|
434,410
115.23% of 50 DAV
50 DAV is 377,000
|
$608.84
-5.52%
|
4/23/2021
|
$579.70
|
PP = $577.16
|
|
MB = $606.02
|
 Most Recent Note - 7/9/2021 5:17:15 PM
Y - With today's big gain it rebounded and closed above its 50 DMA line ($569.40) which recently acted as resistance. The rebound helped its outlook to improve and its color code is changed to yellow. Confirming gains above the pivot point backed by at least +40% above average volume are still needed to help clinch a convincing technical buy signal. Reported earnings +293% on +64% sales revenues for the Mar '21 quarter versus the year ago period, its 3rd strong comparison. Completed a new Public Offering on 3/24/21.
>>> FEATURED STOCK ARTICLE : Consolidating Near 50-Day Average After Distributional Pressure - 6/25/2021 |
View all notes |
Set NEW NOTE alert |
Company Profile |
SEC
News |
Chart |
Request a new note
C
A
S
I |
LOGI
-
NASDAQ
Logitech Intl Sa
COMPUTER HARDWARE - Computer Peripherals
|
$126.18
|
-0.38
-0.30% |
$126.66
|
617,539
72.23% of 50 DAV
50 DAV is 855,000
|
$140.17
-9.98%
|
5/26/2021
|
$119.13
|
PP = $120.34
|
|
MB = $126.36
|
Most Recent Note - 7/7/2021 3:15:27 PM
G - Color code is changed to green after rising back above its "max buy" level with today's 3rd consecutive gain. Halted its slide after slumping near prior highs in the $120-117 area which define important support to watch along with its 50 DMA line ($119.56).
>>> FEATURED STOCK ARTICLE : Recent Pullback is Testing Important Technical Support - 7/2/2021 |
View all notes |
Set NEW NOTE alert |
Company Profile |
SEC
News |
Chart |
Request a new note
C
A
S
I |
CROX
-
NASDAQ
Crocs Inc
CONSUMER NON-DURABLES - Textile - Apparel Footwear
|
$117.00
|
+3.55
3.13% |
$117.38
|
670,120
41.91% of 50 DAV
50 DAV is 1,599,000
|
$118.68
-1.42%
|
6/14/2021
|
$112.64
|
PP = $110.01
|
|
MB = $115.51
|
Most Recent Note - 7/9/2021 5:20:07 PM
G - Color code is changed to green after matching its best-ever close with today's gain backed by light volume as it rose above its "max buy" level. Its prior highs in the $109 area and its 50 DMA line ($106.55) define support to watch on pullbacks. See the latest FSU analysis for more details and a new annotated graph.
>>> FEATURED STOCK ARTICLE : Quietly Consolidating Below "Max Buy" Level - 7/7/2021 |
View all notes |
Set NEW NOTE alert |
Company Profile |
SEC
News |
Chart |
Request a new note
C
A
S
I |
CRL
-
NYSE
Charles River Labs Intl
DRUGS - Biotechnology
|
$384.89
|
+5.69
1.50% |
$384.92
|
207,016
29.57% of 50 DAV
50 DAV is 700,000
|
$384.30
0.15%
|
6/9/2021
|
$345.91
|
PP = $349.23
|
|
MB = $366.69
|
Most Recent Note - 7/8/2021 5:20:31 PM
G - Below average volume was behind recent gains as it wedged into record high territory. Prior highs in the $349 area and its 50 DMA line ($345) define near-term support to watch on pullbacks. Two of the past 3 quarterly comparisons through Mar '21 have been above the +25% minimum earnings guideline (C criteria).
>>> FEATURED STOCK ARTICLE : Building New Base After Strong Quarterly Earnings Report - 6/9/2021 |
View all notes |
Set NEW NOTE alert |
Company Profile |
SEC
News |
Chart |
Request a new note
C
A
S
I |
GNRC
-
NYSE
Generac Hldgs Inc
Electrical-Power/Equipmt
|
$436.37
|
+9.77
2.29% |
$437.08
|
396,741
50.60% of 50 DAV
50 DAV is 784,000
|
$440.00
-0.83%
|
6/8/2021
|
$348.46
|
PP = $342.38
|
|
MB = $359.50
|
Most Recent Note - 7/6/2021 5:54:07 PM
G - Volume was +27% above average behind today's gain for yet another new all-time high, getting more extended from the previously noted base. Prior high ($364) defines initial support to watch on pullbacks. Fundamentals remain strong.
>>> FEATURED STOCK ARTICLE : Gap Up Gain With +118% Above Average Volume - 6/8/2021 |
View all notes |
Set NEW NOTE alert |
Company Profile |
SEC
News |
Chart |
Request a new note
C
A
S
I |
Symbol/Exchange
Company Name
Industry Group |
PRICE |
CHANGE
(%Change) |
Day High |
Volume
(% DAV)
(% 50 day avg vol) |
52 Wk Hi
% From Hi |
Featured
Date |
Price
Featured |
Pivot Featured |
|
Max Buy |
CAMT
-
NASDAQ
Camtek Ltd
ELECTRONICS - Scientific and Technical Instrum
|
$35.17
|
+0.77
2.24% |
$35.29
|
111,806
36.66% of 50 DAV
50 DAV is 305,000
|
$40.47
-13.10%
|
4/28/2021
|
$35.03
|
PP = $35.34
|
|
MB = $37.11
|
Most Recent Note - 7/8/2021 5:18:18 PM
G - Color code is changed to green after today's 5th consecutive loss on light volume undercut prior highs in the $35-36 area and its 50 DMA line ($34.50). It recovered to close in the upper third of its intra-day range. More damaging losses would raise greater concerns and trigger a technical sell signal. See the latest FSU analysis for more details and a new annotated graph.
>>> FEATURED STOCK ARTICLE : Loss With Light Volume Undercut 50-Day Moving Average - 7/8/2021 |
View all notes |
Set NEW NOTE alert |
Company Profile |
SEC
News |
Chart |
Request a new note
C
A
S
I |
ASML
-
NASDAQ
A S M L Holding N.V. NY
ELECTRONICS - Semiconductor Equipment and Mate
|
$691.36
|
+17.68
2.62% |
$693.00
|
578,393
76.71% of 50 DAV
50 DAV is 754,000
|
$710.97
-2.76%
|
5/25/2021
|
$669.59
|
PP = $675.75
|
|
MB = $709.54
|
Most Recent Note - 7/8/2021 12:17:48 PM
Y - Recently encountering distributional pressure, testing the prior high ($675) and its 50 DMA line ($668) which define important near-term support. More damaging losses would raise concerns and trigger technical sell signals.
>>> FEATURED STOCK ARTICLE : Volume Higher While Pulling Back Toward 50-Day Moving Average - 7/1/2021 |
View all notes |
Set NEW NOTE alert |
Company Profile |
SEC
News |
Chart |
Request a new note
C
A
S
I |
MED
-
NYSE
Medifast Inc
SPECIALTY RETAIL - Specialty Retail, Other
|
$284.22
|
+5.29
1.90% |
$286.45
|
95,127
77.97% of 50 DAV
50 DAV is 122,000
|
$336.99
-15.66%
|
5/11/2021
|
$285.72
|
PP = $279.56
|
|
MB = $293.54
|
Most Recent Note - 7/7/2021 3:09:36 PM
G - Quietly consolidating after undercutting the prior high in the $279 area and finding support near its 50 DMA line ($286). More damaging losses below the prior low ($258.77 on 6/17/21) would raise greater concerns and trigger a worrisome technical sell signal.
>>> FEATURED STOCK ARTICLE : Halted 10-Session Losing Streak Near Prior High and 50 DMA - 6/15/2021 |
View all notes |
Set NEW NOTE alert |
Company Profile |
SEC
News |
Chart |
Request a new note
C
A
S
I |
CLFD
-
NASDAQ
Clearfield Inc
TELECOMMUNICATIONS - Cables / Satalite Equipment
|
$37.57
|
+1.39
3.84% |
$37.84
|
57,321
48.17% of 50 DAV
50 DAV is 119,000
|
$43.64
-13.91%
|
6/4/2021
|
$40.01
|
PP = $40.36
|
|
MB = $42.38
|
Most Recent Note - 7/9/2021 5:18:30 PM
G - Posted a gain today with lighter than average volume yet closed above its 50 DMA line ($37.10) helping its outlook improve. Faces some resistance due to overhead supply up to the $43 level. Fundamentals remain strong.
>>> FEATURED STOCK ARTICLE : Consolidating Above 50-Day Moving Average Helped Outlook - 6/30/2021 |
View all notes |
Set NEW NOTE alert |
Company Profile |
SEC
News |
Chart |
Request a new note
C
A
S
I |
POOL
-
NASDAQ
Pool Corp
WHOLESALE - Basic Materials Wholesale
|
$476.24
|
+7.47
1.59% |
$476.69
|
249,692
100.28% of 50 DAV
50 DAV is 249,000
|
$474.26
0.42%
|
6/21/2021
|
$455.09
|
PP = $449.54
|
|
MB = $472.02
|
Most Recent Note - 7/6/2021 5:51:52 PM
Y - Volume totals have been cooling while hovering near its 52-week high. Prior highs in the $449-444 range define initial support to watch above its 50 DMA line ($438) on pullbacks.
>>> FEATURED STOCK ARTICLE : Volume-Driven Breakout After Orderly Consolidation - 6/21/2021 |
View all notes |
Set NEW NOTE alert |
Company Profile |
SEC
News |
Chart |
Request a new note
C
A
S
I |
Symbol/Exchange
Company Name
Industry Group |
PRICE |
CHANGE
(%Change) |
Day High |
Volume
(% DAV)
(% 50 day avg vol) |
52 Wk Hi
% From Hi |
Featured
Date |
Price
Featured |
Pivot Featured |
|
Max Buy |
FSBW
-
NASDAQ
F S Bancorp
Banks-West/Southwest
|
$70.10
|
+1.40
2.04% |
$71.09
|
17,912
111.95% of 50 DAV
50 DAV is 16,000
|
$73.62
-4.78%
|
5/18/2021
|
$70.16
|
PP = $73.72
|
|
MB = $77.41
|
Most Recent Note - 7/6/2021 12:39:25 PM
Y - Encountering distributional pressure today and while recently perched within striking distance of the pivot point cited based on its 3/08/21 high plus 10 cents. Consolidating near its 50 DMA line ($69.97) where it found prompt support during its ongoing ascent. Subsequent gains above the pivot point backed by at least +40% above average volume are needed to trigger a technical buy signal.
>>> FEATURED STOCK ARTICLE : Still Consolidating With Close Striking Distance of All-Time High - 6/24/2021 |
View all notes |
Set NEW NOTE alert |
Company Profile |
SEC
News |
Chart |
Request a new note
C
A
S
I |
SMPL
-
NASDAQ
Simply Good Foods Co
Food-Confectionery
|
$37.29
|
+0.12
0.32% |
$37.63
|
403,274
73.72% of 50 DAV
50 DAV is 547,000
|
$38.50
-3.14%
|
12/28/2020
|
$30.40
|
PP = $31.44
|
|
MB = $33.01
|
Most Recent Note - 7/7/2021 3:13:40 PM
G - Holding its ground stubbornly with volume totals cooling after hitting a new all-time high on 7/01/21 when last noted. Prior highs in the $35 area define near-term support to watch along with its 50 DMA line ($34.96). Reported May '21 quarterly earnings +65% on +32% sales revenues versus the year ago period, well above the +25% minimum earnings guideline (C criteria).
>>> FEATURED STOCK ARTICLE : Simply Wedging Into New High Territory - 6/14/2021 |
View all notes |
Set NEW NOTE alert |
Company Profile |
SEC
News |
Chart |
Request a new note
C
A
S
I |
SHOP
-
NYSE
Shopify Inc Cl A
Computer Sftwr-Enterprse
|
$1,494.99
|
+31.65
2.16% |
$1,496.92
|
1,251,923
83.18% of 50 DAV
50 DAV is 1,505,000
|
$1,587.74
-5.84%
|
7/2/2021
|
$1,468.00
|
PP = $1,552.23
|
|
MB = $1,629.84
|
Most Recent Note - 7/7/2021 1:04:06 PM
Y - Reversed into the red today after hitting a new high. A new pivot point was recently cited based on its 6/21/21 high while building on a cup-with-high-handle base. Confirming gains with at least +40% above average volume for new highs would trigger a new (or add-on) technical buy signal and be a reassuring sign of fresh institutional buying demand.
>>> FEATURED STOCK ARTICLE : Rebounding After Choppy 4-Month Consolidation - 6/16/2021 |
View all notes |
Set NEW NOTE alert |
Company Profile |
SEC
News |
Chart |
Request a new note
C
A
S
I |
YETI
-
NYSE
Yeti Holdings Inc
Leisure-Products
|
$91.65
|
+1.32
1.46% |
$92.29
|
581,612
39.19% of 50 DAV
50 DAV is 1,484,000
|
$95.76
-4.29%
|
5/13/2021
|
$84.20
|
PP = $90.65
|
|
MB = $95.18
|
Most Recent Note - 7/9/2021 5:15:00 PM
Y - Volume totals still have been cooling while consolidating near its 52-week high. The 50 DMA line ($89.10) and prior low ($85.08 on 6/18/21) define near-term support to watch on pullbacks. Fundamentals remain strong. See the latest FSU analysis for more details and a new annotated graph.
>>> FEATURED STOCK ARTICLE : Volume Totals Cooling While Consolidating Near High - 7/9/2021 |
View all notes |
Set NEW NOTE alert |
Company Profile |
SEC
News |
Chart |
Request a new note
C
A
S
I |
DOCU
-
NASDAQ
Docusign Inc
Computer Sftwr-Enterprse
|
$288.02
|
-0.72
-0.25% |
$290.00
|
1,494,778
47.53% of 50 DAV
50 DAV is 3,145,000
|
$293.65
-1.92%
|
7/6/2021
|
$288.96
|
PP = $290.33
|
|
MB = $304.85
|
Most Recent Note - 7/7/2021 12:29:45 PM
Y - Wedging into new high territory with today's gain backed by above average volume. Highlighted in yellow with pivot point cited based on its 9/02/20 high plus 10 cents. A gain and strong close above the pivot point cited backed by at least +40% above average volume may trigger a convincing new (or add-on) technical buy signal. Fundamentals remain strong after reporting very strong Apr '21 quarterly results. It went through a choppy consolidation then rebounded since noted on 3/03/21 when dropped from the Featured Stocks list. See the latest FSU analysis for more details and an annotated graph.
>>> FEATURED STOCK ARTICLE : Touched New High With Average Volume Behind Today's Gain - 7/6/2021 |
View all notes |
Set NEW NOTE alert |
Company Profile |
SEC
News |
Chart |
Request a new note
C
A
S
I |
Symbol/Exchange
Company Name
Industry Group |
PRICE |
CHANGE
(%Change) |
Day High |
Volume
(% DAV)
(% 50 day avg vol) |
52 Wk Hi
% From Hi |
Featured
Date |
Price
Featured |
Pivot Featured |
|
Max Buy |
JEF
-
NYSE
Jefferies Financial Grp
Finance-Invest Bnk/Bkrs
|
$31.93
|
+0.92
2.97% |
$32.02
|
2,445,850
118.85% of 50 DAV
50 DAV is 2,058,000
|
$34.98
-8.72%
|
6/28/2021
|
$31.81
|
PP = $34.42
|
|
MB = $36.14
|
Most Recent Note - 7/8/2021 5:23:27 PM
G - Color code is changed to green after a gap down today and 6th consecutive loss violated its 50 DMA line ($32.09) triggering a technical sell signal. Only a prompt rebound above the 50 DMA line would help its outlook improve. Subsequent gains above the pivot point backed by at least +40% above average volume are necessary to trigger a technical buy signal.
>>> FEATURED STOCK ARTICLE : High-Ranked Financial Firm Formed "Double Bottom" Base - 6/28/2021 |
View all notes |
Set NEW NOTE alert |
Company Profile |
SEC
News |
Chart |
Request a new note
C
A
S
I |
CLAR
-
NASDAQ
Clarus Corporation
Leisure-Products
|
$26.84
|
-0.15
-0.56% |
$27.20
|
131,203
57.29% of 50 DAV
50 DAV is 229,000
|
$27.95
-3.97%
|
5/12/2021
|
$21.40
|
PP = $19.73
|
|
MB = $20.72
|
Most Recent Note - 7/8/2021 5:19:10 PM
G - Paused at its 52-week high today after 7 consecutive gains. It did not form a sound base of sufficient length. Its 50 DMA line ($23.13) defines important near-term support to watch.
>>> FEATURED STOCK ARTICLE : Encountering Distributional Pressure After Recent Rally - 6/17/2021 |
View all notes |
Set NEW NOTE alert |
Company Profile |
SEC
News |
Chart |
Request a new note
C
A
S
I |
AVTR
-
NYSE
Avantor Inc
Medical-Research Eqp/Svc
|
$36.08
|
+0.53
1.49% |
$36.12
|
4,675,988
117.19% of 50 DAV
50 DAV is 3,990,000
|
$36.42
-0.93%
|
6/10/2021
|
$32.94
|
PP = $34.09
|
|
MB = $35.79
|
Most Recent Note - 7/6/2021 5:52:54 PM
G - Color code is changed to green after quietly rising back above its "max buy" level. Stubbornly held its ground and made gradual progress since triggering a technical buy signal. Prior highs in the $33 area define initial support to watch on pullbacks.
>>> FEATURED STOCK ARTICLE : Medical Research Firm Challenging Prior High - 6/10/2021 |
View all notes |
Set NEW NOTE alert |
Company Profile |
SEC
News |
Chart |
Request a new note
C
A
S
I |
|
|
|
THESE ARE NOT BUY RECOMMENDATIONS!
Comments contained in the body of this report are technical
opinions only. The material herein has been obtained
from sources believed to be reliable and accurate, however,
its accuracy and completeness cannot be guaranteed.
This site is not an investment advisor, hence it does
not endorse or recommend any securities or other investments.
Any recommendation contained in this report may not
be suitable for all investors and it is not to be deemed
an offer or solicitation on our part with respect to
the purchase or sale of any securities. All trademarks,
service marks and trade names appearing in this report
are the property of their respective owners, and are
likewise used for identification purposes only.
This report is a service available
only to active Paid Premium Members.
You may opt-out of receiving report notifications
at any time. Questions or comments may be submitted
by writing to Premium Membership Services 665 S.E. 10 Street, Suite 201 Deerfield Beach, FL 33441-5634 or by calling 1-800-965-8307
or 954-785-1121.
|
|
|